

Nutrition labels have been mandatory in New Zealand since December 2002. Food manufacturers must display a panel (Nutrition Information Panel, NIP) on products that provides a minimum level of nutrition information, an ingredient list and allergen declarations, alongside other standard information such as date marking.
By providing nutrition information to consumers at point of purchase, nutrition labels are an important tool to aid selection of healthier foods. However, they cannot be effective unless they are well used and understood. Self-reported use and understanding of nutrition labels is moderate to high in New Zealand and Australia(Reference Ni Mhurchu and Gorton1). However, objectively assessed use and understanding appears to be lower(Reference Ni Mhurchu and Gorton1). Despite high rates of reported use, Higginson et al.(Reference Higginson, Rayner, Draper and Kirk2) found that Scottish shoppers used nutrition labels for only 4 % of food purchases on an everyday shopping trip. This increased to 33 % of products when participants were asked to do a healthy shop. In another instance, when participants in New Zealand and Australia were asked to select the healthier of two products, as many chose the unhealthy (39 %) option as chose the healthy (35 %) option, despite a wide variation in sugar content(3). This suggests that current nutrition labels are not informing choice for many consumers in a meaningful way.
Most research on nutrition labels to date has focused on majority populations with the result that groups at greatest risk of nutrition-related disease have been largely under-represented. Forty-seven per cent of deaths among Maori (the indigenous people of New Zealand) are attributable to nutrition-related risk factors compared with 39 % among non-Maori(Reference Lawes, Stefanogiannis, Tobias, Paki Paki, Ni Mhurchu, Turley, Vander Hoorn and Rodgers4). Similarly, Pacific (people from any Pacific Island nation) and Asian peoples living in New Zealand have higher rates of nutrition-related conditions such as obesity(5) and diabetes(6) compared with New Zealand Europeans. A recent qualitative study among Maori, Pacific and low-income shoppers found very low reported use and understanding of labels(Reference Lanumata, Robinson, Signal, Tavila and Wilton7).
It has been recommended that consideration be given to ways of making nutrition labels more accessible and understandable for consumers(Reference Ni Mhurchu8, 9). The UK Food Standards Agency has sought to do this by recommending implementation of front-of-pack multiple traffic light (MTL) labels(10). This label format gives a coloured light – red (less healthy), amber (okay choice) or green (healthy choice) – to four key nutritional components in the food (total fat, saturates, sugar, salt). In New Zealand, the food industry has begun to voluntarily introduce front-of-pack percentage of daily intake (%DI) labels. These provide the level of a range of nutrients per serving along with the percentage contributed to the daily intake for an average adult (8700 kJ diet). Although many studies have assessed consumer preferences for various label formats, no clear consensus has emerged about the most useful format(Reference Ni Mhurchu8) and debate continues around the most effective format for front-of-pack signposting.
The primary objective of the present survey was therefore to investigate the use of nutrition labels by Maori, Pacific, Asian and New Zealand European shoppers. Secondary objectives were to assess ability to use nutrition labels to determine if a food was healthy and to investigate preference for, and understanding of, four different label formats. Survey findings relating to nutrition claims and association of nutrition label use with dietary quality are reported elsewhere(11).
Methods
Study design
Survey recruitment and completion were undertaken at a selection of supermarkets in Auckland, New Zealand, between 12 February and 5 April 2007. Ethical approval for the survey protocol and questionnaire was obtained from the Northern X Regional Ethics Committee.
Supermarkets
All Auckland supermarkets were identified from the 2006 Auckland telephone directory and geo-coded. Twenty-five supermarkets were chosen in areas in Auckland known to have higher populations (>10 %) of Maori and Pacific and/or Asian residents, based on 2001 Census mesh-block data. Budget supermarkets close to these areas were also included, as people may travel outside their local area to shop at these supermarkets. The twenty-five supermarkets encompassed five major supermarket chains, one smaller supermarket and five Asian supermarkets.
Research assistants conducting the survey visited supermarkets on random days and times (including weekends) in order to obtain a representative sample of shoppers.
Recruitment
Recruitment was stratified by ethnicity and participants from each major ethnic group were recruited by a research assistant fluent in their language (Maori, Samoan, Chinese (Cantonese- and Mandarin-speaking) and New Zealand European (English-speaking)). Ethnicity was self-reported on the survey form. Shoppers were approached as they exited the supermarket, and entry into a draw for a $NZ 500 supermarket voucher was used as an incentive to participate. Research assistants preferentially approached shoppers who appeared to be in their target ethnic group; however, they could enrol any participant who approached them. Participants were informed of the survey and consent was given by completing the survey form. Refusal rates were not collected.
Exclusion criteria
People below 18 years of age, unable to read any English (as food labels are written in English), not resident in New Zealand or visually impaired to the extent that they could not read labels were excluded from participating in the survey.
Sample size
The target sample size was 1250 shoppers, with approximately equal numbers from each of the four main ethnic groups. In Auckland, approximately 12 % of the population are Maori, 13 % Pacific, 13 % Asian and 62 % are European or Other ethnicities, based on 2001 Census data. The survey sample size was estimated to have at least 80 % power to detect a 10 % absolute difference between ethnic groups in the proportion of shoppers claiming to use nutrition labels.
Survey content and questions
Data were collected on use of nutrition labels (categorised as ‘always’, ‘usually’, ‘sometimes’, ‘rarely’ or ‘not at all’), reasons for non-use of labels, basic understanding and interpretation of current nutrition labels and claims, preference for and interpretation of four nutrition label formats, special dietary requirements, and sociodemographic details.
Understanding of labels was assessed by asking shoppers to calculate the total fat content per 100 g and sugar content per serving in a product carrying a sample NIP. The questions were intended to be simple and straightforward in order to assess basic understanding.
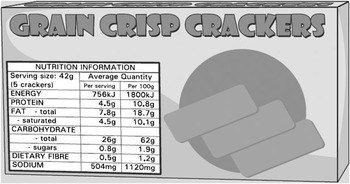
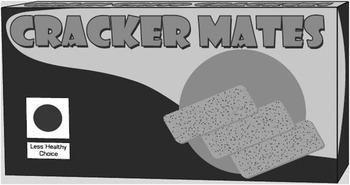
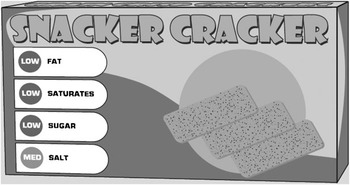
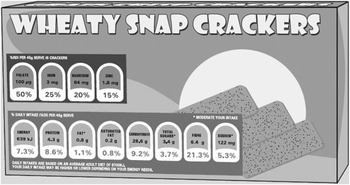
The four label formats tested were the NIP (Fig. 1), simple traffic light (STL; a green, orange or red rating for the whole food; Fig. 2), MTL (an individual green, orange or red rating for fat, saturated fat, salt and sugar content; Fig. 3) and %DI labelling (listing the percentage of daily intake for an average adult diet for a range of nutrients; Fig. 4). With reference to each label, participants were asked to decide whether the sample food (crackers) was ‘healthy’, ‘not healthy’ or ‘don’t know’, and to choose the label they liked best. The correct answer for the NIP product was ‘not healthy’ as it was high in fat, saturated fat and sodium (Na) and low in fibre (Fig. 1) as assessed by a registered dietitian (D.G.). The STL product simply had a red light with the words ‘less healthy choice’ (Fig. 2); thus it was considered ‘not healthy’. The MTL product was classed as ‘healthy’ as it had three green lights indicating it was low in fat, saturated fat and sugar (Fig. 3). Salt content was amber; however few crackers are likely to be low in Na. The %DI label product was also classed as ‘healthy’ as it was low in fat, saturated fat, sugar and salt, and high in fibre (Fig. 4).
Sample NIP (Nutrition Information Panel) label
Sample STL (simple traffic light) label
Sample MTL (multiple traffic light) label
Sample %DI (percentage of daily intake) label
The survey was pre-tested using a convenience sample and took approximately 15–20 min to complete.
Statistical analysis
Survey responses were entered into an Oracle database and then extracted into the SAS statistical software package version 9·1 (SAS Institute Inc., Cary, NC, USA) for analysis using PROC SURVEY procedures. All statistical tests were two-tailed, with a 5 % significance level maintained throughout analyses. All confidence intervals reported are 95 % confidence intervals. Analyses were weighted by ethnicity. The estimated total population for each ethnic group was obtained from 2001 Census data. Multiple logistic regression analysis (PROC SURVEYLOGISTIC in SAS) was used to determine if age, gender, ethnicity, education, special diet and household income predicted nutrition label use. Odds ratios and 95 % confidence intervals were calculated. For analysis purposes, label users were classified as those who ‘always’, ‘usually’ or ‘sometimes’ used labels, and label non-users were those who answered ‘rarely’ or ‘not at all’. Low income was defined as a total annual household income of ≤$NZ 40 000, medium household income as $NZ 40 001–80 000 and high household income as ≥$NZ 80 001.
Results
A total of 1525 shoppers completed the survey: 401 Maori, 347 Pacific, 372 Asian and 395 New Zealand European and Other (NZEO) ethnicities. Ten participants did not list ethnicity and were excluded from ethnic-specific analyses. The mean age of participants was 41 (sd 15) years; most were female (72 %), 34 % had a combined household income of ≤$NZ 40 000, and 42 % had a tertiary qualification (Table 1). Some participants reported special dietary requirements. Ten per cent of participants were vegetarian or vegan; 17 % were on a weight-loss diet; 8 % had food allergies; 21 % were on a special diet for medical reasons and 4 % for religious or ethical reasons. Note that participants could select more than one special dietary requirement.
Demographic characteristics of participants in a survey among ethnically diverse shoppers (n 1525) carried out at twenty-five supermarkets in Auckland, New Zealand, between February and April 2007
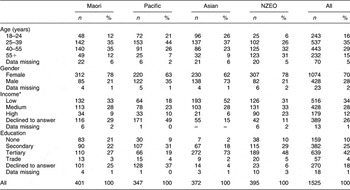
NZEO, New Zealand European and Other.
*Low, ≤$NZ 40 000; medium, $NZ 40 001–80 000; high, ≥$NZ 80 001.
Label use
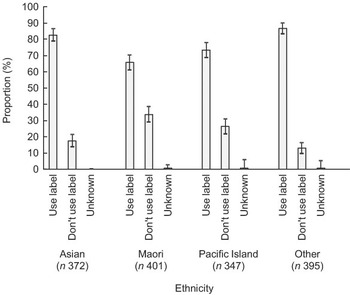
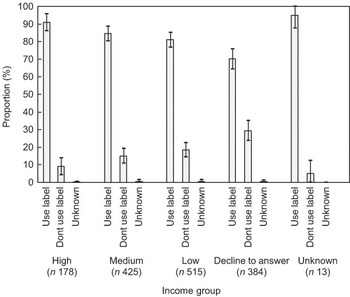
Weighted analyses showed that overall 82 % (95 % CI 80, 84 %) used labels (always, usually or sometimes). Reported label use was moderate to high across all ethnic (Fig. 5) and income (Fig. 6) groups. However, there were marked ethnic differences in label use ranging from 66 % (95 % CI 61, 70 %) for Maori to 87 % (95 % CI 83, 90 %) for NZEO.
Nutrition label use by ethnicity: survey among ethnically diverse shoppers (n 1525) carried out at twenty-five supermarkets in Auckland, New Zealand, between February and April 2007. Values are means with their 95 % confidence intervals represented by vertical bars
Nutrition label use by income (low, ≤$NZ 40 000; medium, $NZ 40 001–80 000; high, ≥$NZ 80 001): survey among ethnically diverse shoppers (n 1525) carried out at twenty-five supermarkets in Auckland, New Zealand, between February and April 2007. Values are means with their 95 % confidence intervals represented by vertical bars
Multiple logistic regression analysis was carried out to identify predictors of nutrition label use. Analyses adjusted for age, gender, ethnicity, household composition (number of children), special dietary requirements, income and education showed that the odds of participants using labels were significantly lower for 18–24-year-olds compared with 25–39-year-olds, for males compared with females, and for Maori compared with NZEO. The odds of using nutrition labels if shoppers had special dietary requirements was double that of participants with no special dietary requirements. The odds of using nutrition labels were also 1·7 times greater for medium-income households compared with low-income households.
The most common reason given for not using labels (‘rarely’ or ‘not at all’) was that they made no difference to the foods chosen because other things were more important (33 % of non-users). Nineteen per cent of non-users did not use labels because they already knew enough about food, 14 % did not use them because they did not understand them, while 9 % of non-use was due to not being interested in healthy eating.
Understanding of current NIP label format
Approximately two-thirds of shoppers were able to use the NIP to correctly estimate the amount of ‘total fat per 100 g’ (69 % (95 % CI 66, 72 %)) or ‘sugar per serving’ (65 % (95 % CI 62, 68 %)). There were no significant differences by ethnicity or income in ability to obtain this information from the NIP. However ethnic differences were seen in relation to appropriate interpretation of the nutrient information as ‘a lot’, ‘some’ or ‘not much’ (88 % (95 % CI 84, 91 %) for NZEO v. 68 % for both Maori (95 % CI 63, 72 %) and Asian (95 % CI 63, 73 %)). Shoppers from low-income households (75 % (95 % CI 71, 80 %)) were less likely than those from medium- or high-income households (93 % (95 % CI 89, 97 %)) to interpret correctly whether the amount of ‘fat per 100 g’ was ‘a lot’, ‘some’ or ‘not much’.
Label preference
Weighted analyses showed that overall the MTL label was preferred most often (34 % (95 % CI 31, 37 %)), followed by the NIP (26 % (95 % CI 23, 29 %)) and STL (24 % (95 % CI 21, 26 %)), with the least preferred being the %DI label (13 % (95 % CI 11, 15 %)). The MTL was preferred by all ethnic groups other than Pacific, who preferred the STL (42 % (95 % CI 37, 48 %)). Label non-users were more likely to ‘like’ or ‘really like’ MTL labels (55 %), compared with only 18 % of non-users who liked or really liked the NIP.
Ability of labels to impart meaningful information
To assess the usefulness of each of the four labels in deciding if a food was healthy, participants were asked whether they considered a sample food (crackers) to be ‘healthy’, ‘not healthy’ or ‘don’t know’ using the label. Overall, the STL format (83 % (95 % CI 81, 86 %)) was best able to be used to determine if a food was healthy, followed by the MTL (80 % (95 % CI 77, 82 %)). The NIP (54 % (95 % CI 51, 57 %)) and %DI (49 % (95 % CI 46, 53 %)) were less able to be used to determine healthiness of the food.
There were wide differences between ethnic groups in whether the NIP and %DI labels could be used to decide if a food was healthy or not. The NIP was able to be used to correctly identify if a food was healthy by one-third (36 % (95 % CI 32, 41 %)) of Maori and two-thirds (64 % (95 % CI 60, 69 %)) of NZEO shoppers. Likewise, the %DI label was able to be used to correctly identify if a food was healthy by one-third (32 % (95 % CI 28, 37 %)) of Maori, but two-thirds (70 % (95 % CI 66, 75 %)) of Pacific. It should be noted that 50 % (95 % CI 45, 55 %) of Maori selected ‘don’t know’ when using the %DI label to determine if the food was healthy. The differences between ethnic groups were far less marked with respect to the STL and MTL labels. The STL was able to be used to correctly identify if a food was healthy by 79 % (95 % CI 74, 83 %) of Pacific and Asian shoppers compared with 85 % (95 % CI 82, 89 %) of NZEO. The MTL was able to be used to correctly identify if a food was healthy by 71 % (95 % CI 66, 75 %) of Asian shoppers compared with 83 % (95 % CI 79, 86 %) of NZEO. Similar trends were seen for household income, with little difference between shoppers from high- or low-income households in ability of STL and MTL labels to be accurately used.
Discussion
The present survey of 1525 New Zealand shoppers found moderate to high reported use of nutrition labels, which varied by ethnic group and to a lesser extent by household income. Ability to estimate nutrient content of food using the NIP was similar across ethnic and income groups. However, ability to use the NIP to determine whether a food was healthy showed wide variation by ethnicity and income. Of the four label formats presented, MTL was the preferred format, although both MTL and STL were similarly successful at imparting understandable nutrition information.
The survey was the first to include large numbers of Maori, Pacific, Asian and low-income shoppers in New Zealand, and thus have the power to examine key ethnic differences in use and understanding of nutrition labels. It should be noted, however, that there may have been some degree of selection bias if consumers who agreed to complete the survey were more health-conscious and interested in nutrition labels than the population as a whole. Nineteen per cent of survey participants reported having received some form of training in nutrition. Despite this, there were still clear ethnic differences in use and understanding of nutrition labels. While demographic differences between ethnic groups in terms of age, education and household income may account for some of the ethnic differences observed in the survey, multiple regression analyses that adjusted for age, gender, ethnicity, children in the household, special diet, income and education showed that Maori ethnicity and low household income were still significant predictors of label non-use.
The overall level of reported label use found in the survey appears consistent with existing New Zealand data (which is mainly representing the NZEO group). Rates of use among Maori and Pacific were higher than might be expected from a previous qualitative study, where participants reported very low levels of label use(Reference Lanumata, Robinson, Signal, Tavila and Wilton7). However, they were lower than those found in a survey of African-Americans in North Carolina, where 78 % reported using labels ‘usually’, ‘often’ or ‘sometimes’(Reference Satia, Galanko and Neuhouser12). Among low-income groups, rates of label use were approximately 20 % higher compared with a US study, where low-income groups reported using labels on at least some occasions 55–65 % of the time when grocery shopping(Reference McArthur, Chamberlain and Howard13). The majority of the US participants were from federal assistance programmes, however, which may account for some of the difference with our survey.
One of the intended goals of food labels is to provide information that is easy to interpret, understand and use, in order that consumers can make informed choices(3). To be of benefit, labels must not only be used, but presented in a format that is understandable. The questions asked in the survey to determine consumer understanding of the NIP were simple and designed to test ability of the NIP to impart basic information. Despite this, only two-thirds of participants were able to find the information requested, with very little difference between groups. However, there were important ethnic differences in ability to determine if a food was healthy using different labels. The NIP was best understood by NZEO and high-income consumers. Conversely, traffic light labels performed best in classifying whether a food was healthy or not across all ethnic groups and income levels, thereby making the information accessible to all members of the community. Traffic light labels therefore appear to offer an equitable and effective way of providing front-of-pack nutrition information to all New Zealand shoppers. However, the ability of consumers to use different label formats to decide if a food is healthy or not may vary when nutrient values or traffic light colour combinations are less clear cut than in the present study.
In our survey, the MTL label format was clearly preferred by shoppers, including those who did not currently use labels. In a UK study which objectively measured how NIP and MTL labels were used with eye-tracking technology, addition of an MTL label reduced the cognitive workload for participants. More attention was paid to the MTL than NIP; it guided people to important nutrients and made healthiness ratings of the food more accurate(Reference Jones and Richardson14). The implementation of MTL labels in the UK followed extensive consumer research and testing(15, 16). Overall, MTL labels were the most effective and accurately used labels out of those tested. As well as being useful for assessing levels of individual nutrients and comparing products, the MTL label also performed best for people in lower socio-economic groups, for those with less education and for those who would not normally use labels(17).
In our survey, %DI labels performed poorly overall and showed no benefits over the current NIP labelling system. Fewer participants were able to use them to identify if a food was healthy than when using the NIP or traffic light labels. %DI labels provide more detail than traffic light labels and include levels of beneficial nutrients, which may make determining the healthfulness of food more complex. %DI was the label format least preferred by all participants. While they are being introduced as front-of-pack labels, their usefulness to consumers appears limited. Research for Food Standards Australia New Zealand suggests that this method of labelling is also likely to require extensive, hands-on, consumer education and be most useful for consumers who already use the NIP(18). Front-of-pack labels, however, should be making nutrition information more accessible for those who currently find labels difficult to use or understand.
A Health Select Committee Inquiry into Obesity and Type 2 Diabetes in New Zealand called for an ‘effective, clear, consistent system’ of food labelling, favouring a simple traffic light format(9). Our survey found that traffic light labels are better able to impart meaningful information to consumers than the other label formats tested, and are of assistance to consumers in deciding if a food is healthy. The Select Committee favoured a voluntary approach to front-of-pack labelling. However, voluntary front-of-pack labelling schemes, such as that implemented in the UK, have led to variable uptake and a variety of different formats being used by food manufacturers, creating potential for consumer confusion. If front-of-pack labelling were to be introduced in New Zealand, it should be a standardised, simple, mandatory format that complements detailed back-of-pack (NIP) labels, in order to be of greatest consumer benefit. Consumers have indicated that they prefer standardisation and consistency in labelling(16, 19), with front-of-pack labels placed on all products(16).
Future research
The feasibility of traffic light labels as front-of-pack signpost nutrition labels should be urgently investigated in New Zealand. Future labelling research should also determine the impact of nutrition label use on consumer behaviour and food purchases using electronic supermarket sales data.
Conclusions
There are clear ethnic disparities in understanding of the current mandatory food labels in New Zealand (NIP). Traffic light label formats, however, demonstrated high levels of understanding across ethnic and income groups. Traffic light labels thus appear to be an equitable and effective method of front-of-pack labelling to signpost the healthfulness of food. Their use as front-of-pack nutrition labels in New Zealand deserves strong consideration.
Acknowledgements
Source of funding:This research was funded by the National Heart Foundation of New Zealand (Grant 1198).
Conflicts of interest:The authors declare that they have no competing interests.
Author contributions:D.G. managed the research project and participated in study design, analyses and manuscript preparation. C.N.M. was the principal investigator and participated in all stages of the project including conceptualisation of the study, design, analysis and manuscript preparation. M.H.C. was the study statistician and participated in study design, conducted the analyses and collaborated on manuscript preparation. R.D. was a co-investigator and participated in study design and manuscript preparation.


