


Introduction
Parasites and pathogens are diverse and ubiquitous members of ecological communities that negatively impact host fitness (Lafferty and Kuris, Reference Lafferty and Kuris1999; Khan et al. Reference Khan, Provencher, Forbes, Mallory, Lebarbenchon and McCoy2019), including reduced host survival, reproduction, and growth, as well as changes in host behaviour (Combes, Reference Combes1996; Poulin, Reference Poulin2013; Malek and Breitburg, Reference Malek and Breitburg2016). The effects of parasites on their hosts can be both modulated and exacerbated by environmental conditions (Lafferty and Kuris, Reference Lafferty and Kuris1999), leading to variation of prevalence, intensity, and impact across time and space (Byers et al. Reference Byers, Blakeslee, Linder, Cooper and Maguire2008; Ziegler et al. Reference Ziegler, Atencio, Carroll and Byers2024). Local environmental conditions and biotic interactions can influence host–parasite dynamics and the risk of infection and parasite prevalence (Byers et al. Reference Byers, Blakeslee, Linder, Cooper and Maguire2008). However, local-scale drivers may be nested within larger regional patterns, such as seasons, temperature, differential dispersal patterns of vectors, or the molecular basis of the parasite–host interaction (Brown et al. Reference Brown, Mehlman and Stevens1995; Bushek and Allen, Reference Bushek and Allen1996; Farnsworth et al. Reference Farnsworth, Hoeting, Hobbs and Miller2006; Byers et al. Reference Byers, Blakeslee, Linder, Cooper and Maguire2008). To understand how parasites affect individual hosts and regulate the dynamics of entire communities, it is critical to investigate biotic and abiotic drivers as well as the variability of parasite prevalence and intensity across spatiotemporal scales.
The relationship between hosts, parasites, and their environment is complex (Malek and Byers, Reference Malek and Byers2017), particularly when the hosts are ecosystem engineers (Lenihan et al. Reference Lenihan, Micheli, Shelton and Peterson1999; Malek and Breitburg, Reference Malek and Breitburg2016; Malek and Byers, Reference Malek and Byers2017; Batchelor et al. Reference Batchelor, Harrison, Greiman, Treible and Carroll2023; Ziegler et al. Reference Ziegler, Atencio, Carroll and Byers2024), which provide physical structure and resources and modify abiotic conditions for other organisms (Jones et al. Reference Jones, Lawton and Shachak1997; Coen et al. Reference Coen, Brumbaugh, Bushek, Grizzle, Luckenbach, Posey, Powers and Tolley2007). Increases in parasite prevalence and intensity in ecosystem engineers can therefore cascade to affect the entire community (Malek and Breitburg, Reference Malek and Breitburg2016; Ziegler et al. Reference Ziegler, Atencio, Carroll and Byers2024). For example, increased disease prevalence in Acropora corals in the Indian Ocean driven by environmental stressors has led to reduced habitat complexity and biodiversity, causing an overall degradation of the reef community (Harvell et al. Reference Harvell, Kim, Burkholder, Colwell, Epstein, Grimes, Hofmann, Lipp, Osterhaus and Overstreet1999, Reference Harvell, Mitchell, Ward, Altizer, Dobson, Ostfeld and Samuel2002; Bruno and Selig, Reference Bruno and Selig2007; Sharma and Ravindran, Reference Sharma and Ravindran2020). Understanding how multiple environmental factors interact to influence host–parasite dynamics of ecosystem engineers is critical because infectious diseases are among many threats that have led to their global decline (Harvell et al. Reference Harvell, Kim, Burkholder, Colwell, Epstein, Grimes, Hofmann, Lipp, Osterhaus and Overstreet1999).
The eastern oyster, Crassostrea virginica, is a reef-building ecosystem engineer in coastal and estuarine environments ranging from New Brunswick, Canada to the Yucatan Peninsula, Mexico (Burford et al. Reference Burford, Scarpa, Cook and Hare2014). In addition to being a commercially valuable food product, oysters play an essential ecological role by creating complex habitats for numerous other species, improving water quality, and stabilizing shorelines (Grabowski and Peterson, Reference Grabowski, Peterson, Cuddington, Byers, Wilson and Hastings2007; Ehrich and Harris, Reference Ehrich and Harris2015; Walles et al. Reference Walles, Fodrie, Nieuwhof, Jewell, Herman and Ysebaert2016; Watts et al. Reference Watts, Carroll, Munroe and Finelli2018). A combination of factors, including overharvest, pollution, habitat loss and degradation, climate change and disease, have caused drastic reductions of up to 85% of global oyster populations (Rothschild et al. Reference Rothschild, Ault, Goulletquer and Heral1994; Lotze et al. Reference Lotze, Lenihan, Bourque, Bradbury, Cooke, Kay, Kidwell, Kirby, Peterson and Jackson2006; Worm et al. Reference Worm, Barbier, Beaumont, Duffy, Folke, Halpern, Jackson, Lotze, Micheli and Palumbi2006; Beck et al. Reference Beck, Brumbaugh, Airoldi, Carranza, Coen, Crawford, Defeo, Edgar, Hancock, Kay, Lenihan, Luckenbach, Toropova, Zhang and Guo2011; Zu Ermgassen et al. Reference Zu Ermgassen, Spalding, Blake, Coen, Dumbauld, Geiger, Grabowski, Grizzle, Luckenbach and McGraw2012; Bersoza Hernández et al. Reference Bersoza Hernández, Brumbaugh, Frederick, Grizzle, Luckenbach, Peterson and Angelini2018), with subsequent consequences for coastal communities, leading to declines in fisheries and ecosystem function (Grabowski and Peterson, Reference Grabowski, Peterson, Cuddington, Byers, Wilson and Hastings2007; Beck et al. Reference Beck, Brumbaugh, Airoldi, Carranza, Coen, Crawford, Defeo, Edgar, Hancock, Kay, Lenihan, Luckenbach, Toropova, Zhang and Guo2011). Due to the economic and ecological importance of oysters, considerable investments have been allocated to oyster aquaculture, management and restoration. The success of management efforts has faced many challenges, including parasites (Andrews, Reference Andrews1988; Lewis et al. Reference Lewis, Kern, Rosenfield, Stevens, Walker and Heffernan1992; Ewart and Ford, Reference Ewart and Ford1993).
Eastern oysters are susceptible to several parasites, including Perkinsus marinus, which causes Dermo disease, and Haplosporidium nelsoni, which causes MSX disease. Both parasites lead to reduced growth and reproduction, and eventually death (Burreson and Ragone Calvo, Reference Burreson and Ragone Calvo1996; Ford and Tripp, Reference Ford, Tripp, Kennedy, Newell and Eble1996; Malek and Byers, Reference Malek and Byers2017), and both have been implicated in mass mortality events throughout the range of eastern oysters (Andrews, Reference Andrews1988; Burreson, Reference Burreson1994; Burreson and Ragone Calvo, Reference Burreson and Ragone Calvo1996; Carnegie and Burreson, Reference Carnegie, Burreson, Woo and Buchmann2012). However, the mechanisms for infection and spread are different across the 2 protozoans. Transmission of P. marinus is related to host density; the infective stages enter the water column through faeces and pseudofaeces from live, infected oysters and are subsequently directly ingested by oysters during filter feeding. (Ford and Tripp, Reference Ford, Tripp, Kennedy, Newell and Eble1996; Bushek et al. Reference Bushek, Ford and Chintala2002; Malek and Byers, Reference Malek and Byers2017). Once inside the oyster, P. marinus proliferates within haemocytes, eventually killing the haemocyte and releasing P. marinus cells that spread into various tissues until the infection becomes systemic (Burreson and Ragone Calvo, Reference Burreson and Ragone Calvo1996; Bushek and Allen, Reference Bushek and Allen1996). Unlike P. marinus, the spread of H. nelsoni is independent of oyster density, fairly uniform over large areas of high salinity portions of estuaries (Ford and Tripp, Reference Ford, Tripp, Kennedy, Newell and Eble1996) and likely involves an intermediate host (Burreson, Reference Burreson1994). Within the oyster, H. nelsoni forms multinucleated plasmodia that can occur in the connective tissue or epithelium of all oyster tissue (Ford and Tripp, Reference Ford, Tripp, Kennedy, Newell and Eble1996; Carnegie and Burreson, Reference Carnegie, Burreson, Woo and Buchmann2012).
Given the negative impacts of both protozoan parasites, the roles that temperature and salinity play in diseases caused by P. marinus (Dermo) and H. nelsoni (MSX) have been extensively investigated (Haskin and Ford, Reference Haskin and Ford1982; Soniat, Reference Soniat1985; Paynter and Burreson, Reference Paynter and Burreson1991; Ewart and Ford, Reference Ewart and Ford1993). Rapid proliferation occurs in waters >20°C (Guo and Ford, Reference Guo and Ford2016), and mortality events are usually tied to high parasite prevalence coupled with high temperatures. Additionally, high salinity (>15 ppt) – typically increasing throughout spring and summer months in the southeastern USA – drives the proliferation and abundance of P. marinus and H. nelsoni (Ford and Haskin, Reference Ford and Haskin1982; Paynter and Burreson, Reference Paynter and Burreson1991). Heightened impacts and range expansion of diseases may be caused by rising temperatures associated with climate change and dry conditions that produce increasing salinity in estuaries (Cook et al. Reference Cook, Folli, Klinck, Ford and a1998; Harvell et al. Reference Harvell, Kim, Burkholder, Colwell, Epstein, Grimes, Hofmann, Lipp, Osterhaus and Overstreet1999; Guo and Ford, Reference Guo and Ford2016; Carnegie et al. Reference Carnegie, Ford, Crockett, Kingsley-Smith, Bienlien, Safi, Whitefleet-Smith and Burreson2021). Other environmental factors such as low dissolved oxygen (DO) can decrease oyster immune response and allow for the progression of parasite infections (Breitburg et al. Reference Breitburg, Hondorp, Audemard, Carnegie, Burrell, Trice and Clark2015). Low DO or hypoxia-related immunological suppression decreases oyster tissue pH as a result of a buildup of CO2, benefiting parasite proliferation and increasing the severity of disease (Paynter, Reference Paynter1996; Lenihan et al. Reference Lenihan, Micheli, Shelton and Peterson1999).
Though studies have investigated how multiple environmental factors drive Dermo and MSX disease dynamics (Lenihan et al. Reference Lenihan, Micheli, Shelton and Peterson1999; Batchelor et al. Reference Batchelor, Harrison, Greiman, Treible and Carroll2023; Ziegler et al. Reference Ziegler, Atencio, Carroll and Byers2024), knowledge gaps remain regarding how water quality parameters synergistically influence the prevalence and intensity of P. marinus and H. nelsoni across a small spatial scale and over time. Therefore, we sought to determine the combined effects of temperature, salinity, DO and pH on the disease dynamics of these 2 protozoan parasites infecting oysters across sites in close spatial proximity, but that experience variable water quality conditions. Specifically, we examined patterns of prevalence and intensity for both parasites at 4 sites on Sapelo Island, Georgia, USA and assessed which combination of water quality parameters were most influential in driving the patterns of infection prevalence and intensity. We predicted that prevalence and intensity of both parasites would follow a seasonal pattern, peaking when water temperature and salinity was highest and that parasite prevalence and intensity would increase as DO and pH decrease.
Materials and methods
Study location and sampling
In order to explore how both P. marinus and H. nelsoni parasites are driven by local water quality conditions, we collected oysters from 4 sites around the Sapelo Island National Estuarine Research Reserve (SINERR) that have continuous water quality monitoring data as part of the National Estuarine Research Reserve (NERR) System-Wide Monitoring Program (SWMP): Hunt Camp (31°28’43”N 81°16’22”W), Cabretta Creek (31°26’19”N 81°14’19”W), Dean Creek (31°23’41”N 81°16’11”W) and Ferry Dock (31°25’04”N 81°17’46”W) (Figure 1). At biweekly intervals from April through October 2023, oysters were haphazardly sampled at each site. Initially, we excavated all live oysters from a single 0.25 m × 0.25 m quadrat for the first 3 collections. However, to reduce impacts of continued sampling on the same reefs, starting in June, we haphazardly collected 3–4 oyster culms per collection. For all sampling, oysters were returned to the lab and frozen until processing. In the lab, individual oysters were separated and cleaned, measured for left valve lengths (LVL) and width (in mm), weighed, and dissected. A small piece of gill tissue sample (>150 mg) was excised from 10 randomly selected oysters, preserved in 95% ethanol and stored at −20°C until later DNA extraction (see Table S1 for total numbers of oysters sampled).
SINERR SWMP sites where oyster samples were collected from April through October 2023.

Genomic DNA was extracted from oyster gill tissue using an Omega E.Z.N.A® Mollusc and Insect Extraction Kit following the protocol provided by the manufacturer (Omega Bio-tek, Inc., Norcross, GA, USA). Extracted DNA was quantified using a NanoDropTM 2000 Spectrophotometer (Thermo Scientific, Wilmington, DE, USA), standardized to 200 ng/µL, and then stored at −20°C. A TaqMan probe based Quantitative real-time PCR (qPCR) assay was used to determine the prevalence and intensity of P. marinus and H. nelsoni. qPCR reactions were run on Applied Biosystems StepOnePlus real-time PCR machine using the primers, TaqMan probes, and protocols for P. marinus (ITS1 gene; Gauthier et al. Reference Gauthier, Miller and Wilbur2006) and for H. nelsoni (18S rDNA gene; Wilbur et al. Reference Wilbur, Ford, Gauthier and Gomez-Chiarri2012). To generate standard curves for assessment of parasite intensities, laboratory-synthesized double-stranded DNA fragments overlapping the amplicons for P. marinus and H. nelsoni (Eurofins Genomics, Louisville, KY, USA) were used. Briefly, we made seven 10-fold dilutions ranging from 10 to 10 000 000 gene copies using stock solution to construct standard curves. Parasite DNA standards and negative controls (RNA-se free water) were run in triplicate. To screen for P. marinus, each 15 µL reaction contained 1 µL template DNA, 3.6 µL RNase-free water, 7.5 µL Taqman® Master Mix, 1.2 µL forward primer, 1.2 µL reverse primer and 0.5 µL probe (2.9 µL primer-probe mater mix). To screen for H. nelsoni, each 15 µL reaction contained 1 µL template DNA, 2.1 µL RNA-se free water, 7.5 µL Taqman® Master Mix, 1.2 µL forward primer, 1.2 µL reverse primer and 2 µL probe (4.4 µL primer-probe master mix).
StepOnePlus V2.3 software was used to calculate critical threshold (Ct) and gene copy number values. Results from qPCR indicate the quantity of parasite gene copies per 200 ng of genomic DNA from within each 15 µL reaction. The parasite was considered to be present within the oyster host in any sample in which the parasite DNA was detected. Infection intensity was the abundance of the parasite DNA within the host, which correlated to the measure of gene detection quantity per sample.
Data analysis
To examine patterns in parasite prevalence, we calculated the prevalence of P. marinus and H. nelsoni separately as the number of infected oysters divided by the total number of oysters collected during each sampling event at each site. We then calculated mean percent prevalence and intensity for both parasites at each site across the cumulative April through October sampling period. Intensity was defined as described above. To determine if parasite prevalence or intensity differed between sites, a one-way analysis of variance (ANOVA) was performed with the random effect of site and parasite prevalence or intensity as the categorical or numerical response variable, respectively. To assess differences among individual sites, post-hoc multiple comparisons were made using the Tukey’s HSD test. Prior to conducting the one-way ANOVA, data were tested for the assumption of normality using a Shapiro–Wilks test and heteroscedasticity using a Levene’s test. To assess if P. marinus and H. nelsoni randomly associate with one another across the 4 study sites, co-infection was examined using a Chi Square Test of Independence using the observed and expected number of individuals co-infected by both parasites.
To determine the most influential water quality parameters and times in driving oyster parasite prevalence and intensity, we obtained water quality (temperature, salinity, DO, pH) data, collected every 15 minutes at each of the 4 SWMP stations from the NERR Centralized Data Management Office (CDMO; https://cdmo.baruch.sc.edu/). We calculated the mean, maximum, minimum and variance of temperature, salinity, DO and pH for the month of, 1 month prior to, and 2 months prior to each collection date. We used a Pearson’s correlation matrix to assess collinearity among water quality parameters, and if correlation coefficients were greater than 0.7, they were excluded from being used in the same model.
To prevent model redundancy, we independently ran binomial mixed models with a logit link using individual water quality variables for fixed factors (minimum temperature month of, mean salinity month of, mean temperature 1 month prior, minimum DO 2 months prior, etc.) with the random effect of site. From the best-fit models of water quality variables, the fixed factors were extracted and included in a full model with the top predictor water quality variables combined. We then ran a series of generalized linear models with a logit link to assess the presence (1: present, 0: absent) of P. marinus and H. nelsoni independently. To assess the intensity (cell detection quantity) of each parasite, we ran a series of generalized linear models without a logit link and a normal distribution on log transformed intensity values [log (parasite cell detection quantities/200 ng template DNA)]. Perkinsus marinus and H. nelsoni presence and intensity were modeled as a function of temperature, salinity, DO and pH as fixed effects; because there was no replication within sites, site was not included as a random effect in generalized linear models. Models that produced the greatest R 2 values were ranked to determine which combination of environmental factors was most influential in driving P. marinus and H. nelsoni presence and intensity. All models were run using the lme4 package in R (Bates et al. Reference Bates, Mächler, Bolker and Walker2015).
We used the ‘dredge’ function in the MuMIn package (Bartoń, Reference Bartoń2015) to compare every possible combination of water quality parameters in top fit models against one another. Akaike information criterion corrected for small sample size (AICc) were examined for each model output, and the difference between AICc for a given model and the model with the minimum AICc (ΔAICc) was calculated. For each response variable, we considered the top model (i.e., lowest AICc), and models with ΔAICc < 2 for interpretation. Statistical analyses were performed in R version 4.4.1 (R Development Core Team, 2025).
Results
Overall parasite patterns
A total of 882 oysters, ranging from 11 to 147 mm LVL were harvested during the 7-month sampling period. To explore parasite patterns, 439 of those oysters across all sites and timepoints were subsequently examined, ranging from 11 to 138 mm LVL, and 388 oysters had at least one parasite species present (either P. marinus or H. nelsoni, or both) for an overall prevalence of 88.4% (Table S1). In addition, 34.4% of all oysters sampled were co-infected by both parasites and there was a higher-than-expected probability of coinfection between these two parasites (Chi-square, X 2 = 158.58, P < 0.001). Including co-infected oysters, 45.3% of oysters across all sites and timepoints were infected by P. marinus (Dermo) and 77.5% of oysters were infected by H. nelsoni (MSX) across all time points.
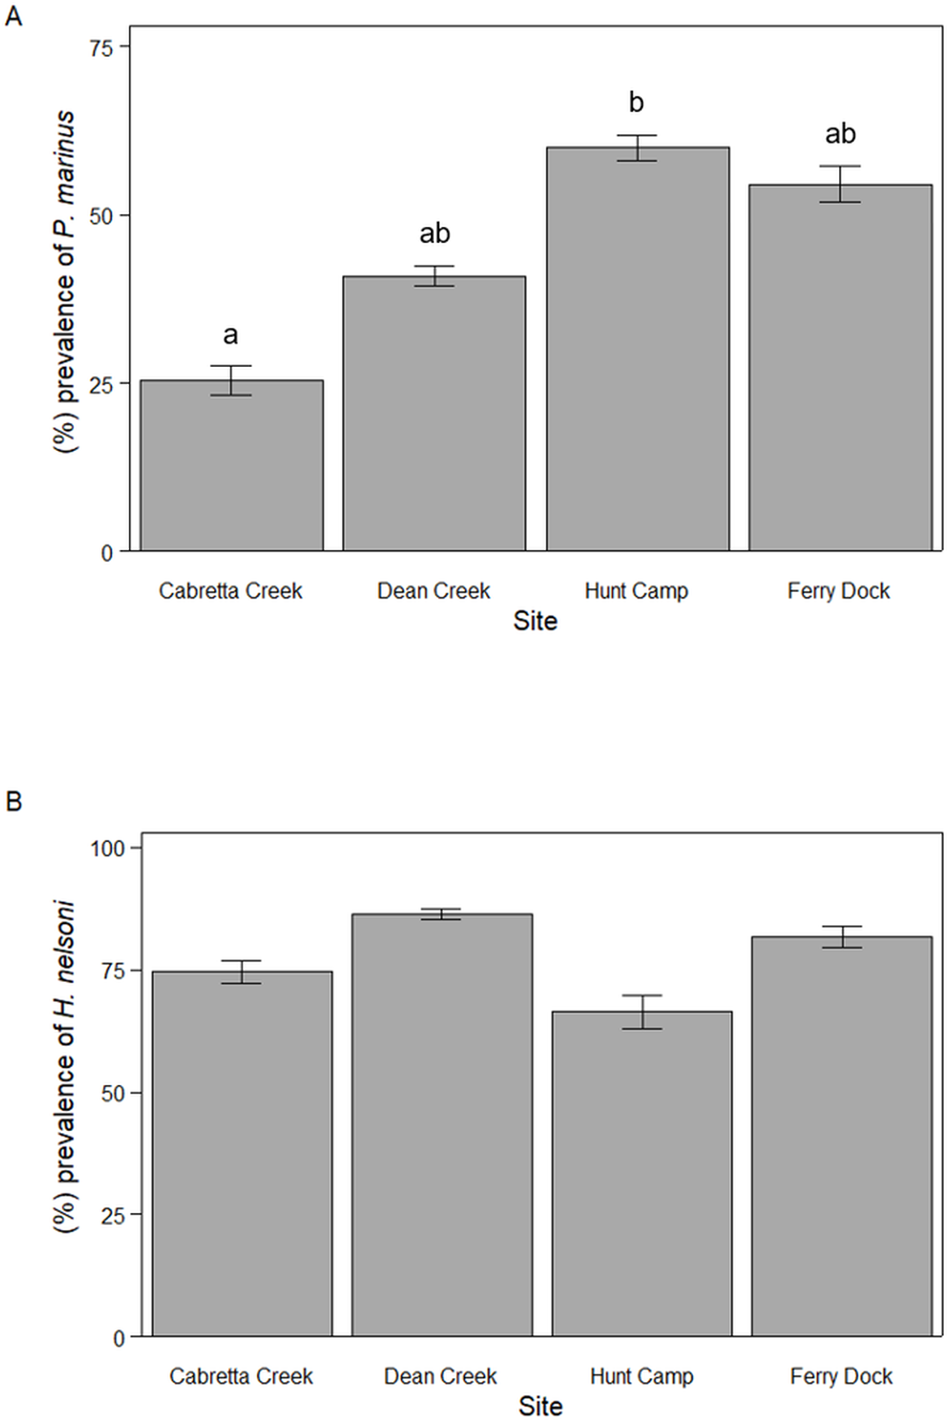
For P. marinus, mean percent prevalence throughout the April to October sampling period varied among sites with 25.5 ± 6.9% (mean ± SE) of oysters infected at Cabretta Creek, 40.9 ± 11.2% at Dean Creek, 60.0 ± 6.0% at Hunt Camp and 54.6 ± 8.6% at Ferry Dock (ANOVA, F 3,38 = 3.58, P = 0.023; Figure 2A). Mean percent prevalence was 34.5% higher at Hunt Camp than Cabretta Creek (Tukey HSD, P = 0.027) but was not statistically different across other site combinations. Mean percent prevalence for H. nelsoni was less variable and not significantly different among sites; 74.5 ± 7.4% of oysters were infected at Cabretta Creek, 86.4 ± 3.4% at Dean Creek, 66.4 ± 10.6% at Hunt Camp and 81.8 ± 6.9% at Ferry Dock (ANOVA, F 2,39 = 0.816, P = 0.493; Figure 2B).
Mean parasite prevalence from April through October 2023 for (A) P. marinus and (B) H. nelsoni across sites on Sapelo Island, GA, USA. Letters denote statistically significant differences.

Mean intensity of P. marinus was relatively high and did not differ across sites (ANOVA, F 3,195 = 0.499, P = 0.683). When P. marinus was detected, mean log quantity was 3.31 ± 0.23 DNA copies per 200 ng tissue (1.66 × 10⁶ ± 1.2 × 10⁵ copies per gram tissue; mean ± SE) at Cabretta Creek, 3.65 ± 0.17 at Dean Creek, 3.51 ± 0.11 at Hunt Camp and 3.66 ± 0.12 at Ferry Dock (Figure 3A). Likewise, the mean intensity of H. nelsoni was not different across sites (one-way ANOVA, F 3,336 = 0.926, P = 0.492). When H. nelsoni was detected, mean log quantity was 3.93 ± 0.16 DNA copies per 200 ng tissue at Cabretta Creek, 3.87 ± 0.16 at Dean Creek, 3.71 ± 0.19 at Hunt Camp and 4.12 ± 0.17 at Ferry Dock (Figure 3B).
Mean parasite intensity (log scaled) from April through October 2023 for (A) P. marinus and (B) H. nelsoni across sites on Sapelo Island, GA, USA.

Collinearity and reduction of parameters
There was a strong positive correlation between the mean, maximum, and minimum for temperature within the same time-period [e.g., mean temperature 2 months prior and minimum temperature two months prior were highly correlated (r = 0.95)]. The following correlation coefficients were greater than 0.7 (or less than − 0.7) and therefore not included in full models: maximum temperature 1 month prior and mean DO 1 month prior (r = − .83) and maximum temperature 2 months prior and mean DO 1 month prior (r = − 0.77). Across all models, pH performed poorly as a predictor variable for the prevalence and intensity of both parasites compared to temperature, salinity, DO; therefore, pH was not incorporated into full models.
Drivers of parasite prevalence and intensity
Perkinsus marinus prevalence
There was one top fit model explaining P. marinus prevalence across all sites (R2 = 0.207; Table 1) and had main effects that included positive predictors of minimum temperature 2 months prior (β = 1.57) and mean salinity month of (β = 0.049) and a negative predictor of minimum DO 1 month prior (β = − 0.24; Figure 4). Perkinsus marinus prevalence changed through time at each site in response to the water quality variables (T, S, DO) indicated by the top model (Supplemental Figure S1A-G).
Influence of environmental variables from the model with the lowest AICc and highest R 2 for P. marinus presence of individual oysters at each site on Sapelo Island, GA, USA. Perkinsus marinus presence is a function of minimum temperature 2 months prior, mean salinity month of, and minimum dissolved oxygen 1 month prior. Squares are partial residuals for each variable that take into account the influence of other fixed variables in the model. Trendlines indicate conditional fit of the model.

Models explaining the influence of water quality variables on 4 oyster response variables from oysters sampled across 4 sites on Sapelo Island, GA, USA. Explanatory variables from models include variation in time and summary statistic data for water temperature (oC), salinity (ppt) and dissolved oxygen (DO) (mg/L). The best-fit models (ΔAICc value < 2) are shown for each response variable. The standardized beta coefficients with each independent variable are shown for each model. Degrees of freedom (df), log likelihood, AICc, ΔAICc and marginal R 2 (R 2m) are included for each model

Perkinsus marinus intensity
Three competing models were found to explain P. marinus intensity (Table 1), although the best performing model included main effects of mean temperature 2 months prior (β = 0.65), mean DO month of (β = 0.33) and mean salinity month of (β = 0.38) was a poor fit (R2 = 0.05; Supplemental Figure S2).
Haplosporidium nelsoni prevalence
The top fit model explained 26.8% variation of the H. nelsoni prevalence (R2 = 0.268; Table 1). The best performing model had main effects of temperature variance 1 month prior (β = 2.22), mean salinity 2 months prior (β = 2.30) and mean DO 1 month prior (β = 0.99; Figure 5). Haplosporidium nelsoni prevalence remained high with little variability throughout the sampling period (Supplemental Figure S3A-G).
Influence of environmental variables from the model with the lowest AICc and highest R 2 for H. nelsoni presence of individual oysters at each site on Sapelo Island, GA, USA. Haplosporidium nelsoni presence is a function of temperature variance 1 month prior, mean salinity 2 months prior, and mean dissolved oxygen 1 month prior. Squares are partial residuals for each variable that take into account the influence of other fixed variables in the model. Trendlines indicate conditional fit of the model.

Haplosporidium nelsoni intensity
As with P. marinus, three competing models were found to explain H. nelsoni intensity (Table 1). The best performing model (R2 = 0.275) had main effects that included a positive predictor of mean DO two months prior (β = 1.51) and negative predictors of minimum temperature 1 month prior (β = − 0.57), and minimum salinity 2 months prior (β = − 0.76; Figure 6).
Influence of environmental variables from the model with the lowest AICc and highest R 2 on H. nelsoni intensity within individual oysters at each site on Sapelo Island, GA, USA. Haplosporidium nelsoni intensity is a function of minimum temperature 1 month prior, minimum salinity 2 months prior, and mean dissolved oxygen 2 months prior. Squares are partial residuals for each variable that take into account the influence of other fixed variables in the model. Trendlines indicate conditional fit of the model.

Discussion
The protozoan oyster parasites Perkinsus marinus and Haplosporidium nelsoni exhibit high prevalence and intensity across four sites in Sapelo Island, Georgia – almost 90% of oysters sampled had at least 1 parasite. High prevalence and intensity of these parasites was expected, as the prevalence of parasites from our earlier surveys on Sapelo Island was 93% in the summer (Batchelor et al. Reference Batchelor, Harrison, Greiman, Treible and Carroll2023). High overall prevalence and/or intensity of both parasites is common throughout southeastern US estuaries in summer surveys (Bobo et al. Reference Bobo, Richardson, Coen and Burrell1997; Wilbur et al. Reference Wilbur, Ford, Gauthier and Gomez-Chiarri2012; Ziegler et al. Reference Ziegler, Atencio, Carroll and Byers2024). The water quality conditions of southeastern estuaries are amenable to the rapid proliferation of both protozoan parasites – when temperatures exceed 20oC and salinities are greater than 15 ppt (Ford and Haskin, Reference Ford and Haskin1982; Guo and Ford, Reference Guo and Ford2016) – with low summer DO conditions which can impair oyster immune responses (Breitburg et al. Reference Breitburg, Hondorp, Audemard, Carnegie, Burrell, Trice and Clark2015). Additionally, oysters in the southeast are almost exclusively intertidal (Bahr and Lanier, Reference Bahr and Lanier1981), which could also lead to higher parasite prevalence (Malek and Byers, Reference Malek and Byers2017). Thus, the overall conditions common in coastal Georgia and throughout the southeastern USA can cause physiological stress to oysters that maximizes parasite transmission and proliferation (Lafferty and Kuris, Reference Lafferty and Kuris1999; Byers, Reference Byers2021; Ziegler et al. Reference Ziegler, Atencio, Carroll and Byers2024). The synergistic effects of these environmental factors likely contribute to the complex parasite dynamics in oysters in coastal Georgia.
Both disease-causing parasites showed at least some spatial variability across study sites, despite their relatively close geographic proximity. Natural and anthropogenically driven spatial variation in environmental parameters can result in spatial variation in parasites by directly affecting the host, the pathogen, or both (Breitburg et al. Reference Breitburg, Hondorp, Audemard, Carnegie, Burrell, Trice and Clark2015). At large scales, increased heterogeneity in physical and biological conditions can lead to high variability of parasites (Byers et al. Reference Byers, Blakeslee, Linder, Cooper and Maguire2008). In oysters, recent studies have shown that parasite prevalence is universally high across a relatively large spatial scale (e.g., the Georgia coast; Batchelor et al. Reference Batchelor, Harrison, Greiman, Treible and Carroll2023) and driven by a combination of both local and landscape-level factors (Ziegler et al. Reference Ziegler, Atencio, Carroll and Byers2024). However, these previous studies have sampled at just one or a few timepoints when prevalence is expected to be highest, so universally high prevalence across large spatial scales may be an artefact of sampling. Unlike many previous studies, we sampled biweekly across an entire season, which was critical to demonstrate fine-scale spatiotemporal variability in parasite prevalence and link the parasites to multiple environmental factors. While temperature and salinity exceeded critical parasite thresholds across all sites and sampling timepoints, there was variability in water quality conditions among the study sites which likely influenced our observed parasite variability.
For P. marinus, both temperature and DO were important predictor variables in the best fit model. This parasite tends to proliferate once water temperatures exceed 20oC (Guo and Ford, Reference Guo and Ford2016), and higher temperatures lead to increased parasite metabolism and replication within hosts, thereby accentuating parasite transmission and spread (Harvell et al. Reference Harvell, Kim, Burkholder, Colwell, Epstein, Grimes, Hofmann, Lipp, Osterhaus and Overstreet1999; Lafferty, Reference Lafferty2009; Byers, Reference Byers2021). Additionally, as monthly temperatures increase throughout the year and affect covarying factors such as DO, it may lead to oyster physiological stress and compromise their ability to fight infection, thus allowing parasite abundance to increase within oyster hosts and spread throughout the water column at key times during the year (Ewart and Ford, Reference Ewart and Ford1993; Cook et al. Reference Cook, Folli, Klinck, Ford and a1998; Breitburg et al. Reference Breitburg, Hondorp, Audemard, Carnegie, Burrell, Trice and Clark2015; Malek and Byers, Reference Malek and Byers2017). Thus, we observed prevalence at Cabretta Creek, Dean Creek and Ferry Dock increase throughout the sampling period, peaking in the late summer to early fall when temperature was highest and DO was lowest, while we observed high prevalence with low variability at Hunt Camp. Salinity was also included in the top models for P. marinus prevalence and intensity; however, it unexpectedly was negatively correlated with both response variables. Literature suggests that P. marinus also increases with salinity (Paynter and Burreson, Reference Paynter and Burreson1991; Burreson and Ragone Calvo, Reference Burreson and Ragone Calvo1996), but the overall high (euryhaline) salinity conditions with low variability across sites during the sampling period may explain the model results. Alternatively, perhaps this parasite prefers intermediate salinity causing proliferation and abundance to decrease as waters become more oceanic (Batchelor et al. Reference Batchelor, Harrison, Greiman, Treible and Carroll2023).
When exploring environmental drivers of P. marinus, there also appears to be a time-delay in the relationship between water quality parameters and increased parasite prevalence.
Lag-effects of environmental parameters on parasites occur in several other host–parasite interactions. For example, in temperate boreal forests, rainy summers can lead to high prevalence and intensity of the nematode Howardula aoronymphium in mycophagous Drosophila in the fall and the following spring (Jaenike, Reference Jaenike2002). In the U.S. Pacific northwest, experimental studies and field observations examining environmental triggers for outbreaks of sea star wasting disease (SSWD) found that SSWD pathology is temperature dependent and mass mortalities of sea stars tend to occur shortly after temperature increases (Dungan et al. Reference Dungan, Miller and Thomson1982; Bates et al. Reference Bates, Hilton and Harley2009). Collectively, these studies demonstrate that environmental variables can have delayed impacts on marine parasitism and disease prevalence. Understanding these time-lagged relationships is crucial for predicting and managing disease outbreaks in marine ecosystems.
Unlike P. marinus, the prevalence of H. nelsoni was high across all sites and less variable throughout the year. Previous studies suggest that H. nelsoni is more likely to infect juvenile oysters (Ford et al. Reference Ford, Stokes, Alcox, Kraus, Barber, Carnegie and Burreson2018). However, we observed high prevalence across all size classes, indicating that the parasite can persist in oysters as they grow into larger size classes (Ford and Haskin, Reference Ford and Haskin1982; Ford et al. Reference Ford, Stokes, Alcox, Kraus, Barber, Carnegie and Burreson2018). Temperature, salinity and DO were all strong predictor variables in the top model and positively correlated with H. nelsoni prevalence, but specifically, the best model suggested that as variance in environmental conditions (i.e., temperature) increased, parasite prevalence increased. Batchelor et al. (Reference Batchelor, Harrison, Greiman, Treible and Carroll2023) found that sites with the highest variance in salinity exhibited the highest prevalence and intensity of H. nelsoni, suggesting infections may be more common in locations with more variable water quality conditions that could be physiologically stressful for oysters and increase their susceptibility to parasitism (Lafferty and Kuris, Reference Lafferty and Kuris1999; Batchelor et al. Reference Batchelor, Harrison, Greiman, Treible and Carroll2023). A study by Paull et al. (Reference Paull, Raffel, LaFonte and Johnson2015) found that the amplitude and frequency of temperature variability impacted the immune system and energy reserves of the freshwater snail host Helisoma trivolvis, thereby increasing the proliferation and transmission of its trematode parasite Ribeiroia ondatrae. Additionally, short-term temperature fluctuations increased the prevalence and intensity of Ordospora colligata infections in Daphnia magna, due to increased host physiological stress and impaired immune defenses under variable environmental conditions (Krichel et al. Reference Krichel, Kirk, Pencer, Hönig, Wadhawan and Krkošek2023). The aforementioned studies underscore the importance of considering not just average environmental conditions, but also fluctuations and extremes, when predicting parasite dynamics in changing ecosystems. Alternatively, the lifecycle of H. nelsoni may involve an unidentified intermediate host (Ford et al. Reference Ford, Stokes, Alcox, Kraus, Barber, Carnegie and Burreson2018), so the most influential environmental factors associated with H. nelsoni infection in oysters may instead be those that are most suitable for the intermediate host. Future research should focus on understanding the complex life cycle of H. nelsoni as well as the progression of disease in both juvenile and adult oysters.
One important caveat to these results is that the models in the present study have limited predictive power. Each top fit model explained less than 30% variation in P. marinus and H. nelsoni prevalence and intensity, which suggests that environmental or other factors not included in the analyses of the present study may be more influential in driving the intensity of both parasites within oyster hosts. Water flow can be an important determinant in parasitic infections (Lafferty and Kuris, Reference Lafferty and Kuris1999) but was not measured in the current study. Likewise, geographic features at the seascape scale can also influence parasite dynamics in coastal systems. For example, sites with greater marsh area around a reef relative to open water reduced P. marinus prevalence and intensity but increased H. nelsoni prevalence (Ziegler et al. Reference Ziegler, Atencio, Carroll and Byers2024), while P. marinus may increase with distance from freshwater (Hanley et al. Reference Hanley, White, Stallings and Kimbro2019). Parasite prevalence and intensity can also respond to multi-year precipitation cycles and the El-Nino Southern Oscillation (Powell et al. Reference Powell, Gauthier, Wilson, Nelson, Fay and Brooks1992; Soniat et al. Reference Soniat, Klinck, Powell and Hofmann2012). In this study, the prevalence of P. marinus was ∼40% lower on average than a survey at the same sites in 2018, while the prevalence of H. nelsoni in this study was ∼18% higher than 2018 (Batchelor et al. Reference Batchelor, Harrison, Greiman, Treible and Carroll2023), suggesting that the factors affecting annual or multiannual variability could mask within-year or within-season trends. Finally, the health of the host is also critical for parasite infection and intensity, since physiological stress dampens host ability to fight infection and has been shown to correspond to higher level of parasitism (Oppliger et al. Reference Oppliger, Lecomte and Boudjemadi1998; Lafferty and Kuris, Reference Lafferty and Kuris1999; Malek and Byers, Reference Malek and Byers2017). All oysters in this study come from intertidal populations, which tend to have more intense infections than subtidal populations (Malek and Breitburg, Reference Malek and Breitburg2016; Malek and Byers, Reference Malek and Byers2017), likely due to the more extreme and stressful physiological conditions of repeated daily tidal exposure. Sampling intertidal oysters could be masking the effects of water quality parameters in driving P. marinus and H. nelsoni intensity (Oppliger et al. Reference Oppliger, Lecomte and Boudjemadi1998; Lafferty and Kuris, Reference Lafferty and Kuris1999; Malek and Byers, Reference Malek and Byers2017).
The parasites examined in this study – P. marinus and H. nelsoni – typically lead to oyster diseases, Dermo and MSX, respectively, that have negative ecosystem-level and economic consequences (Mackin et al. Reference Mackin, Owen and Collier1950; Ford and Haskin, Reference Ford and Haskin1982; Andrews, Reference Andrews1988; Burreson and Ragone Calvo, Reference Burreson and Ragone Calvo1996) by reducing oyster health, reproductive output and even leading to mortality events (Burreson and Ragone Calvo, Reference Burreson and Ragone Calvo1996). Exploring the individual- and ecosystem-level consequences of parasite infection was beyond the scope of this study, but the parasites do not appear to have negative consequences locally. Despite high parasite prevalence and intensity on Sapelo Island during the sampling period of this study, oyster populations appeared to be in good condition (high oyster density and reef complexity; personal observation). In this study, only a few oysters had no detectable parasite loads, and parasite intensity was highly variable among individual oysters collected from within a single site. Thus, it is possible that we sampled oysters with parasite loads that were not high enough to cause adverse health effects or mortality simply because those oysters were already deceased at the time of collection. Alternatively, we used qPCR amplification of parasite DNA to detect prevalence and intensity, which may be a more sensitive and accurate approach but cannot determine the parasite life or infective stage in the host (Gauthier et al. Reference Gauthier, Miller and Wilbur2006; Wilbur et al. Reference Wilbur, Ford, Gauthier and Gomez-Chiarri2012). Though qPCR is a highly sensitive detection method and can explain findings for P. marinus and H. nelsoni in this study, cases with low intensity may involve underdeveloped parasites that do not affect the oyster, and high prevalence may be common, but these infections may be asymptomatic (Batchelor et al. Reference Batchelor, Harrison, Greiman, Treible and Carroll2023).
However, our observation of limited negative impacts of disease-causing protozoan parasites on oyster populations in this study aligns with several recent studies in southeastern U.S. estuaries. Recent studies in coastal Georgia that found that the integrity of reef structure remained intact despite universally high parasite prevalence across a large spatial scale (150 km) and a lack of negative impacts for P. marinus and H. nelsoni on oyster condition index (Batchelor et al. Reference Batchelor, Harrison, Greiman, Treible and Carroll2023; Ziegler et al. Reference Ziegler, Atencio, Carroll and Byers2024). In Florida, oysters with P. marinus may exhibit increased tissue condition relative to oysters without the parasite, although that may have been confounded by tidal elevation (Hanley et al. Reference Hanley, White, Stallings and Kimbro2019). Likewise, high protozoan parasite loads are common in North and South Carolina within otherwise healthy oyster populations (Bobo et al. Reference Bobo, Richardson, Coen and Burrell1997; Wilbur et al. Reference Wilbur, Ford, Gauthier and Gomez-Chiarri2012). Intertidal oysters in the southeast USA appear to be resistant or more tolerant to these protozoan parasites (Powell et al. Reference Powell, Klinck, Guo, Ford and Bushek2011) and/or are more resilient to other stressors that usually co-occur with parasites that lead to disease effects and mortality (e.g., temperature; Chu and Volety, Reference Chu and Volety1997; Malek and Byers, Reference Malek and Byers2018). Alternatively, parasite strains present in this region of the southeast may be less virulent or lethal phenotypes (Bushek and Allen, Reference Bushek and Allen1996; Carnegie et al. Reference Carnegie, Ford, Crockett, Kingsley-Smith, Bienlien, Safi, Whitefleet-Smith and Burreson2021). It is also possible that high oyster recruitment and growth along the Georgia coast could mask the negative impacts of oysters lost to parasite-related mortality (O’Beirn et al. Reference O’Beirn, Heffernan, Walker and Jansen1996; Malek and Byers, Reference Malek and Byers2017), although other southeast US estuaries with much lower recruitment (Byers et al. Reference Byers, Grabowski, Piehler, Hughes, Weiskel, Malek and Kimbro2015) also exhibit high prevalence of parasites with minimal effects (Wilbur et al. Reference Wilbur, Ford, Gauthier and Gomez-Chiarri2012). Nevertheless, from April through October in Georgia, water quality conditions are conducive for both protozoan parasites with seemingly limited impacts on local oyster populations.
Seasonal cycles and tidal influences could also contribute to the apparent tolerance in southeastern oyster populations. Geographic variation of P. marinus and H. nelsoni infections can in part be attributed to the magnitude and duration of seasonal changes that occur with changes in latitude, tidal emersion and coastal morphologies (Bahr and Lanier, Reference Bahr and Lanier1981; Ewart and Ford, Reference Ewart and Ford1993; Burreson and Ragone Calvo, Reference Burreson and Ragone Calvo1996; Cook et al. Reference Cook, Folli, Klinck, Ford and a1998; Lenihan et al. Reference Lenihan, Micheli, Shelton and Peterson1999; Walles et al. Reference Walles, Fodrie, Nieuwhof, Jewell, Herman and Ysebaert2016). Historically, P. marinus and H. nelsoni have had much more of a significant and chronic effect on both wild and cultured oyster populations in the northeastern and mid-Atlantic regions of the USA (especially Chesapeake and Delaware bays; Ewart and Ford, Reference Ewart and Ford1993; Burreson and Ragone Calvo, Reference Burreson and Ragone Calvo1996; Cook et al. Reference Cook, Folli, Klinck, Ford and a1998), and are often linked to additional stressors, such as high temperatures (Chu and La Peyre, Reference Chu and La Peyre1993; Ford and Tripp, Reference Ford, Tripp, Kennedy, Newell and Eble1996). In southeastern US estuaries, which tend to be more saline and warmer even in the winter, oysters are exposed to potential parasite infections year-round (Andrews, Reference Andrews1988; O’Beirn et al. Reference O’Beirn, Dean and Walker1994; Oliver et al. Reference Oliver, Fisher, Ford, Calvo, Burreson, Sutton and Gandy1998), whereas oysters in mid-Atlantic and northeastern US estuaries experience temperature and salinity regimes in winter months that reduce parasite exposure (Andrews, Reference Andrews1988; Carnegie and Burreson Reference Carnegie, Burreson, Woo and Buchmann2012; Oliver et al. Reference Oliver, Fisher, Ford, Calvo, Burreson, Sutton and Gandy1998). Additionally, the distribution of oysters throughout much of the southeastern USA is almost exclusively intertidal (Bahr and Lanier, Reference Bahr and Lanier1981; Walles et al. Reference Walles, Fodrie, Nieuwhof, Jewell, Herman and Ysebaert2016; Malek and Byers, Reference Malek and Byers2017; Dieudonne and Carroll, Reference Dieudonne and Carroll2022). The prevalence and intensity of P. marinus and H. nelsoni in oysters is highest in the intertidal throughout this entire range (Karolus et al. Reference Karolus, Sunila, Spear and Volk2000; Johnson and Smee, Reference Johnson and Smee2014; Malek and Byers, Reference Malek and Byers2017), and the changing profile of the intercontinental shelf along the east coast strongly influences tides, waves and flow regimes; subsequently influencing the exposure of oysters to parasites in the water column (Redfield AC, 1958; Bahr and Lanier, Reference Bahr and Lanier1981; Lenihan et al. Reference Lenihan, Micheli, Shelton and Peterson1999). Therefore, the high tidal amplitude, strong tidal forces, exclusively intertidal oyster reefs and environmental conditions that permit P. marinus and H. nelsoni to survive year-round have most likely led to high, chronic exposure for oysters in this region which may subsequently have led to their potential tolerance to these parasites. Future work should explore additional biological and physical factors influencing the prevalence and intensity of P. marinus and H. nelsoni as well as the mechanisms for the apparent tolerance of southeastern oyster populations.
In conclusion, our results indicate that P. marinus and H. nelsoni are ubiquitous across a small spatial scale and over time, and patterns of parasite prevalence and intensity were driven by a combination of water quality conditions. There was a time-lag effect for environmental parameters driving P. marinus prevalence that coincided with when water quality conditions were likely most stressful for oysters and/or favorable for P. marinus proliferation and transmission (Cook et al. Reference Cook, Folli, Klinck, Ford and a1998; Breitburg et al. Reference Breitburg, Hondorp, Audemard, Carnegie, Burrell, Trice and Clark2015; Malek and Byers, Reference Malek and Byers2017). This same time-lag effect was not seen for H. nelsoni; instead, prevalence remained high throughout the year with little variability between sites. Intensity was highly variable among individual oysters from within sites, which could be the result of several other physical factors not investigated in this study or the complex pathophysiology between oyster host innate immune response and the ability of parasites to evade and suppress host defenses (Lenihan et al. Reference Lenihan, Micheli, Shelton and Peterson1999; Hughes et al. Reference Hughes, Foster, Grewal and Sokolova2010; Malek and Byers, Reference Malek and Byers2017; Ziegler et al. Reference Ziegler, Atencio, Carroll and Byers2024). Even though this study presented disease data biweekly over a 7-month period, there remains a multitude of potential factors that vary across spatial scales and years that may be driving the complex relationship between oysters and parasites, emphasizing the need to build long-term disease datasets (Carnegie et al. Reference Carnegie, Ford, Crockett, Kingsley-Smith, Bienlien, Safi, Whitefleet-Smith and Burreson2021; Batchelor et al. Reference Batchelor, Harrison, Greiman, Treible and Carroll2023). Changing climatic conditions may also permit parasites to remain sequestered within oysters during the winter period and increase in abundance once environmental conditions are favorable the following spring. Paull et al. (Reference Paull, Raffel, LaFonte and Johnson2015) conducted a mesocosm study with the snail host Helisoma trivolvis and the virulent parasite Ribeiroia ondatrae from September to July and found that warming of 3°C caused snails to release parasites 9 months earlier and increased infected snail mortality by 4-fold. Considering continued climatic changes, expanding parasite ranges, and protracting seasonality of parasites, it becomes paramount for research to continue investigating the influence of temperature, salinity, DO and pH on oyster parasite dynamics across various spatiotemporal scales (Harvell et al. Reference Harvell, Kim, Burkholder, Colwell, Epstein, Grimes, Hofmann, Lipp, Osterhaus and Overstreet1999; Lafferty, Reference Lafferty2009; Byers, Reference Byers2021). Understanding this complex environment–host–parasite interaction will not only have implications for management, restoration and aquaculture in regions with high parasite-related mortalities, but also for how parasite prevalence and intensity continue to shape estuarine communities and the services provided by an irreplaceable ecosystem engineer.
Supplementary material
The supplementary material for this article can be found at https://doi.org/10.1017/S0031182025101431.
Data availability
Data for this work are available upon request.
Acknowledgements
We thank Jessie Rivera, Zach Czoer, Annalee Love, Reyes Umanzor and Skyler Fox for extensive help in the field collection of samples. We would like to thank Scott Harrison for access to equipment and assistance in DNA extractions. We would also like to thank Rachel Guy from the Sapelo Island National Estuarine Research Reserve for logistical support including site access for this project.
Author contributions
W.E.A., S.L.Z., S.E.G. and J.M.C. conceived the original idea and designed the methodology; W.E.A. and J.M.C. conducted fieldwork, W.E.A. and S.E.G. conducted molecular analysis, W.E.A. and S.L.Z. conducted statistical analysis, W.E.A. and J.M.C. wrote the manuscript, and S.L.Z. and S.E.G. reviewed the manuscript and provided editorial advice.
Financial support
Funding was provided by the National Oceanic and Atmospheric Administration through a Margaret A. Davidson Fellowship award to WEA.
Competing interests
The authors declare there are no conflicts of interest.
Ethical standards
‘Not applicable’


 Open access