

As numerous reports have highlighted, multiple problems of electoral fraud, ballot stuffing, and violence commonly occur with elections around the world so that the quality of contemporary contests fails to meet international standards (Hyde Reference Hyde2011; Kelley Reference Kelley2012). All states are vulnerable, but the gravest legitimacy challenges arise in hybrid regimes and “electoral autocracies,” with the façade of party competition disguising major violations of human rights (Levitsky and Way Reference Levitsky and Way2010; Schedler Reference Schedler2013; Simpser Reference Simpser2013). Nations such as Kenya, Thailand, and Cambodia have been destabilized by contentious contests generating partisan gridlock and street violence. Challenges are exemplified by a series of well-documented problems occurring during the series of Afghan elections held since 2004. The final round of the June 2014 Afghan presidential contest ended with Abdullah Abdullah, one of the two rival candidates seeking to replace Hamid Karzai, alleging the occurrence of fraud “on an industrial scale,” triggering demands to suspend the count, mass protests by his supporters, the resignation of the chief election commissioner, and delays to announcing the results.
While the most severe risks occur in fragile states and in transitional contests held during peace-building operations, democracies are not immune from electoral flaws. Since the 2000 US presidential contest, voting procedures in America have become increasingly controversial, with heated partisan debates about allegations of voter fraud and restrictions on voting rights (Hasen Reference Hasen2012; Minnite Reference Minnite2010; Wang Reference Wang2012). New state laws regulating voter registration and identification requirements have created growing controversy in state houses and the courts (Hall Reference Hall2013). In January 2014, a blue-ribbon bipartisan US Presidential Commission on Electoral Administration (2014) issued its report and recommendations to rectify problems about poor electoral management and inadequate polling facilities. The United States is not alone in experiencing growing concern about the quality of its elections; the contagious Floridian virus has also infected British and Canadian politics. In all countries, evidence from the World Values Survey suggests that public perceptions of electoral malpractices erode trust and confidence in elected authorities, discourage voter turnout and generate protests, and even undermine regime stability (Norris Reference Norris2014). Elections are at the core of liberal democracy, but flawed or failed contests corrode political legitimacy.
How do we know with any certainty when elections fall short of international standards and global norms? Electoral observer missions by international, regional, and domestic nongovernmental organizations (NGOs) provide in-depth assessments of many contests–but coverage is far from universal, and it remains difficult to compare reports consistently across countries worldwide. The picture has been further muddied by the proliferation of election monitoring groups, which can produce divergent assessments (Daxecker and Schneider Reference Daxecker, Schneider, Norris, Frank and Martínez i Coma2014). For example, after observing the Azerbaijan presidential elections October 9, 2013, the Organization for Security and Cooperation in Europe (OSCE/ODIHR 2013) mission reported numerous flaws, including ballot box stuffing, lack of transparency in the vote count, and candidate and voter intimidation. By contrast, observers from the Parliamentary Assembly of the Council of Europe (PACE 2013) concluded that there was “a free, fair and transparent electoral process.”
Public perceptions may be misleading, however, especially where governments muzzle criticism or where arcane technical processes like gerrymandering determine the outcome.
Multiple evaluation indices have been developed in public sector management, comparing the quality of elections across provinces or electoral districts within countries (Alvarez, Atkeson, and Hall 2012; James Reference James2012). Forensic autopsies are used to dissect anomalies in polling district results, but no consensus yet exists about the most reliable statistical techniques (Mebane Reference Mebane2012). Field experiments examine the effects of selected interventions on randomized treatment groups, including the impact of election monitoring observers on ballot box fraud (Hyde Reference Hyde2011). But this approach is far too narrow to assess the overall quality throughout an electoral cycle, and many aspects of elections cannot be subject to randomized treatments. Opinion polls, notably the World Values Survey, are starting to assess public confidence in electoral procedures and authorities (Norris Reference Norris2014). Public perceptions may be misleading, however, especially where governments muzzle criticism or where arcane technical processes like gerrymandering determine the outcome. Legal prosecutions and court cases highlight the illegal acts that come to light—but not authorized acts, like restrictions on group voting rights, which still violate international standards. The contents of news reports of election events can be analyzed to identify stories about fraud, violence, or malpractice, but critical coverage may be colored by the media’s partisan leanings, skewed by overreliance on international media sources, and censored in the domestic press by the most repressive regimes.
Given claims and counterclaims and the complexity of the phenomenon, it is challenging to establish watertight evidence and reliable indicators applicable to many diverse contexts, types of regimes, and cultures.
To supplement existing sources of evidence, the new Perceptions of Electoral Integrity (PEI) expert rolling survey provides a comprehensive, systematic, and consistent way to monitor and compare the quality of elections worldwide. The latest release of the dataset and codebook (PEI-2.5) is available for download. Footnote 1 The study draws on evaluations of electoral integrity provided by a range of independent election experts. This article outlines the PEI’s research design, compares the results worldwide, and then summarizes some of the key findings about the relationship linking electoral integrity with both democracy and development.
THE RESEARCH DESIGN
The Concept of Electoral Integrity
The concept of electoral integrity in the Electoral Integrity Project refers to international standards and global norms governing the appropriate conduct of elections. These standards have been endorsed in a series of authoritative conventions, treaties, protocols, and guidelines by agencies of the international community, notably by the decisions of the United Nations (UN) General Assembly, by regional bodies such as the OSCE, the Organization of American States, and the African Union, and by member states in the UN (Carroll and Davis-Roberts Reference Carroll and Davis-Roberts2013). Following endorsement, these standards apply universally to all countries. The notion of an electoral cycle can be conceptualized as the series of sequential steps, as illustrated in figure 1. The international community has adopted the electoral cycle approach as the gold standard, recognizing that parachuting observers to scrutinize only the end processes of balloting, vote count, and results is too limited unless a longer-term assessment of each contest also takes place. Attention often focuses on the finish line, but like a marathon, elections may be won or lost at the starting gate.
The PEI Electoral Cycle
Source: Electoral Integrity Project. 2014. The expert survey of Perceptions of Electoral Integrity, Release 2.5 (PEI-2.5).

Measuring Electoral Integrity
To operationalize this conceptual framework, the survey asks experts to evaluate elections using 49 indicators, grouped into 11 categories reflecting the whole electoral cycle. Using a comprehensive instrument, experts assess whether each national parliamentary and presidential contest meets international standards during the preelection period, the campaign, polling day, and its aftermath. The overall PEI index is constructed by summing the 49 separate indicators for each election and for each country. The PEI index is standardized to 100 points. Election scores are ranked and subdivided by thirds into contests with high, moderate, and low levels of electoral integrity. Similar 100-point standardized indices are constructed for each of the 11 components of the electoral cycle.
Election and Country Coverage
PEI seeks to collect expert evaluations for all national parliamentary and presidential direct elections that occur in independent nation-states around the globe (excluding microstates with a population of less than 100,000 and dependent territories). Footnote 2 The rolling survey adds each election after it occurs, with periodic releases of the datasets every six months. The current release, PEI-2.5, covers 95 national elections that occurred during a two-year period in 86 countries worldwide. In cases of simultaneous legislative and executive elections, the survey monitors the latter. In countries using second ballot (run-off) majoritarian electoral systems, the survey assesses the final contest. No criteria are imposed for the competitiveness or democratic quality of elections, so the survey includes one-party states such as Cuba and North Korea, as these are intrinsically interesting contests. Because of the universal coverage, states included in PEI-2.5 can be regarded as a representative cross-section of all countries in the world that hold national elections (excluding microstates), allowing broader generalizations to be drawn among all types of regimes, cultural regions, and levels of development.
Expert Surveys
Expert surveys have become an increasingly common way to monitor complex phenomenon where it is difficult for the natural and social sciences to gather alternative evidence (Schedler Reference Schedler2012; Martínez i Coma and Frank Reference Martínez i Coma, Frank, Norris, Frank and Martínez i Coma2014). Familiar examples include Freedom House’s Freedom in the World, Transparency International’s Corruption Perception Index, the Economist Intelligence Unit’s Democracy Index, Global Integrity’s indicators, and the Varieties of Democracy (V-Dem) project (Coppedge et al. Reference Coppedge, Gerring, Altman, Bernhard, Fish, Hicken, Kroenig, Lindberg, McMann, Paxton, Semetko, Skaaning, Staton and Teorell2011).
PEI consults around 40 domestic and international experts about each election, with requests to participate sent within a month after the announcement of the results. Contemporary evaluations are collected by PEI immediately after the declaration of election results to minimize the potential risks of faulty recall by respondents and the influence of subsequent events that could color retrospective judgments.
In terms of the selection of experts, PEI respondents are political scientists or scholars in related disciplines who are carefully vetted through their publications and teaching to be knowledgeable about a country’s elections. Both domestic and international experts are consulted. The PEI has compiled a comprehensive database with the names and contact details of more than 9,000 election experts around the world. The PEI-2.5 survey was sent to a total of 3,733 respondents and it draws on the views of 1,059 election experts, producing an overall mean response rate of 28%. The number of experts who responded for each election ranged from two to 36, with the highest response rate in postindustrial societies where political science is a well-established discipline. The data has been tested and found to demonstrate high levels of internal reliability (consistency among experts), external reliability (when compared with equivalent independent indicators), and legitimacy (when expert judgments are compared with public assessments) (Norris, Martínez, and Frank Reference Norris, Martínez i Coma and Frank2013).
Like V-Dem, the core concept is understood as multidimensional. PEI uses an online instrument collecting information about 49 key indicators concerning the performance of elections, with all items using a standardized and consistent five-point agree-disagree response scale. Analysis can be conducted using the summary PEI index, the 11 components, or the 49 individual indicators. Those scholars preferring alternative conceptualizations of the quality of elections, or those seeking to compare specific dimensions such as campaign finance or the role of election management bodies, are free to reaggregate the indicators and thereby create alternative measures. In the past, “thin” minimalist assessments, like the “pass-fail” grade using limited criteria of “free and fair” contestation, have commonly been used for large-N cross-national longitudinal analysis over an extended time (for example, by Boix, Miller, and Rossano Reference Boix, Miller and Rossano2012). By contrast, richer “thick” maximalist qualitative reports about each contest are available from the news media and monitoring agencies, but these are not strictly comparable across countries. The PEI design seeks to strike a balance between these approaches, allowing standardized disaggregated indices.
Time Period
The current release of the dataset (PEI-2.5) includes 95 national elections from July 1, 2012 to June 30, 2014. Successive releases of the dataset at six-month intervals will cover national elections held each year, gradually broadening the comparison worldwide and extending the time series.
One major limit of the rolling design is that the data cannot be used for historical analysis to compare the quality of successive elections during prior decades. Fortunately other longitudinal datasets are already available for this purpose, measuring closely related concepts and producing summary indices, including the “quality of elections’”(Kelley Reference Kelley2010), “electoral malpractice” (Birch Reference Birch2012), “competitive elections” (Hyde and Marinov Reference Hyde and Marinov2012), or “free and fair elections” (Bishop and Hoeffler Reference Bishop and Hoeffler2014). Despite contrasts in concepts, measures, and sources, when summarized, these independent sources are strongly intercorrelated with each other and with the PEI index (Norris, Martínez i Coma, and Frank Reference Norris2013; Norris Reference Norris, Martínez i Coma and Frank2013).
Confidence Intervals
When interpreting the results below, note that modest differences in the PEI index are unlikely to be statistically significant at reasonable confidence intervals. It is more useful to focus on the range of indicators across the cycle and more substantial differences among elections or among countries. Confidence intervals were constructed for the summary PEI index based on the number of experts who responded for each election and country.
Data Availability
The project emphasizes the principles of transparency, replicability, and collaboration, hence full methodological details are available from www.electoralintegrityproject.com. All data and codebook are available for download at: http://thedata.harvard.edu/dvn/dv/PEI. Data can be examined at the level of each country, each election, or individual experts. Each serves slightly different purposes. Thus, scholars of comparative elections seeking to determine cross-national patterns can use the country-level PEI dataset merged by standard Correlates of War country identifier with national-level indicators, for example those compiled by the Quality of Government Standard dataset (Teorell et al. Reference Teorell, Charron, Dahlberg, Holmberg, Rothstein, Sundin and Svensson2013). Those scholars interested in more specific electoral issues, such as whether problems of electoral fraud are related to marginality, turnout, electoral rules, or party competition, can use the election-level dataset, which includes the share of votes and seats for parties. Finally, scholars seeking to probe the factors shaping expert judgments, such as the impact of sex, location, or ideology, can analyze the individual-level PEI dataset.
… scholars seeking to probe the factors shaping expert judgments, such as the impact of sex, location, or ideology, can analyze the individual-level PEI dataset.
Dataverse facilitates download of the datasets in different formats and online analysis without any specialized software. To make the information widely available and to provide the qualitative context, the annual Year in Elections report, available from the project website, also provides a page-per-election brief description of each contest, a summary of the results (the distribution of votes and seats), and the PEI evaluations for each election compared with the world average broken down across the 11 dimensions in the electoral cycle. Footnote 3
The focus on contemporary elections, combined with the timely periodic release of the data, makes PEI a valuable resource for practitioners, such as electoral authorities, political parties, development agencies, and human rights watch organizations, when seeking independent evidence and consistent cross-national benchmarks to evaluate the performance of elections in each country. For example, the PEI results have been fairly widely debated in the national media in several countries, especially where elections score relatively poorly and where contests generate heated disputes about election procedures or outcomes, such as in Cambodia, Thailand, and Malaysia. Electoral authorities, such as those in the Republic of Korea, have also downloaded and analyzed the PEI data to help assess their own performance.
PREDICTING ELECTORAL INTEGRITY
This descriptive introduction to the dataset is not the place to provide a detailed and comprehensive analysis of the consequences of problems of electoral integrity, or the complex range of conditions leadings toward electoral integrity, discussed elsewhere (Norris 2014, forthcomingReference NorrisNorris 2014, forthcomingN , ). Nevertheless, several factors commonly used to explain broader processes of democratization can also be expected to be closely related to the quality of elections, so these patterns can be explored.
Development, Democracy, and Integrity
It has been widely observed that democratic institutions and cultures usually flourish in affluent postindustrial societies, which are characterized by well-educated and highly literate populations, rich networks of civic associations linking citizens and the state, widespread access to the mass media, and effective public sector bureaucracies. The link between democracy and development is also known as the “Lipset” (Lipset 1959) hypothesis. The nature of the relationship has been subject to debate over the years, including whether economic development can be understood to facilitate transitions from autocracy and processes of democratization, or whether it serves to consolidate democracies, after the initial transition occurs for other reasons (Przeworski et al. 2000). Without time-series data for our measure of perceptions of electoral integrity, we are unable to pursue the causality of any linkages at this stage of the research. In addition, other reasons indicate a strong correlation between development and electoral integrity because affluent societies have the resources to invest in human and technological capacity that facilitates managing complex processes effectively and efficiently, including running elections. As our first basic proposition, therefore, contemporary levels of electoral integrity are expected to be strongly correlated with indicators of each society’s levels of economic development (conventionally measured from World Development Indicators by per capita gross domestic product (GDP) in purchasing power parity in constant US$).
In addition, elections meeting international standards are central to liberal democracy, although they are only one institution. As Linz and Stepan (Reference Linz and Stepan1996) note, the “electoralist fallacy” assumes that elections alone are necessary and also sufficient for democracy to flourish. Yet as Linz and Stepan argue, many other essential political rights and civil liberties need to be established for democratic consolidation to occur, notably the development of flanking institutions, including effective legislatures and independent courts with the capacity to check the power of the executive and maintain rule of law, an independent and pluralistic mass media, and a flourishing civic society. Thus, the second proposition suggests that patterns of electoral integrity will be observed to be strongly correlated with contemporary levels of liberal democracy, monitored by the combined Freedom House/Polity IV index (Teorell et al. Reference Teorell, Charron, Dahlberg, Holmberg, Rothstein, Sundin and Svensson2013). The correlation is not expected to be one-to-one because clearly relatively high-quality elections can occur in countries, for example, as the result of interventions and technical assistance provided by the international community in peace-building efforts, yet where many other political institutions and democratic cultures remain poorly developed. Nevertheless, in general, electoral integrity and processes of democratization are predicted to be closely related.
Finally, a country’s historical stock of democratic capital (built from the length of time it has been democratic) is also usually expected to be a strong predictor of contemporary levels of electoral integrity. Actors can learn from elections as a repeated game. Experience of parties rotating in power over a long series of contests can consolidate acceptance of the legitimacy of the rules of the game and trust in the political system, especially for election losers, generating more stable outcomes (Anderson et al. Reference Anderson, Blais, Bowler, Donovan and Listhaug2005). Moreover, experience of organizing successive contests potentially can deepen the know-how, capacity, and professional skills of electoral management bodies. For this study, democratic capital is measured using a summary measure of each society’s cumulative experience of democratization, measured by adding the sum of combined Freedom House/Polity 2 index annual scores from 1972 to 2010 (calculated from Teorell et al. Reference Teorell, Charron, Dahlberg, Holmberg, Rothstein, Sundin and Svensson2013).
Therefore, for all these reasons, electoral integrity, as monitored by the PEI index, is expected to be associated with contemporary levels of development and democracy and the path-dependent historical experience of democratic capital.
ANALYSIS OF RESULTS
What emerges from comparing the results of the Perceptions of Electoral Integrity index at election and country levels? Figures 2 and 3 describe the overall PEI index for countries under comparison in Release 2.5. Not surprisingly, experts rated the quality of elections highly in many Northern European democracies, including Norway (ranked first), Germany, the Netherlands, Iceland, and Austria. These countries are all affluent postindustrial societies, with a long succession of democratic contests experienced over many decades or even centuries, as well as having effective institutions of public sector governance. States at the top of the ranking also commonly have power-sharing institutions, multiparty legislatures, and coalition governments that provide multiple checks and balances on the executive branch. These countries have a fairly level playing field for party competition, based on either Proportional Representation or Mixed Member Proportional electoral systems.
When experts evaluated the integrity of the 2012 presidential contests, the United States ranked 25th worldwide in the overall comparison of 86 nations. This rating was similar to countries such as South Africa, Mexico, and Bhutan.
PEI Index and Rank by Country
Source: Electoral Integrity Project. 2014. The expert survey of perceptions of electoral integrity, release 2.5 (PEI-2.5)
Note: Colors used in this figure are “traffic light” codes: red=lowest scores; orange=middle-range scores; green=highest scores. (Color online).

The Perceptions of Electoral Integrity Index (PEI) by Country
Source: Electoral Integrity Project. 2014. The expert survey of Perceptions of Electoral Integrity, Release 2.5 (PEI-2.5).

At the same time, by contrast, elections in certain mature democracies received less-positive ratings from experts. This includes contests in the United States, Italy, and Japan. When experts evaluated the integrity of the 2012 presidential contests, the United States ranked 25th worldwide in the overall comparison of 86 nations. This rating was similar to countries such as South Africa, Mexico, and Bhutan. The overall PEI index for the United States was lowered by experts because of concern about the quality of electoral laws, voter registration processes, and procedures for drawing district boundaries as well as the regulation of campaign finance. The PEI evaluations suggest that the role of money in American politics and the redistricting process both deserve more detailed scrutiny. During the 1990s, Italy and Japan both reformed their electoral systems following experiences of major political corruption scandals and the fragmentation of predominant one-party systems (Gallagher and Mitchell Reference Gallagher and Mitchell2008). Nevertheless, problems persist in contemporary contests, generating continued debate about the need for further legal amendments, malapportionment among urban and rural prefectures in Japan, and proposals to set higher electoral thresholds in Italy to reduce party fragmentation and legislative gridlock (Garzia Reference Garzia2013).
The “moderate” category in the PEI global rankings included many diverse societies and types of regimes, including states such as Ghana, Montenegro, Nepal, Pakistan, and the Philippines. The more detailed diagnosis available in the dataset identifies diverse weaknesses and strengths, according to expert evaluations, during the 11-step electoral cycle within each country.
By contrast, low integrity elections ranked at the bottom third of the PEI index are drawn from diverse global regions and types of regimes. This includes several fragile states in Sub-Saharan Africa with deep-rooted conflict, notably Zimbabwe, Angola, the Republic of Congo, Equatorial Guinea, Burkina Faso, Djibouti, and Mauritania. Other regimes scoring poorly by the PEI index include several one-party autocracies in post-Soviet Eurasia, including Tajikistan, Turkmenistan, Azerbaijan, and Belarus. In general, developing societies, lacking the resources for public sector management, usually face significant challenges in organizing elections. Again, however, this pattern is far from fixed because low- and middle-income Rwanda, Mongolia, and Lithuania, for example, all scored relatively high. South East Asia contains countries with some of the lowest rankings worldwide include Malaysia (because of problems with its district boundaries and electoral laws) and Cambodia (concerns about voter registration, the compilation of results, and the independence of electoral authorities).
What explains these election and country ratings? To begin to explore the evidence for the three core propositions more systematically, figure 4 presents the scatterplot between the PEI index and the combined Freedom House/Polity IV indicators. The observed pattern in the illustration confirms the strong and significant correlation between PEI and contemporary levels of democratization (R=.709 P>.000 N.86). Moreover, figure 5 shows that a significant correlation (R=.665 P>.000 N. 64) also exists between the quality of contemporary elections (according to the PEI index) and the historic democratic capital in each country (the length of time that a country experienced democracy from 1972 to 2010). Because elections are at the heart of the concept and measurement of liberal democracy, necessary but not sufficient, these findings are hardly surprising.
PEI and Contemporary Levels of Democratization
Sources: Electoral Integrity Project. 2014. The expert survey of Perceptions of Electoral Integrity, Release 2.5 (PEI-2.5); Quality of Government Standard Cross-national dataset Teorell et al. 2013.

PEI and Historic Democratic Capital
Sources: Electoral Integrity Project. 2014. The expert survey of Perceptions of Electoral Integrity, Release 2.5 (PEI-2.5); Quality of Government Standard Cross-national dataset Teorell et al. 2013.

In addition, also as expected, levels of economic development also usually help to predict which countries perform well and poorly in electoral integrity. The overall correlation between PEI and per capita income was also strong and significant (R=.583 P> 0.000 N.83). The best model fit illustrated in figure 6 is a quadratic line, suggesting that rather than linear progress, there is a threshold effect; below per capita GDP of around $15,000, many elections perform poorly. Above this level, however, performances are usually stronger. Thus, reflecting the conclusions of Przeworski et al. (2000) concerning processes of democratization, growing affluence may not necessarily improve the quality of elections but, nevertheless, a certain threshold of economic development usually is necessary to sustain electoral integrity. In addition to any general effects of development in consolidating democratic institutions and cultures, elections require the mobilization of large-scale logistical resources—financial, human, and technological—and without sufficient investment, contests can easily go awry because of minor irregularities.
PEI and Development
Sources: Electoral Integrity Project. 2014. The expert survey of Perceptions of Electoral Integrity, Release 2.5 (PEI-2.5); World Development Indicators.
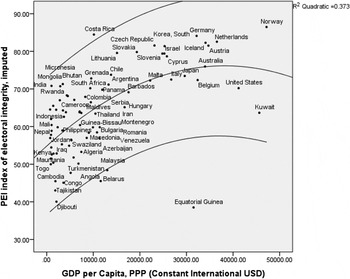
Despite these correlations, one of the most striking findings shown in the visual scatterplots is that electoral integrity is not simply determined by either historical experience of democratization or contemporary levels of development. Instead, several states with far shorter democratic histories (and middle-income economies) also scored highly in the quality of their contests today, according to the expert PEI judgments. This includes expert assessments of contests in the Czech Republic (with a series of well-ranked elections), Slovenia, Lithuania, Rwanda, and Chile, although these countries only established multiparty systems and competitive democratic elections during the late 1980s and early 1990s. Costa Rica also exemplifies a middle-income economy that scores exceptionally well in electoral integrity, ranking second out of 86 countries, just below Norway. By contrast, oil-rich Equatorial Guinea and Kuwait perform poorly in the quality of their elections. The cases of Cuba and North Korea are also worth exploring in further research because experts ranked these contests fairly well despite the lack of party competition in these states. Thus, the reasons behind the rankings deserve far greater scrutiny to understand the full picture.
DIAGNOSING MAJOR PROBLEMS DURING THE ELECTORAL CYCLE
The overall assessments are useful for broad global and regional comparisons, but average scores on the PEI index can disguise specific problems occurring within each election. For a deeper dive into the data, the project also monitors flaws in the electoral process occurring throughout the electoral cycle. PEI constructed multi-item indicators to monitor each dimension. Much attention focuses on ballot stuffing, ballot box fraud, and irregularities in the vote count. But, in fact, problems may arise at any step in the process, such as from the fairness of electoral laws, malapportionment of district boundaries, disparities in access to campaign funds and media coverage, the exclusion of candidates or parties from the ballot, and so on. Which stage is most problematic?
Finally, popular commentary and scholarly research often focus on issues arising on polling day, including voting fraud, ballot stuffing, and inaccurate counts. Yet the problems raising the greatest concern among experts were lack of a level playing field in political finance and campaign media.
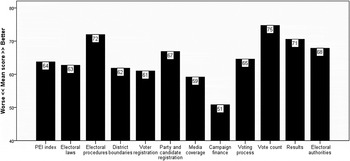
Although much scholarship and popular commentary focuses on potential problems occurring on polling day in the voting process and ballot count, such as fraudulent voting or vote counts, the evidence presented in figure 7 shows that campaign finance is by far the most problematic stage in the electoral cycle. Money in politics was a common concern in many developing countries as well as in many affluent societies, including the United States. The regulation of money in politics deserves greater attention by domestic actors and the international community to reduce corruption, the abuse of state resources, and vote-buying to strengthen public confidence in elections, and to ensure a level playing field for all parties and candidates (Öhman and Zainulbhai Reference Öhman and Zainulbhai2011). Contrary to much attention from journalists and scholars, however, the end stages of the electoral cycle, involving the process of vote tabulation, electoral procedures, and the announcement of the final results, were assessed by experts as the least problematic stage.
Performance of Each Stage during the Electoral Cycle Note: Mean scores on all 100-point PEI indices where a high score represents greater integrity.
Source: Electoral Integrity Project. 2014. The expert survey of Perceptions of Electoral Integrity, Release 2.5 (PEI-2.5).
DISCUSSION AND CONCLUSIONS
The study provides a snapshot of the quality of elections in countries that held national direct parliamentary and presidential elections during the 24-month period under comparison. The evidence allows elections around the world to be compared with each other and any weaknesses diagnosed across all 11 components of the electoral cycle. The inclusion of almost all nationwide contests during this period (with the exclusion of microstates with populations less than 100,000) means that the evidence provides a representative cross-section of all nationwide elections held worldwide. Further publications analyze the evidence in more depth, including explaining the consequences of electoral integrity for political legitimacy, public participation and regime transitions (Norris Reference Norris2014), and the reasons why elections fail (Norris forthcoming), as well as the policy option for strengthening contests.
In conclusion, the following summary highlights several major new findings.
-
Overall, not surprisingly, the results confirm that electoral integrity is usually strengthened by democracy and development. Long experience over successive contests, in countries such as Norway, Germany, and the Netherlands, consolidates democratic practices, reinforces civic cultures, and builds the capacity of electoral management bodies.
-
Despite this overall probabilistic pattern, several third wave democracies and emerging economies performed relatively well in electoral integrity, including countries such as the Czech Republic, Slovenia, Lithuania, Rwanda, Chile, Argentina, and Mongolia.
-
Experts were also critical about electoral flaws in certain long-established democracies, such as Italy, Japan, and the United States, with the latter ranked 25th out of 86 countries worldwide, the lowest score among Western nations. Experts highlighted concern about processes of redistricting, voter registration, and campaign finance in American elections.
-
Finally, popular commentary and scholarly research often focus on issues arising on polling day, including voting fraud, ballot stuffing, and inaccurate counts. Yet the problems raising the greatest concern among experts were lack of a level playing field in political finance and campaign media.
The PEI dataset provides evidence for a wide range of scholars and policymakers, including academic researchers and students, public officials in electoral management bodies, election watch and human rights organizations, broadcasters and reporters covering elections, and agencies within the international community seeking to strengthen electoral integrity.
The rolling design means that the current release is limited in both its international coverage and the capacity to draw comparisons over successive contests occurring within the same country. The dataset will gradually become more comprehensive, both geographically and over time, as the evaluations accumulate during subsequent years. This dataset is a new addition to the conceptual framework and battery of evidence available to assess problems of electoral integrity. It is hoped that this initiative proves valuable for academic and applied research.
ACKNOWLEDGMENTS
The Electoral Integrity Project (www.electoralintegrityproject.com) based in the Department of Government and International Relations at the University of Sydney and the John F. Kennedy School of Government at Harvard University would not have been possible without the support of the Australian Research Council Laureate Award. The authors would also like to thank all the research assistants who contributed toward the study, especially Max Groemping and Minh Trinh, visiting fellows who provided stimulating ideas as the project was first established, including Lawrence LeDuc and Carolien van Ham, Andrew Reynolds, and Jorgen Elkit who suggested many of the initial ideas, APSA and IPSA for assistance in locating participant contact details, and all the experts who participated in the survey.


