

The simplification of complex topics often is used as a tool in instruction. The game of chess, for example, is a simplification designed to simulate a battlefield. However, the game of chess also incorporates a high degree of abstraction, which dilutes the ability of the game to convey real-world experience to its players. We designed a realistic simulation of redistricting—a topic marked by complexity—for our classes at a large university. We report on the outcome of this “decision-game” simulation and comment on the feasibility of these games for further development as a teaching tool.
Playing a redistricting decision game in our classes constituted something of an experiment. Would the students be able to design credible districts using real data? Would they learn valuable insights in the process? Would they enjoy it? Is the experiment replicable; that is, can the game be played outside of the special conditions of our two classes? Would the students be able to use GIS software to project the maps they had designed? As reported in this article, these questions have broadly positive answers, suggesting additional exploration.
Louisiana has several appealing characteristics for the purposes of our simulation. The state has six congressional districts, which we believed balanced the complexity of drawing a statewide map without overwhelming students who are approaching the subject of redistricting for the first time. All of the places and parishes in the state had less population than the ideal for a congressional district. Thus, no political subdivision in the state was required to be split into multiple congressional districts to satisfy the mandatory population-equality criteria. According to 2010 US Census data, about 31.8% of the state population is black (the total nonwhite population is about 39.7%). This provided a context for students to balance descriptive and substantive representation in the context of congressional redistricting (Canon Reference Canon1999; Lublin Reference Lublin1997). Ideally, it should be possible to draw two districts with a nonwhite majority. Creating two minority-majority districts, however, proved elusive for most of the groups. The context of political competition in Louisiana, furthermore, provided the students with a case to study the relationship between redistricting and competition. According to the secretary of state’s 2010 data, Democrats outnumbered Republicans in registration by almost 2:1; however, the congressional delegation at the time was 6–1 in favor of the Republicans.
Our educational and theoretical motivations for undertaking the trial of this game surpassed the immediate goals of educating students about redistricting. We conceived of this simulation as an instance of a broader category of games, called decision games. The term indicates (1) a game in the game-theory sense—a situation involving interdependent decision making—that also is (2) an accurate model of real-world situations of import and that (3) affords a valid understanding of the real-world situation by playing the game (Kimbrough Reference Kimbrough2012). In other words, playing a decision game improves play in the real-world situations that it models.Footnote 1
Military war games constitute the clearest and most unambiguous cases of decision games. Beginning with Kriegspiel (i.e., “war game” in German) in the early nineteenth century, military organizations have used games for training and strategy development, with increasing investments over time. They range in form from board games to exercises in which large numbers of troops undertake maneuvers and imitate combat, governed by referees. They are used for training, planning, and even operational decisions. On the civilian side, interest in these games has flourished; a small commercial industry provides an extensive supply of board games, covering almost any significant historical battle (see Phillies Reference Phillies2014; Sabin Reference Sabin2012; and van Creveld 2013 for recent reviews of this literature).
We set two goals in the design of this simulation. We aimed for the students to appreciate (1) the complexity of real-world tasks such as redistricting—including balancing competing values in their map designs (Cain Reference Cain1984); and (2) how strategic decisions related to drawing districts can influence other aspects of the map-drawing process, including protection of incumbents, political parties, and racial groups. We incorporated a stylized redistricting simulation (Doherty and Ryan Reference Doherty and Ryan2014) into our courses before this game and fit that exposition into a larger discussion of the redistricting concept.
We set two goals in the design of this simulation. We aimed for the students to appreciate (1) the complexity of real-world tasks such as redistricting—including balancing competing values in their map designs (Cain Reference Cain1984); and (2) how strategic decisions related to drawing districts can influence other aspects of the map-drawing process, including protection of incumbents, political parties, and racial groups.
The student groups had two, three, or four members; each group then was assigned a “client” for whom it was drawing a district map. The notional clients were the Republican Party, the Democratic Party, and a nonpartisan group (e.g., League of Women Voters).Footnote 2 Each group was tasked to create a map of six congressional districts in Louisiana and to give a presentation advocating for their map, in nonpartisan terms, to the instructors as neutral arbiters in the game. We established the following mandatory criteria for the district plans: districts must be contiguous, within 1% of the ideal population, and in compliance with the Voting Rights Act of 1965.Footnote 3 Additionally, we discussed a set of discretionary criteria that groups could but were not obligated to incorporate into their district plans: compactness, respect for political subunits (i.e., parishes and places), and drawing competitive districts. We stipulated that census tracts must not be divided.Footnote 4
We modeled the in-class presentations of the student-drawn maps on the New Jersey commission, in which partisan politicians draw proposed maps iteratively with the objective to appeal to an impartial median voter. This model for redistricting has been praised by practitioners and scholars for its ability to temper partisan advantage in the map-drawing process (Cain Reference Cain2012; Stokes Reference Stokes and Grofman1998). We removed the multistage bargaining process in the model, thereby restricting students to a single round of binding arbitration in which each group presented its proposal and responded to questions from other groups and course instructors. The projects were assessed on the basis of adherence to mandatory criteria and persuasive expression of discretionary criteria in the presentation phase of the game.
We compiled and provided the student groups with a variety of data and supplemental materials to aid their work in drawing the congressional districts (these documents are available to interested readers). Each group was given a spreadsheet with population counts of the total and voting-age population, as well as the 2010 US Census count of white, black, Latino, and other racial groups in each parish and census tract in the state. Counts of registered Democrats, Republicans, and unaffiliated voters in each parish were given to all groups using the secretary of state’s voter-registration statistics. We created a list of adjacent census tracts to aid in drawing contiguous districts. Finally, we produced a three-page guide for using the GIS software to produce district maps, which was sufficient for the students to complete the simulation. We distributed the guidelines and tutorials for the simulation three weeks before the end of the semester.
Students were required to submit their district plans and related documents and to prepare an oral presentation describing their plan without seeing those proposed by other groups. Doherty and Ryan (Reference Doherty and Ryan2014) reported that students generally adopt one of three strategies: (1) draw as many “cracked”-up districts as possible; (2) draw as many “packed” districts as possible; or (3) draw geographically compact districts. In their presentations, the groups generally used approach (1) or (2) in the map designs for their clients.
To draw the maps, the students were introduced to QGIS (available at https://qgis.org), an open-source GIS, and given the necessary files for mapping their districts in QGIS-compatible formats.Footnote 5 Along with the US Census population data for the state, we provided a tutorial explaining how to sort census tracts, places, and parishes into one of six districts and then how to map those areas using QGIS. The software proved helpful for the students to visualize their proposed districts, identify noncontiguous portions of districts, and produce summary statistics for each district. For example, students could generate a map of the black proportion of the population in each census tract (referred to as a “choropleth map” in GIS terminology) as they added tracts to a district. We initially thought—and the students concurred at the conclusion of the simulation—that providing both tabular (i.e., an Excel spreadsheet) and visual (i.e., QGIS shapefiles) formats of the relevant US Census data was helpful for them to become acquainted with the population distribution in the state and the process of drawing their districts.
SUMMARY OF STUDENT-DRAWN MAPS
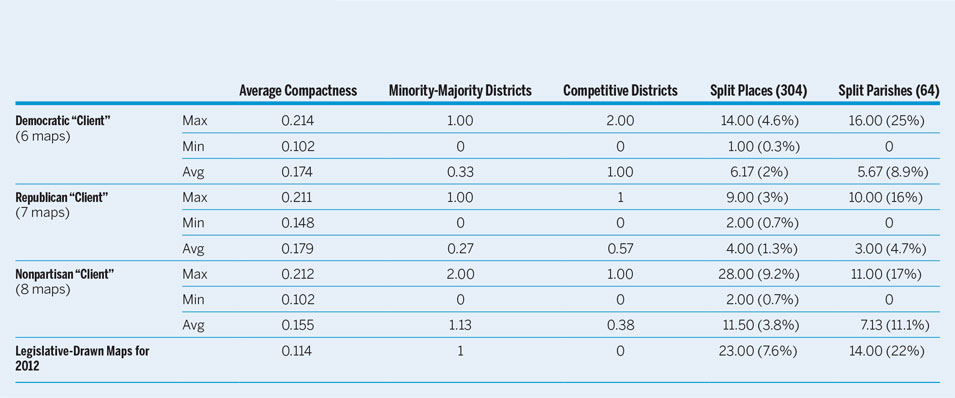
Our classes produced a total of 21 maps.Footnote 6 Table 1 summarizes statistics for the three clients and, for comparison, the map drawn by the legislature for the 2012 elections. The student-drawn maps were notable for outperforming the actual map along three dimensions, a finding that is consistent with other redistricting exercises (Altman and McDonald Reference Altman and McDonald2013). With two exceptions, the students produced maps with higher average compactness scores than the actual map.Footnote 7 A higher proportion of places (excluding US Census–designated places from this count) and parishes were kept in a single congressional district in most of the student groups as well. Most of the groups, however, expressed difficulty in drawing either minority-majority or competitive districts.Footnote 8
Table 1 Comparison of Plans
We were curious to see the degree to which district maps would resemble one another and found common elements among them. Nine maps divided the southern coast of Louisiana using the boundary of St. Mary’s Parish. Three maps united parts of New Orleans and Baton Rouge; none of the maps included all of both cities in the same district. Ten maps drew Shreveport (in the northwest) and Monroe (in the northeast) in the same congressional district along the northern tier of the state. One group based its map on regions of the state as identified by the Louisiana Office of Tourism. Six districts, from a total of 128, were identical across maps from different groups. One of these districts—in the northwest corner of the state—appears in four different maps; the second—in the south-central region—appears in two different maps.
Groups expressed difficulty in drawing maps in accordance with the Voting Rights Act without drawing districts solely motivated by race, which is forbidden by the US Supreme Court following decisions in Shaw v. Reno (509 US 630 1993) and Miller v. Johnson (515 US 900 1995). Many groups reasoned, on the basis of US Census data, that at least one district should have a black majority. As reported in table 1, however, many groups did not have a minority-majority district; however, two groups managed to create them. By contrast, many groups reported difficulty in drawing compact districts that also had a nonwhite majority, which is the first part of the three-part test to justify the creation of majority-minority districts as promulgated in the US Supreme Court decision, Thornburg v. Gingles (478 US 30 1986). When forced to decide one way or another, most groups opted to draw compact districts, justifying their decision on the grounds that the black population in the state was not sufficiently clustered to include in a district that would not be bizarre in shape.
The students also expressed uncertainty about what constitutes a workable majority in a given district. A simple majority may be sufficient in certain circumstances such as universal turnout but may be insufficient to guarantee descriptive representation for the district population under more realistic notions of turnout. That the students struggled with this aspect of redistricting is not surprising, given the general complexity of representation for racial and ethnic minority groups.
The maps also exhibited various approaches to balancing incumbent protection and competitive elections. In their classroom exercise, Doherty and Ryan (Reference Doherty and Ryan2014) raised a question about what is considered fairer: parties winning seats safely or creating competitive districts in which either party could win? The question of fairness has been discussed in redistricting research (Brady and Grofman Reference Brady and Grofman1991; Brunell Reference Brunell2006; Bullock Reference Bullock2010; Monmonier Reference Monmonier2001). Unsurprisingly, the students noticed that addressing fairness in redistricting is not trivial (Cain Reference Cain1984). Some groups even questioned whether it is possible to create a map that is fair on the basis of outcomes for all actors in the process. A point of consensus emerged on the utility of procedural fairness in contrast to fairness of outcomes. Making an argument in the context of a competition before a neutral party was perceived by students to be fairer than hashing out a district plan in the context of legislative politics.
The groups displayed acute awareness of the strategic, game-theoretic aspects of the simulation and were able to act appropriately. As a secondary aspect of this exercise, the students were able to use GIS software to project their maps with minimal difficulty.
DISCUSSION AND CONCLUSION
We developed the Louisiana Redistricting Game with two primary goals. We wanted to create a course exercise that would:
● teach redistricting in a way that would be salient, realistic, and accessible to students
● count as a decision game by accurately reflecting real-world redistricting conditions with their considerable complexities
The result was a success in terms of these two goals. The student groups constructed valid redistricting proposals that catered to their clients’ interests. Moreover, they were able to tailor their plans and, in the arguments they used in presenting them, to appeal to principles that would be attractive to a nonpartisan commission. One group, seeking natural communities of interest, modeled its plan on a map produced by a tourism-promotion agency in Louisiana and then used the similarities between the map and its own proposal to buttress its case. The groups displayed acute awareness of the strategic, game-theoretic aspects of the simulation and were able to act appropriately. As a secondary aspect of this exercise, the students were able to use GIS software to project their maps with minimal difficulty. The exercise was realistic because actual census data were used by the groups.
The materials in the game departed from realism in three ways: data were available only at the census-tract level; election-results data did not match perfectly with census tracts; and the plans were allowed a 1% variance from exact population equality. Regarding granularity of the population data and incompatibility of voting data and US Census geographical units, we agree that the cause of realism would be advanced if more information were made available. We concluded, nonetheless, that doing so would produce no better than marginal improvements in the overall educational value of the game. On this last point, the 1% variance is small enough that adjustments can be made to achieve exact population balance without undermining the strategic aspect of the plans. Requiring exact balance, we concluded, is not necessary from an educational point of view and neither is it needed to maintain the status of the exercise as a decision game. For comparison, a recent study of the utility of detecting gerrymandered district plans used a 2% population variance (Chikina, Frieze, and Pegden Reference Chikina, Frieze and Pegden2017).
Looking forward, we envision decision games such as the Louisiana Redistricting Game being generalized and scaled for both educational and social-engagement purposes. It is a short step from this game to crowd-sourcing of innovative and surprising ideas in other areas of policy making that involve geography and resource allocation (Sunstein Reference Sunstein2006). In summary, we envision development of a robust field of study and play of decision games in the social sciences akin to that already in place for military organizations. The Louisiana Redistricting Game is only one step in that direction.
SUPPLEMENTARY MATERIAL
To view supplementary material for this article, please visit https://doi.org/10.1017/S1049096518000410.
ACKNOWLEDGMENTS
This work was supported by a fellowship within the FITweltweit program of the German Academic Exchange Service (DAAD). Any views expressed in this article are the sole responsibility of the authors and do not necessarily reflect the views of the American and Finnish governments, any of their agencies, or the Fulbright Foreign Scholarship Board. The content of this article was not reviewed or approved by any of these entities. Supplemental material related to this article, including US Census data from Louisiana and guides to using QGIS, is available from the PS: Political Science & Politics journal website.


