


Elevated blood pressure (BP) is a key contributor to CVD aetiology and mortality(Reference Virani, Alonso and Benjamin1,Reference Yang, Cogswell and Dana Flanders2) . Although association between BP and CVD risk is shown to be continuous, BP levels are often categorised into stages of hypertension to guide clinical decision and inform public health policy(Reference Whelton, Carey and Aronow3). In epidemiologic studies, the definition of hypertension extends beyond BP levels to include evidence of antihypertensive medication usage and diagnosis by physicians. Using well-defined hypertension criteria in addition to a continuous BP measure is particularly helpful for a study in an older population, where antihypertensive medication is commonly used resulting in biased BP measurements. A recent estimate of hypertension prevalence based on set criteria in USA adults aged ≥ 65 years was 78·2 %(Reference Virani, Alonso and Benjamin1). As both continuous BP and hypertension status have been associated with increasing cardiac risks(Reference Whelton, Carey and Aronow3), these measures are needed in a nutritional epidemiologic study investigating diet–disease relationships, especially in the context of older age.
Choline is a conditionally essential nutrient found in several components of a healthy diet. Choline is concentrated in animal-sourced foods (e.g. eggs, beef, poultry and fish), grains (e.g. wheat germs), soybeans, nuts, seeds and some vegetables(Reference Patterson, Bhagwat and Williams4). Choline can also be made within the body, though endogenous production is not sufficient to meet metabolic needs(Reference Zeisel, Da Costa and Franklin5). Both dietary and endogenous choline are metabolised to compounds that function in the production of membrane phospholipids, lipoproteins, the methyl-group donor S-adenosylmethionine and the neurotransmitter acetylcholine(Reference Zeisel6). These roles, along with the high degree of choline insufficiency in the USA population(7,Reference Wallace, Blusztajn and Caudill8) , make choline a potential target nutrient for nutritional intervention at an older age. Epidemiologic evidence linking dietary choline with BP levels or risk of hypertension is scarce. Our previous cross-sectional National Health and Nutrition Examination Survey (NHANES) study reported that dietary choline tended to be negatively associated with hypertension risk in women(Reference Taesuwan, Vermeylen and Caudill9). A recently published cohort study also reported a negative association in Iranian adults(Reference Golzarand, Bahadoran and Mirmiran10). Dietary choline is a precursor for several metabolites involved in BP regulation including the neurotransmitter acetylcholine. Acetylcholine has been implicated in the reduction of BP and heart rates, and this response to acetylcholine declines in ageing(Reference Zhu, Zhou and Wang11,Reference Fisher, Vincent and Gomeza12) . Endogenous choline synthesis is also diminished in men and postmenopausal women(Reference Resseguie, Song and Niculescu13,Reference Fischer, da Costa and Kwock14) , and thus these groups rely on dietary choline to meet the metabolic need. In line with this hypothesis, our previous study identified in a sensitivity analysis an inverse association between choline intake and systolic BP (SBP) among adults aged ≥ 65 years(Reference Taesuwan, Vermeylen and Caudill9), but the extent to which this is true remains unknown and is the focus of the current study.
Older men and women are likely to not meet their choline intake recommendation. Data from 2017 to 2018 NHANES indicates that both male and female older adults (age ≥ 70 years) had average dietary choline intake of 353 and 263 mg/d, which are well below their recommended intake of 550 and 425 mg/d(7). Given the proposed connections between choline and BP, the failure of older adults to meet current choline intake recommendations and the increased cardiac risk in this subgroup, there is a need to explore the relationship between choline intake and BP in older adults.
The study objective was to investigate the relationships between total choline intake and BP and hypertension among USA adults aged ≥ 65 years using the sample from the NHANES 2011–2014. Total choline intake was hypothesised to be inversely associated with BP and/or hypertension prevalence in older adults.
Experimental methods
Study population
Study samples were obtained from NHANES 2011–2014 data. NHANES is a cross-sectional survey conducted every 2 years by the Centers for Disease Control and Prevention to compile health-related information using a nationally representative sample of noninstitutionalised USA civilians(Reference Johnson, Dohrmann and Burt15). Person-level data were obtained during household interviews and physical examination at mobile examination centers by trained personnel(Reference Johnson, Dohrmann and Burt15). Data quality was controlled extensively. Details on data collection procedures and protocols are available elsewhere(16). The NHANES study was approved by National Center for Health Statistics Research Ethics Review Board. NHANES data sets are publicly accessible (https://www.cdc.gov/nchs/nhanes/index.htm).
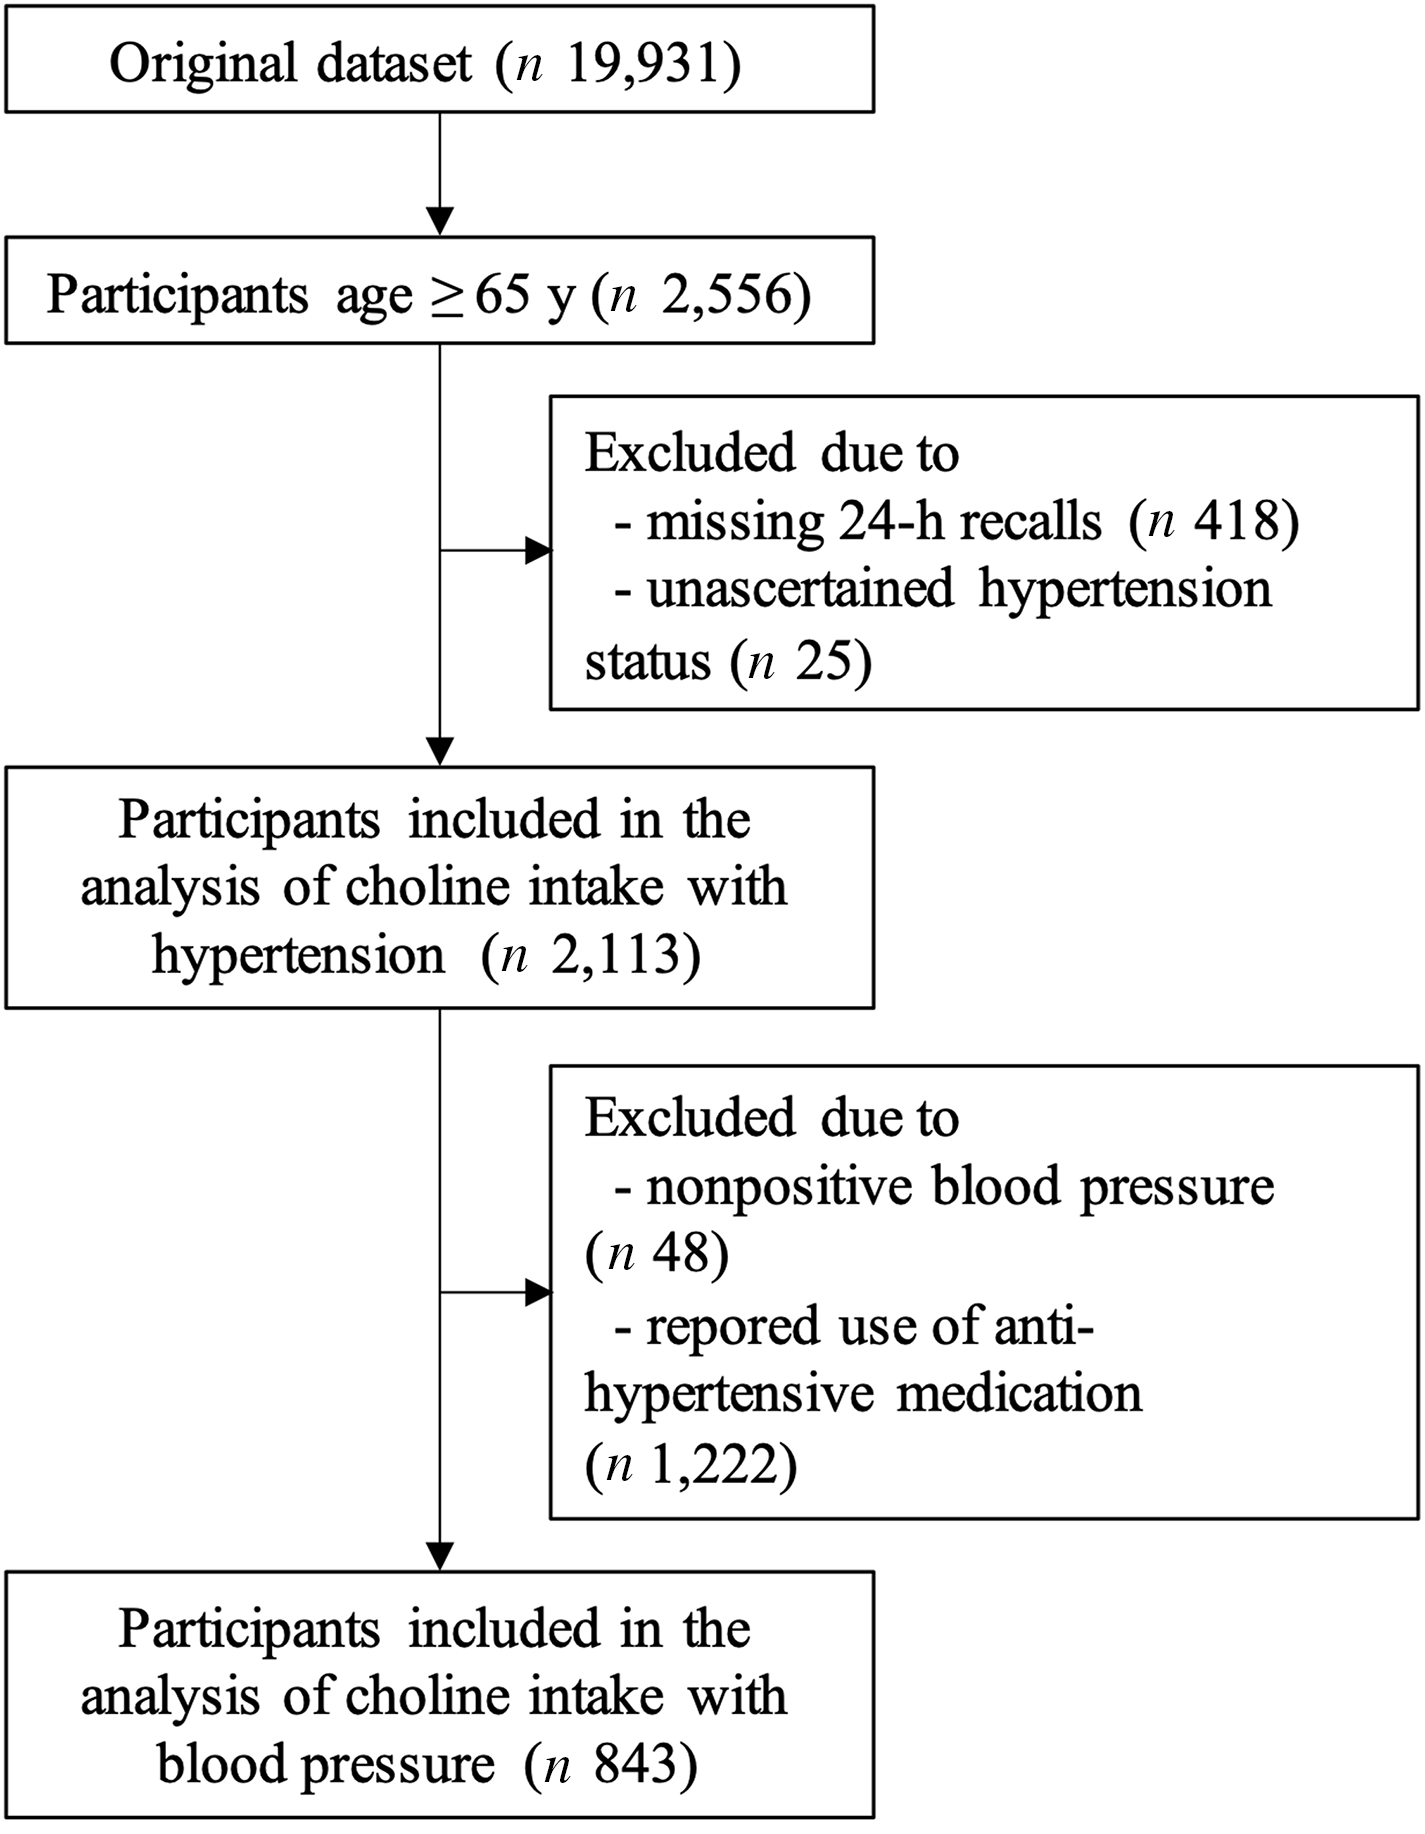
Two different eligibility criteria were applied to the original NHANES 2011–2014 data set of 19 931 individuals to generate two final analytic samples. The first sample was used for the choline–hypertension analysis. It comprised 2113 individuals who were ≥ 65 years old, had at least one 24-h dietary recall data and whose hypertension status had been ascertained. The participant flow chart is shown in Fig. 1. The first sample was further subset to create the second sample for the choline–BP analysis. In this analysis, people without BP values (n 48) or people who reported using antihypertensive medication (n 1222) which could mask true BP values were excluded. The final sample size for use in the choline–BP analysis was 843 individuals.
Flow chart of older participants in 2011–2014 National Health and Nutrition Examination Survey who were included in the analysis between total choline intake and hypertension (n 2113), and those who were not using antihypertensive medication were further included in the choline–blood pressure analysis (n 843).
Total choline intake measurements
Choline intake information was obtained from two 24-h recalls. A trained interviewer administered a recall at the mobile examination center and during a follow-up phone call (3–10 d later) using the validated Automated Multiple Pass Method(16). Information was translated into dietary intake per day by using the USDA’s Food and Nutrient Database for Dietary Studies(16). Supplemental use during the past 24 h was queried after each recall, and nutrient amounts in the supplements were obtained from NHANES’ dietary supplement database(16). In the current study, nutrient values from dietary and supplemental sources were combined to generate total intake per day. To maximise sample size, an average intake per day was calculated from 1 to 2 recall days depending on data availability for each person.
Covariates
Potential confounders for choline and hypertension or BP relationships were identified a priori based on our previous work(Reference Taesuwan, Vermeylen and Caudill9). These included age (years), sex (male and female), race (non-Hispanic white, non-Hispanic black, and Mexican American, Hispanic and others), physical activity (h/week of high-moderate activities), BMI (kg/m2), marital status (married and not married), education levels (<9th grade, 9–11th grade, high school graduate, some college degree and college graduate), ratio of family income to poverty (0–5), smoking status (non-, former and current smoker) and average intake of energies (kcal/d), fat (g/d), cholesterol (g/d), Na (mg/d), folate (µg/d), vitamin B6 (mg/d) and vitamin B12 (µg/d). Participants reported all of the information except BMI and the dietary component during the household interviews(16). BMI was measured at the mobile examination centers using a standard procedure by trained health technicians(16). 24-h Recalls were also conducted at the mobile examination centers by trained interviewers(16).
Parsimonious models were constructed using a set of confounders that influenced the effect estimates. An influential confounder should show a bivariate relationship with the exposure and the outcome variables. Additionally, the confounder should alter the choline estimates when entering into a model that was adjusted for age, sex, race and average energies. Using this guideline, the final set of confounders for all analyses were age, sex, race, education levels, average energies intake and average Na intake. Notably, cholesterol intake also influenced the effect estimates but was not included due to its collinearity with choline intake.
Effect modification of the choline–hypertension or BP relationships by sex, race, BMI and comorbidity were investigated because sex, race and comorbidity were shown to stratify the association of choline or its related metabolites with hypertension risk in other populations(Reference Taesuwan, Vermeylen and Caudill9,Reference Ge, Zheng and Zhuang17) . BMI was considered for its relevance in the context of choline intake and disease risks. Presence of comorbidity was defined as self-reported history of either congestive heart failure, coronary heart disease, angina pectoris, heart attack or stroke.
Hypertension and blood pressure outcomes
Individuals with hypertension were defined by the following criteria: (1) having been told twice of high BP by doctors or (2) reportedly taking antihypertensive medication or (3) exhibiting average SBP ≥ 140 mmHg or average diastolic BP (DBP) ≥ 90 mmHg. The 140/90 cut-off was chosen because it was widely used for hypertension diagnosis at the time of data collection(Reference Chobanian18). Individuals without hypertension were defined based on complete evidence of not meeting any of the three criteria.
BP was also analysed as a separate outcome from hypertension status in participants who had BP measurements and who did not report using antihypertensive medication. Exclusion based on the antihypertensive medication criterion resulted in loss of hypertensive cases (n 1222). Participants’ BP were measured at the mobile examination centers by certified examiners. With the participants in a seated position, the examiners used the sphygmomanometer (Baumanometer®) to determine the maximum inflation level and obtained three consecutive BP readings(16). Averages of 1–3 BP readings were used for all analyses.
Statistical analysis
2011–2014 NHANES data were previously checked for errors, inconsistencies and extreme values(16). All variables used in the current analysis were re-inspected for errors and extreme values and appeared acceptable overall. Most variables had normal distribution with the exception of physical activity and average intakes of folate, vitamin B6 and vitamin B12, all of which were right-skewed. However, these variables did not show large influence on the choline–hypertension or BP associations and were left out of the final models. Bivariate associations between choline and SBP or DBP showed little evidence of non-linearity, and addition of the choline square term to the fully adjusted models did not alter the choline estimates.
Means and standard deviations for numeric variables and proportions for categorical variables (Table 1) were computed using PROC SURVEYMEANS and PROC SURVEYFREQ procedures within the SAS software (ver 9.4), respectively. Nutrient intakes were adjusted for total energies using the residual method and standardised to 2000 kcal(Reference Willett and Stampfer19). Logistic regression for complex survey data (PROC SURVEYLOGISTIC) was used to determine the association between total choline intake (mg/d) and the prevalent odds of hypertension. Mixed-effect linear regression for complex survey (PROC SURVEYREG) was employed for the association between total choline intake and SBP or DBP. Models were adjusted for covariates as detailed above, and the variances were estimated using the Taylor series linearisation method. Appropriate sampling weights were used to account for complex survey design following NHANES analytical guidelines(20). Missing data in the covariates constituted 8·4–10·7 % of observations. These observations were excluded from the computation of model estimates but were accounted for in the variance estimation through the NOMCAR option, because the missing values were suggested to be not missing at random. Residuals of the final models did not show violation of the model assumptions. In addition to main effect analyses, effect modification by sex, race, BMI and comorbidity were separately investigated by interacting them with total choline intake. For result interpretability, BMI was analysed as a categorical variable (< 18·5, 18·5–24·9, 25–29·9 and ≥ 30 kg/m2). Further stratification analysis was performed when P –interaction was < 0·2. Multiple comparison adjustments were not made unless noted otherwise.
Characteristics of participants aged ≥ 65 years used to determine the associations between total choline intake and prevalent hypertension (n 2113) or blood pressure (n 843) in 2011–2014 National Health and Nutrition Examination Survey*

* Values are % or mean ± sd. Sample sizes varied due to missing values with minimum n 1440 (hypertensive), 498 (non-hypertensive), 1938 (total for hypertension analysis) and 767 (total for blood pressure analysis). All estimates were adjusted for complex survey design.
† Hypertensive group differed significantly (P< 0·05) from non-hypertensive group based on a Rao–Scott modified likelihood ratio chi-square test (categorical variables) or a t test (continuous variables).
‡ Standardised to 2000 kcal/d.
Several planned sensitivity analyses were conducted. In the first analysis, the measurement errors on the hypertension criteria were investigated by subdividing people with hypertension into definite, probable and possible groups. The definite group included those who reported having hypertension diagnosis (criterion 1) and concurrently took antihypertensive medications (criterion 2) or those with criterion 1 and concurrently had high SBP or high DBP (criterion 3). The probable group included people with hypertension defined by criterion 1 only or those defined by criteria 2 and 3. The possible group included people defined by criterion 2 only or criterion 3 only. In separate sensitivity analyses, individuals who were missing 1–2 BP readings, had comorbidities, or had only one day of 24-h recall data were excluded. For all analyses, P = 0·05 was used as a cut-off for statistical significance and 0·1 was used to indicated trends.
Results
Relationship between choline intake and hypertension prevalence among older participants
Participants aged ≥ 65 years (n 2113) included in the analysis represented a population of 35,514,492 USA adults. The prevalence of hypertension in this sample is 70·8 %. On average, the participants were 72·8 years of age with SBP of 133 mmHg, DBP of 66 mmHg and BMI of 28·7 kg/m2 (Table 1). The majority of participants were non-Hispanic White, women, married and non-smokers and attended or graduated college. Compared with participants without hypertension, participants with hypertension were significantly (P < 0·05) older and had lower proportions of men, non-Hispanic White and college graduates, as well as a lower ratio of family income to poverty indicating less wealth. The hypertensive group was likely to have higher BMI and self-reported diagnosis of comorbid conditions (congestive heart failure, coronary heart disease, angina pectoris, heart attack and stroke). They were also likely to be less physically active, currently smoking and consuming less energies and protein. The lower energetic consumption in the hypertensive group (v. the non-hypertensive) may partly be due to older mean age, and both age and total energies were included in multivariable analyses.
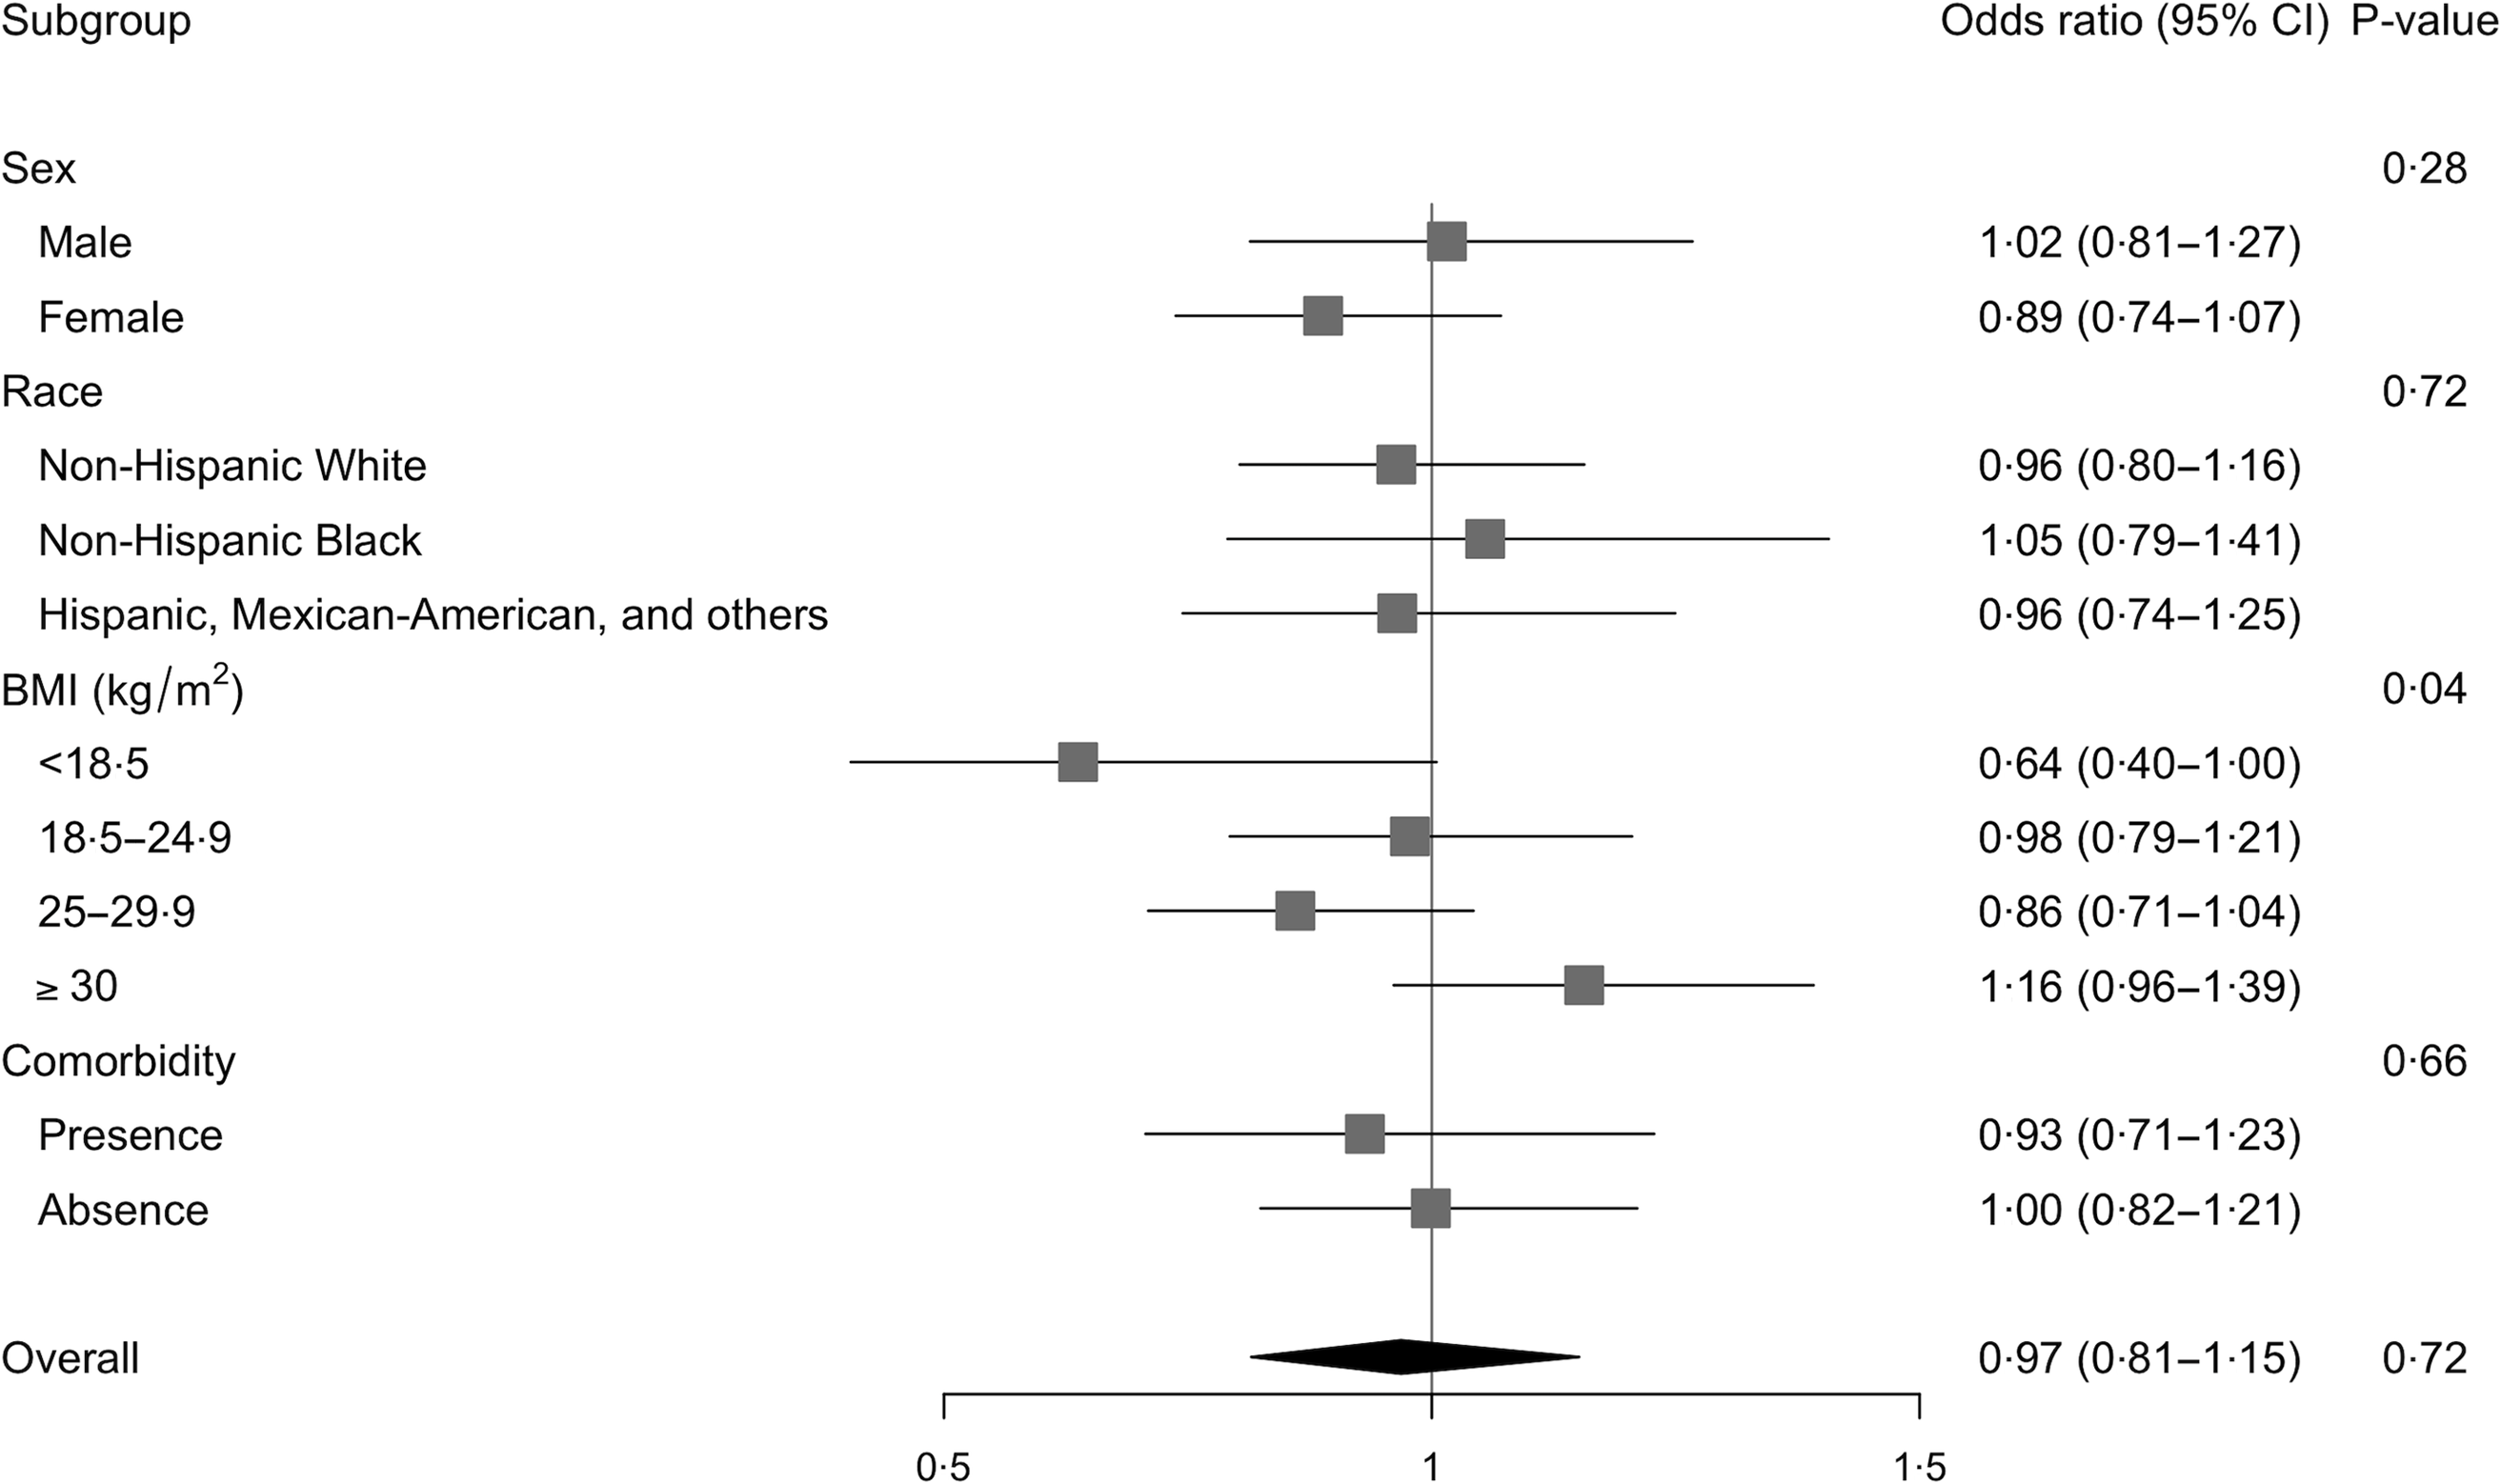
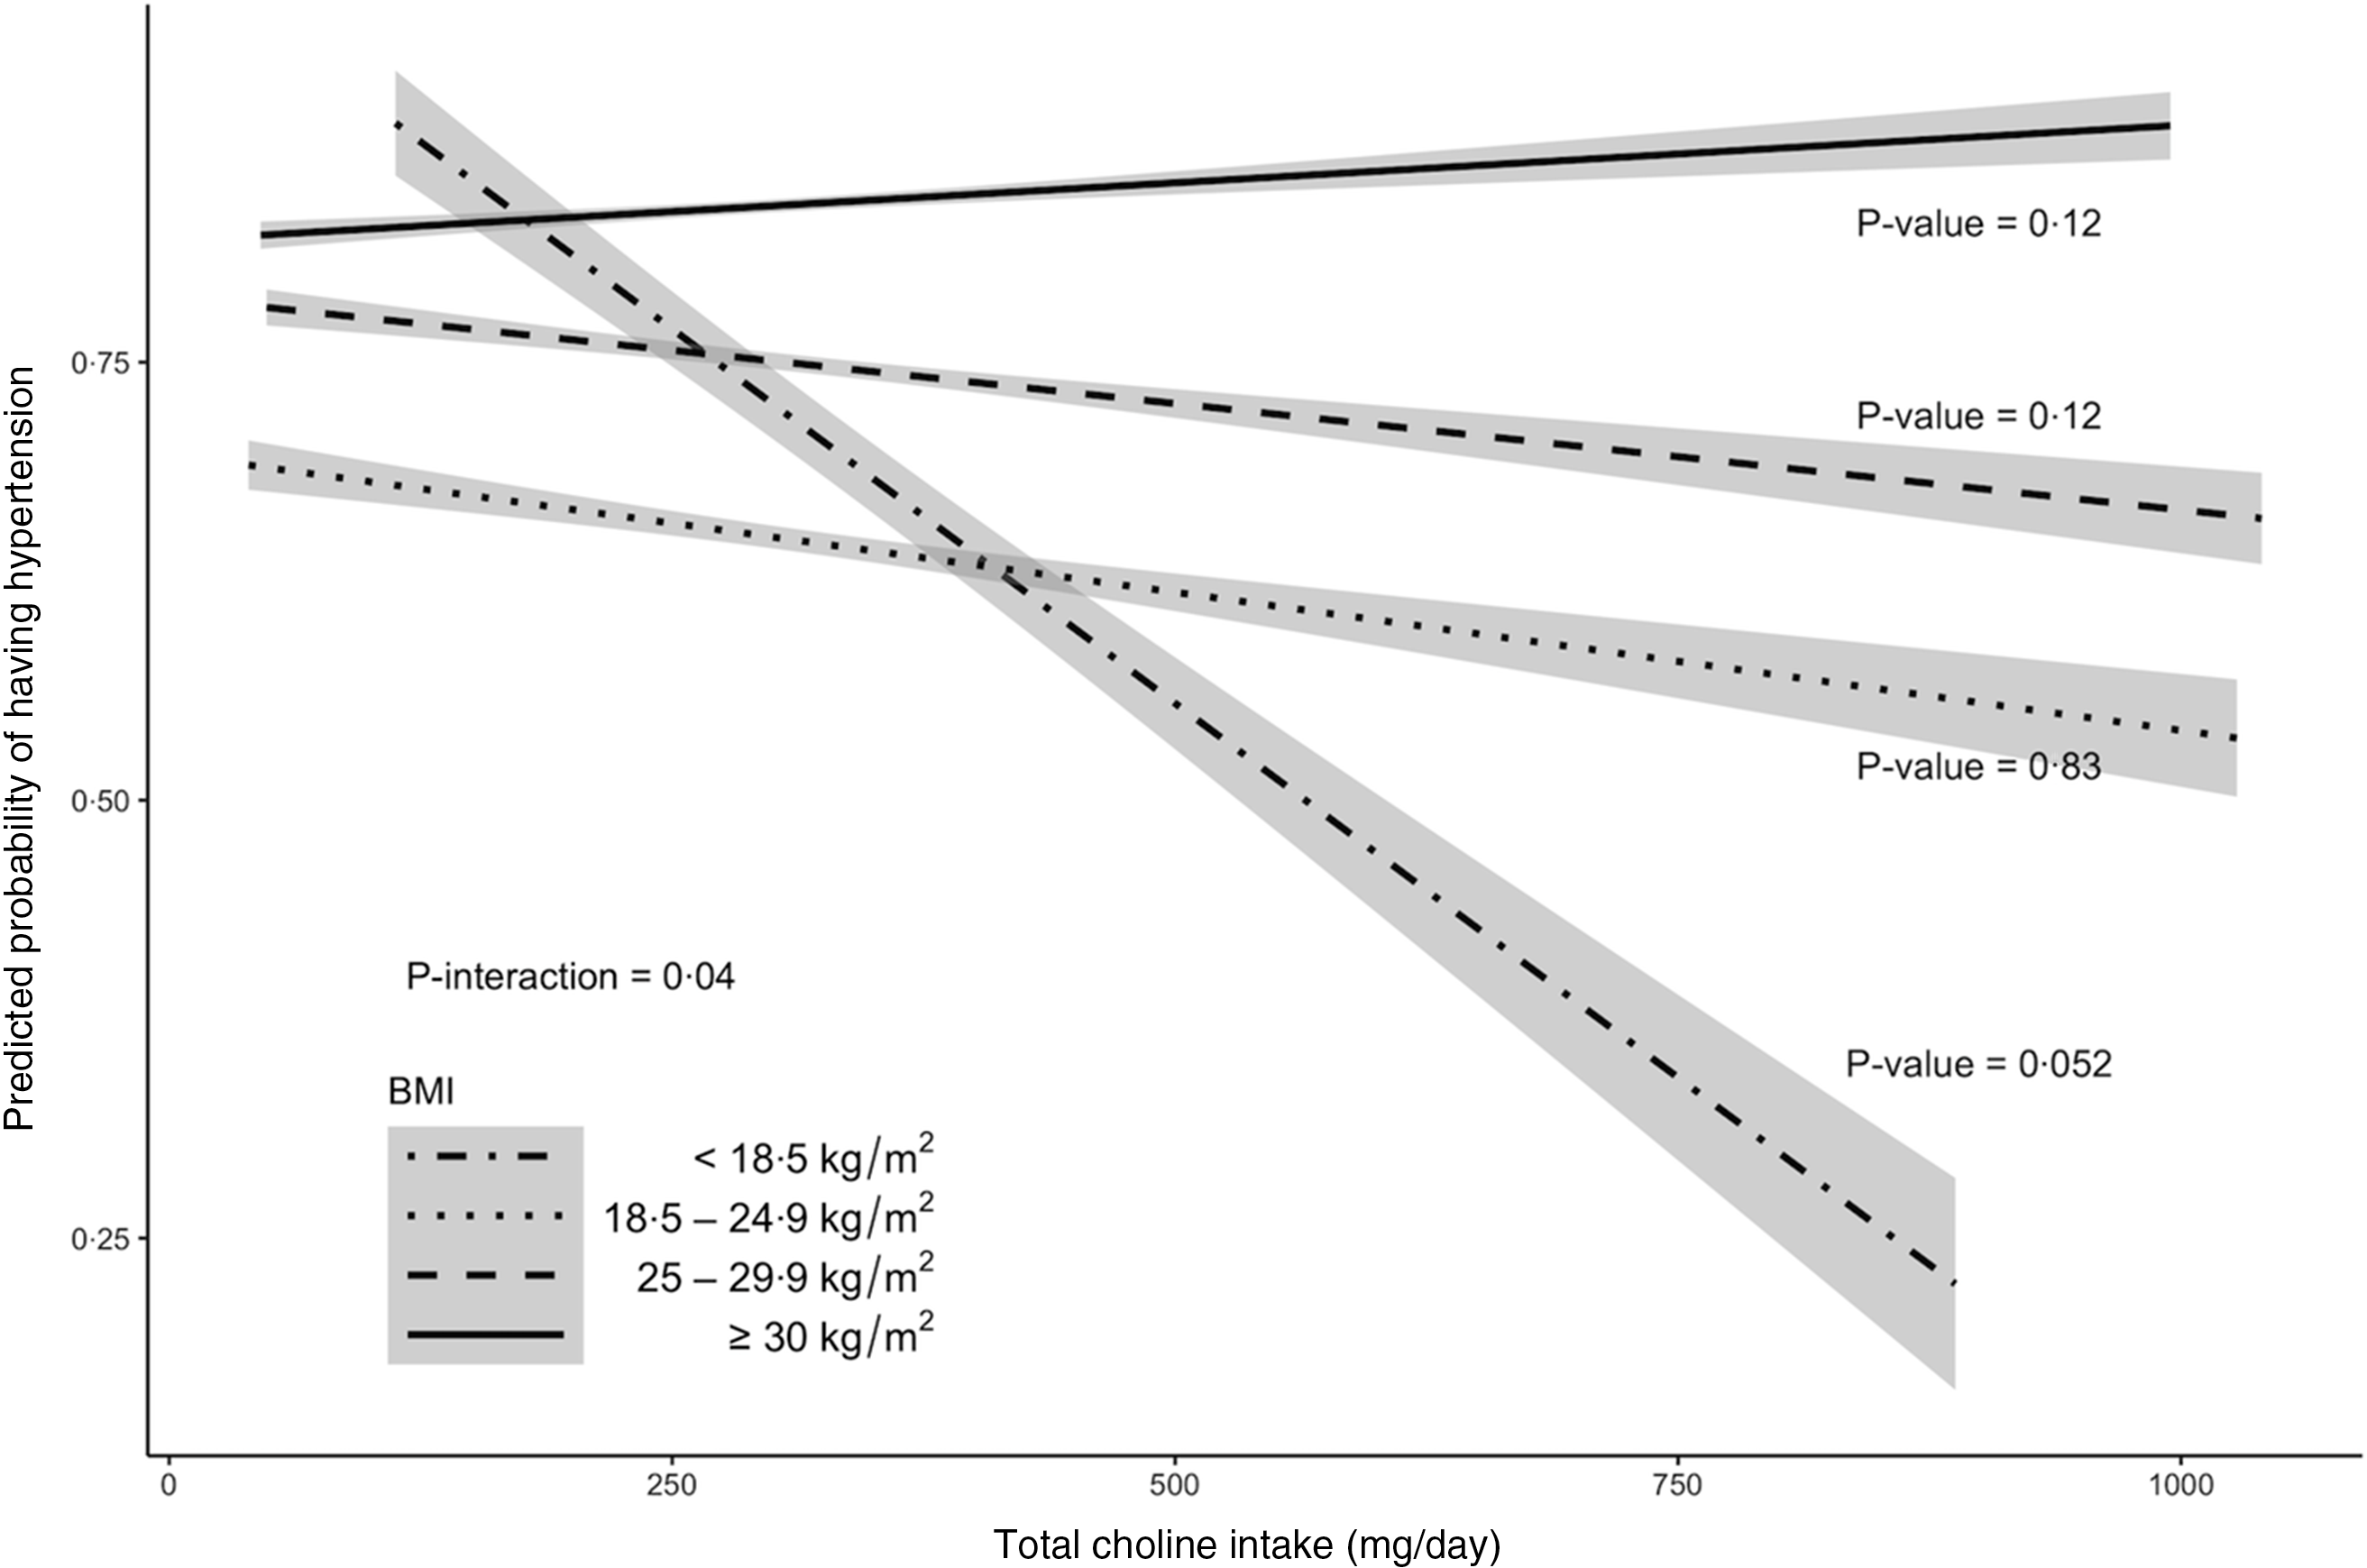
Multivariable-adjusted analysis revealed that the association between total choline intake (dietary + supplemental) and the odds of hypertension differed by BMI categories (P –interaction = 0·04, Fig. 2 and 3 and online Supplementary Fig. 1). Specifically, OR showed an increasing pattern with increasing BMI categories, with OR for the underweight group being significantly lower than OR for the obese group (OR per 100 mg of choline: 0·64 v. 1·16; P = 0·04 after Bonferroni adjustment). Within the underweight group, increased choline intake tended to be associated with lower odds of hypertension (OR (95 % CI): 0·64 (0·40, 1·00); P = 0·05). The association remained unchanged after excluding participants who reported one recall day or after limiting the analysis to those who were ‘definitely’ hypertensive. The association was slightly weakened (OR (95 % CI): 0·70 (0·45, 1·08)) when participants with comorbidities were excluded. The association was neither modified by sex, race nor by presence of comorbidity. Analysis of dietary choline showed similar effect estimates with those of total choline intake (online Supplementary Table 1).
Logistic association between total choline intake and odds of hypertension and modifications by sex, race, BMI or comorbidities among older adults in 2011–2014 National Health and Nutrition Examination Survey (n 2113). All models were adjusted for complex survey design and the following covariates: age, sex, race, education levels, average energies intake and average Na intake. Odds ratios were based on n 1935 due to missing data in the covariates and are expressed per 100 mg of total choline.
Model prediction of hypertension probabilities for older adults in 2011–2014 National Health and Nutrition Examination Survey (n 2113) by BMI category. The predicted probabilities were obtained from a complex survey design-adjusted logistic regression that included age, sex, race, education levels, average energies intake and average Na intake as covariates. Trendlines and 95 % CI contours were used to delineate each category. P-value < 0·05 is considered statistically significant.
Relationship between choline intake and blood pressure among older adults
To explore a continuous relationship of total choline intake with BP, the participants were further subset to include only those who had BP measurements that were not masked by antihypertensive medication (n 843). Because participants who reported using antihypertensive medication were considered hypertensive cases in the choline–hypertension analysis, excluding these participants reduced the prevalence of hypertension in the choline–BP analytic sample to 31·5 % (Table 1). The characteristics of this subgroup were changed such that they were younger (P < 0·001), were less likely to be Mexican American, Hispanic or other ethnics (P < 0·001) and had a higher socio-economic status and better health status overall (more college graduates, a higher mean ratio of family income to poverty, lower mean SBP, slightly higher mean DBP, lower % comorbidity and higher mean energetic intake; P < 0·05).
Relationships between total choline intake and SBP or DBP appeared modest. After multivariable adjustment, increased total choline intake was not associated with SBP (mean ± sem change in BP per 100 mg of choline: −1·03 ± 0·74 mmHg; P = 0·16; Table 2). However, when participants with < 3 BP measurements were excluded, 100-mg increase in choline intake tended (P = 0·06) to be associated with 1·36 ± 0·72 mmHg decrease in SBP. No evidence of effect modification by sex, race, BMI or comorbidity was observed.
Linear associations between total choline intake and systolic or diastolic blood pressure and modifications by sex, race, BMI or comorbidities among adults aged ≥ 65 years in 2011–14 National Health and Nutrition Examination Survey (n 843)

* βs represent changes in blood pressure per 100-mg increase in choline intake and were adjusted for complex survey design and the following covariates: age, sex, race, education levels, average energies intake and average Na intake. Estimates were based on n 767 due to missing values in the covariates.
† P-value against the null hypothesis of no change in mean diastolic blood pressure.
Association of total choline intake with DBP was modified by comorbidity (P –interaction = 0·03) such that the direction of association was negative among people without comorbidity (–0·68 ± 0·61 mmHg; P = 0·26) and positive among people with comorbidity (1·36 ± 0·89 mmHg; P = 0·13). However, increased choline intake was not associated with changes in mean DBP within groups. The interaction effect persisted in all planned sensitivity analyses. The associations between total choline intake and DBP were not modified by BMI, sex or race. Results of analysis using dietary choline alone were in line with the results for total choline (online Supplemental Table 1). Notably, dietary choline tended to be negatively associated with SBP (–1·31 ± 0·76 mmHg; P = 0·08) and showed a stronger negative direction of association with DBP compared with total choline analysis (–0·47 ± 0·63 mmHg; P = 0·45 v. –0·37 ± 0·60 mmHg; P = 0·53).
Discussion
This study examined relationships of choline intake with hypertension and BP among USA older adults in the 2011–2014 NHANES sample. Overall, the associations of choline intake with BP levels and hypertension risk among older adults are dependent on other risk factors. Specifically, a higher total choline intake tended to be associated with lower odds of hypertension in the underweight group and not in the higher BMI groups. Since low BMI among older adults could be a result of weight loss from age-related illness, people with comorbidities were excluded in a sensitivity analysis. This resulted in slight dilution of the effect estimate, indicating some residual confounding by disease status. Nonetheless, the effect estimate indicates that 30 % lower odds still persisted, which could be clinically relevant and may be detectable in a larger sample size. Further examination showed that the underweight group had superior health status to the obese group. Specifically, the underweight participants were likely to be older, wealthier, free of comorbidities and non-smokers compared with obese counterparts. The underweight was also likely to consume less fat, cholesterol and Na (data not shown). Although protein intake did not differ statistically between BMI groups, the underweight had the highest intake (91 g/d v. 72–74 g/d for other groups). This could be relevant given evidence suggesting that BP of older adults was more responsive to dietary protein(Reference Altorf–van der Kuil, Engberink and Brink21) and that high protein intake was associated with reduced mortality risk in this age group(Reference Levine, Suarez and Brandhorst22). A meta-analysis of randomised controlled trials also reported that dietary protein intake, compared with carbohydrate, was associated with lower BP(Reference Rebholz, Friedman and Powers23). A protein-rich diet containing one-carbon nutrients has also been shown to improve BP in rats(Reference Mariotti, Hammiche and Blouet24) suggesting that choline (a one-carbon nutrient) may modulate the effect of dietary protein on BP.
The effects of BMI on morbidity and mortality in older adults remain controversial. BMI exhibits a U-shaped relationship with the risk of hypertension(Reference Redón, Cea-Calvo and Moreno25) and stroke in the elderly(Reference Wassertheil-Smoller, Fann and Allman26). However, BMI is not an appropriate surrogate measure of body fat mass in older adults, especially because height and muscle decline with ageing(Reference Visscher, Seidell and Molarius27). As such, examination of diet–disease relationships by BMI may not reflect different obesity risk categories as suggested by the lack of choline–hypertension association in the obese group in the current study.
Results from the analysis of BP were not entirely consistent with that of hypertension because of the difference in the eligibility criteria. Hypertension was defined using three criteria (self-report of physician’s diagnosis, use of antihypertensive medication and SBP–DBP cut-off of 140/90 mmHg). In contrast, analysis of BP was performed on a subset of sample that had available BP readings that were not masked by use of antihypertensive medication. The purpose of this analysis was to examine a continuous relationship between choline intake and BP. However, exclusion of 1270 participants shifted the participant profile such that the participants became younger, less likely to be Mexican American, Hispanic or other ethnics and had a higher socio-economic status and better health status overall. Within this sample, SBP had a rather large, tended negative association (–1·36 ± 0·72 mmHg) with choline intake when people with incomplete BP measurements were excluded or when dietary choline was used instead of total choline (diet + supplement). Although not statistically significant, SBP was also associated more negatively with choline intake in the underweight group compared with the obese group (–1·56 v. −0·72 mmHg). These findings suggest that there may be a true underlying association between choline intake and SBP that was attenuated in part by measurement errors in BP and supplemental information collection. Furthermore, DBP was found to be divergently associated with choline intake such that the direction of association was negative among people without comorbidities and positive among those with one or more comorbidities. This result was not observed with SBP possibly because older people often developed isolated systolic hypertension. In this age group, the distribution of SBP for the comorbidity and the comorbidity-free groups was likely to closely overlap, making the differential choline–SBP association difficult to detect. DBP levels are normally not changed unless comorbidity is also present, and thus its distribution was likely more separable by comorbidity status.
The study results suggest that the associations of choline intake with hypertension or BP were more apparent in a healthier subgroup (i.e., relatively healthy people in the analysis of BP, people without comorbidity). The observed beneficial association may be due to the role of choline in the biosynthesis of the neurotransmitter acetylcholine. Acetylcholine decreases heart rates and contraction forces(Reference Brown, Brandl and Wess28). Acetylcholine also decreases BP by activating the muscarinic receptors on the vascular endothelial cells and within the cerebellar cortex(Reference Zhu, Zhou and Wang11,Reference Brown, Brandl and Wess28) . BP regulation by acetylcholine is diminished in older age. An ex vivo study using the atrium samples of > 70 years old patients showed impaired acetylcholine release(Reference Oberhauser, Schwertfeger and Rutz29). A randomised, cross-over study in middle-age and older adults also showed that endothelium-dependent dilation improvement was associated with increasing doses of acetylcholine(Reference Jablonski, Racine and Geolfos30). The BP-regulating role of acetylcholine may be translated into a greater need for this metabolite and its choline precursor in older adults.
In addition to being a precursor of acetylcholine, choline is involved in hepatic export of DHA in the form of PC-DHA. DHA is an n-3 unsaturated fatty acid that has been linked to BP and heart rate reduction(Reference Mori, Bao and Burke31,Reference Mori, Watts and Burke32) and decreased cardiovascular risks(Reference Jones, Senanayake and Pu33). PC-DHA is mainly produced using PC derived from the phosphatidylethanolamine N-methyltransferase pathway, which is stimulated by estrogen and diminishes in elderly men and postmenopausal women(Reference Resseguie, Song and Niculescu13,Reference da Costa, Sanders and Fischer34) .
Our study has limitations. First, since older adults constituted a small portion of the total population, and some were excluded by the study’s exclusion criteria, results from our study may not be generalisable to the USA elderly population. Exclusion of a number of participants who reported using antihypertensive medication in the analysis of BP outcomes was necessary, yet this may limit the generalisability of the study results. Second, data from 24-h recalls capture intake at a particular time point and contain large within-person variation, which could over- or under-estimate true intake. Combination of dietary and supplemental intake in the 24-h recalls may result in multimodal distribution and may partially explain the null associations between total choline and BP. Nonetheless, little is known on the best strategies to estimate total usual intake using 24-h recalls. Third, the inverse association observed in the low BMI group could be due to reverse causality and residual confounding. We had attempted to reduce these biases, but they are inherent to the cross-sectional study design. It is also possible that increased choline intake was associated with higher intake of healthier sources of choline in the lean group and unhealthier or standard American diet-type sources in the higher BMI groups. Further randomised controlled trials are needed to investigate the cause–effect relationship.
In summary, associations of choline intake with BP and hypertension prevalence among older adults surveyed in the cross-sectional 2011–2014 NHANES depend on BMI and comorbidity status of individuals. Choline intake is not associated with SBP and tended to be inversely associated with hypertension odds in the underweight group. Our observations also suggest that choline intake may be inversely associated with hypertension or BP in healthy older adults while null or positive associations may be observed in those with existing risks. This study highlights the influence of health–disease profiles of individuals in diet–disease relationships.
Acknowledgements
We acknowledge assistance from the Faculty of Agro-Industry, Chiang Mai University.
This study was supported by the Young Faculty Research Grant, Faculty of Agro-Industry, Chiang Mai, Thailand. The funder had no role in the design, analysis or writing of this article.
S. T. and W. J. designed research; S. T. and P. T. conducted research and analysed data; S. T., A. B. G., W. J., J. K. and N. L. wrote the paper; S. T. had primary responsibility for final content and all authors: read and approved the final manuscript.
There are no conflicts of interest.
Supplementary material
For supplementary material/s referred to in this article, please visit https://doi.org/10.1017/S0007114521003068


