

The election of President Donald Trump in November 2016 marked an important transition for the American political system. The unconventional style and tactics of the newly elected president departed strongly from more traditional campaign techniques used by both Republicans and Democrats thus far. For electoral scholars, the communication style of candidate Trump posed fundamental challenges because the antagonistic tone of his campaign rhetoric went far beyond what hitherto was deemed acceptable (Mutz Reference Mutz2015). Trump’s nomination as the Republican candidate already was considered a challenge to some core theories of political science (Azari Reference Azari2016; MacWilliams Reference MacWilliams2016), and the same holds for his election as president.
This article investigates the effect that this rhetoric might have had on individual voters: Was it associated with a different type of voting behavior than what has been observed in earlier US electoral studies? More specifically, we build on European protest and extreme-right–voting research, which has shown that racist resentment and anti-immigrant sentiments are an important voting motive (Lubbers, Gijsberts, and Scheepers Reference Lubbers, Gijsberts and Scheepers2002).
EXPANDING THE “MICHIGAN” MODEL: PROTEST VOTING, RACIST RESENTMENT, AND ANTI-IMMIGRANT SENTIMENTS
Traditionally, vote-choice models are based on the assumption that both long- and short-term factors affect the vote choice. Models that explain voting behavior tend to include long-term variables such as sociodemographic factors, partisanship, and ideology, as well as short-term variables such as issues and candidate evaluations (Campbell et al. Reference Campbell, Converse, Miller and Stokes1980; Miller and Shanks Reference Miller and Merrill Shanks1996). It has been found that basic sociodemographic characteristics including ethnicity, gender, age, and religion are systematically associated with citizens’ party choices (Ansolabehere, Persily, and Stewart III Reference Ansolabehere, Persily and Stewart2010). Furthermore, scholars of class voting have offered evidence of an association between class position and electoral preferences (Brooks and Manza Reference Brooks and Manza1997). In addition, it is well known that voters’ ideological positions, as well as their partisan identity, guide their electoral choices (Bartels Reference Bartels2000; Jacoby Reference Jacoby2009; Joesten and Stone Reference Joesten and Stone2014). Finally, there is abundant evidence that short-term factors including economic evaluations, issue positions, and candidates’ characteristics significantly affect the choices that voters make (Fridkin and Kenney Reference Fridkin and Kenney2011; Nadeau and Lewis-Beck Reference Nadeau and Lewis-Beck2001).
Although ideology and a broad set of issues have their place in the Michigan model of vote choice, the focus of work in this tradition has been mostly on a single liberal–conservative ideological dimension (Joesten and Stone Reference Joesten and Stone2014; see Klar Reference Klar2014 for a multidimensional approach to studying ideology). However, the literature on protest voting and the increasing importance of what are referred to as “new electoral cleavages” pose a challenge to this approach. Hernandez and Kriesi (Reference Hernandez and Kriesi2016), for example, claimed that electoral behavior now is largely determined by new social cleavages, such as concerns about the social and cultural consequences of globalization. The main idea is that the cultural and psychological impact of the feeling of threat is so pervasive that more traditional socioeconomic interests are dwarfed as voting motives. This leads to a choice that is largely determined by anti-immigrant sentiments and racial resentment.
There is an ongoing debate in the literature on how both of these attitudes should be conceptualized and operationalized. In most of the European-based literature, we observe an emphasis on anti-immigrant sentiments (Cutts, Ford, and Goodwin Reference Cutts, Ford and Goodwin2011). For US-based research, most of the literature traditionally is focused on racist resentment toward ethnic minority groups, and this form of racism is considered most salient (Knuckey and Kim Reference Knuckey and Kim2015). It is well known that during the 2016 presidential campaign, virulent rhetoric was reserved for immigrant groups, which were conveniently summarized as “Mexicans.” Currently, it is not known whether this rhetoric had an impact on voting behavior. To investigate this, we included measurements for both racist resentment and anti-immigrant sentiments.
Furthermore, across liberal democracies, there is a trend toward more protest voting (Hernandez and Kriesi Reference Hernandez and Kriesi2016). The hostile attitudes toward the political elite are considered a defining element of protest voting (Moffit Reference Moffit2016; Mudde and Kaltwasser Reference Mudde and Kaltwasser2012; Rooduijn Reference Rooduijn2014), and it is likely that the rhetoric of candidate Trump against the Washington (DC) power elite is completely in line with this assumption. This attitude is generally considered one of the most defining elements of protest voting, and it is captured most convincingly by including a measurement of trust in political institutions (Hooghe and Dassonneville Reference Hooghe and Dassonneville2018).
The virulent attacks that Trump directed against “Mexican immigrants” during the campaign are an interesting development. It leads to the question of whether traditional racism indicators can capture this specific sentiment directed not toward current US citizens but rather toward newly arriving immigrants.
A recurring element of protest voting, however, is that the unity of the people is threatened not only by the political elite but also by the influx of minority groups. This negative attitude toward outsider groups, therefore, could have a significant effect on protest voting. Previous research has shown that racist resentment remains an important voting motive, which had a negative effect on support for Barack Obama in 2008 (Block and Onwunli Reference Block and Onwunli2010; Piston Reference Piston2010). The virulent attacks that Trump directed against “Mexican immigrants” during the campaign are an interesting development. It leads to the question of whether traditional racism indicators can capture this specific sentiment directed not toward current US citizens but rather toward newly arriving immigrants. These attacks might suggest an appeal to anti-immigrant sentiments rather than to the notion of racism. In European social science research, the concept of anti-immigrant sentiments is well established. In addition to being a stable and cross-culturally equivalent measurement scale, anti-immigrant sentiments are highly effective in explaining an extreme-right vote (Cutts, Ford, and Goodwin Reference Cutts, Ford and Goodwin2011; Semyonov, Raijman, and Gorodzeisky Reference Semyonov, Raijman and Gorodzeisky2006). Included in this article is a measurement of both racist resentment and anti-immigrant sentiments to assess which attitude had the strongest effect on a Trump vote.
The main goal of this article was to determine how we can explain a vote for Trump and to what extent traditional vote-choice models help us to understand this preference. We also investigated the importance of these issues among different partisan groups. It is well known that partisan attachments strongly shape voting behavior (Bartels Reference Bartels2000). As a result, partisans tend to consistently vote for “their” party as a form of loyalty. In contrast, independents may give more weight to the issue positions of parties and candidates. To obtain an accurate assessment of the impact of political trust or anti-immigrant sentiments on the outcome of elections, it was important that we verified their effect among independents and leaners. Distinguishing the effects of these variables between Democratic and Republican partisans allowed us to verify the extent to which protest attitudes and attitudes toward ethnic minorities and immigrants were wedge issues in this election (Hillygus and Shields Reference Hillygus and Shields2014).
DATA AND METHODS
We investigated these questions using the 2016 Cooperative Congressional Election Study (CCES).Footnote 1 Although the core module of the CCES includes data on more than 64,000 respondents, we focused on a subsample of 1,000 respondents who took part in a module that included questions on political trust and anti-immigrant sentiments. The 2016 CCES consisted of pre-election and post-election surveys. Because we were interested in determinants of the vote choice, we restricted our analyses to respondents who participated in both surveys.Footnote 2
Because we wanted to explain voting for Trump, we operationalized the vote choice as a dichotomous variable. We distinguished between respondents who indicated that they voted for Trump and those who voted for another candidate.Footnote 3 Given the small number of abstainers in the dataset, we excluded those who indicated that they did not vote. We verified, however, whether our results were robust in estimating a multinomial logit model in which we distinguished among voting for Trump, voting for another candidate, and abstaining from voting (see appendix 1). These alternative operationalizations demonstrate that our findings were robust.
For measuring attitudes leading to protest voting, we included political trust as well as satisfaction with democracy. Political trust was measured by means of three questions that asked about the level of trust in Congress, politicians, and parties on a scale from 0 (no trust at all) to 10 (complete trust). Because these three questions load strongly on a single factor (i.e., Eigenvalue = 2.14, Cronbach’s α = 0.89), we included a single sum-scale of political trust that ranged between 0 and 10. The upper-left panel in figure 1 clarifies that levels of political trust in the estimation sample were low (i.e., mean value of 2.57). Satisfaction with democracy was measured with a single question asking how satisfied respondents were with the way democracy works in the United States. Respondents were asked to indicate their level of satisfaction on a scale from 0 (extremely dissatisfied) to 10 (extremely satisfied). The mean reported level of satisfaction with democracy was 4.66 (see the upper-right panel in figure 1).
Distribution of Key Independent Variables
Note: Distribution of political-trust scale (upper-left panel), satisfaction with democracy (upper-right panel), anti-immigrant–sentiments scale (lower-left panel), and racist resentment (lower-right panel) in estimation sample (N = 665). Black lines indicate the curve of a normal distribution. Source: 2016 CCES Survey.
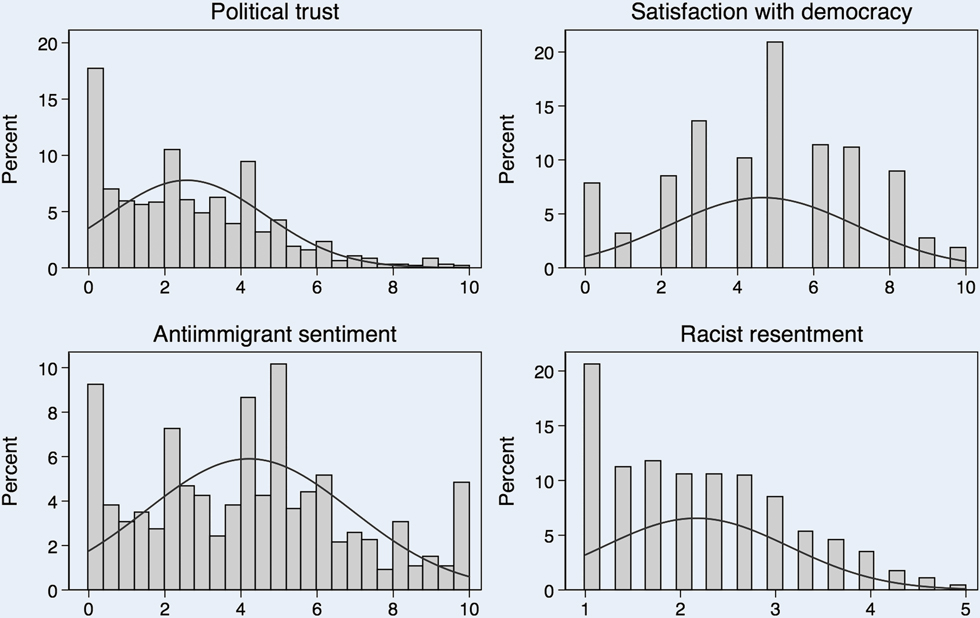
To measure anti-immigrant sentiments, we relied on three survey questions that asked respondents to indicate the impact of immigration on the economy, cultural life, and life in general in the United States (Semyonov, Raijman, and Gorodzeisky Reference Semyonov, Raijman and Gorodzeisky2006). Each question was measured using a 0-to-10 scale, in which higher values indicated a more positive attitude toward immigration.Footnote 4 These three questions proved to be one-dimensional (i.e., Eigenvalue = 2.34, Cronbach’s α = 0.93), which allowed us to construct a single indicator of anti-immigrant sentiments: a 0-to-10 sum-scale of the three questions. To facilitate interpretation of the results, we reversed the coding so that higher values corresponded to stronger anti-immigrant sentiments. The lower-left panel in figure 1 shows that the variable is slightly skewed to the left (i.e., the mean value is 4.20).
In addition, we controlled for respondents’ racist resentment. Racial-resentment scales tend to assess to what extent respondents minimize the occurrence of racist prejudice, downplaying the need for various forms of affirmative action. Kinder and Sanders (Reference Kinder and Sanders1996) proposed a much-used scale, but it has been criticized because of its emphasis on the African American community. Neville et al. (Reference Neville, Lilly, Duran, Lee and Browne2000) therefore proposed a color-blind scale that does not refer to any specific group. This scale is routinely used in social psychology and also was included in the 2016 CCES questionnaire. We used this measure and included a sum-scale of respondents’ answers to three questions: “I am angry that racism exists”; “White people in the US have certain advantages because of the color of their skin”; and “Racial problems in the US are rare, isolated situations.” Respondents indicated on a 5-point scale (from strongly disagree to strongly agree) the extent to which they agreed with these statements. We coded answers to these questions such that higher values signified more-racist resentment. The three questions form a single dimension (i.e., Eigenvalue = 1.84, Cronbach’s α = 0.67). The factor analysis thus suggests a one-dimensional concept, which is in line with other routinely used operationalizations of the concept of racial resentment. We acknowledge, however, that our reliance on somewhat different measures compared to previous work on racism in the United States implies that caution is necessary when interpreting our findings.
We estimated multivariate models and added controls for age, gender, level of education, income, and race. We also included controls for reported ideological self-placement on a liberal–conservative scale as well as partisanship (using a 7-point scale). Finally, we included respondents’ economic evaluations, for which we relied on a traditional retrospective and sociotropic item. To increase the comparability of the coefficient estimates, we rescaled all of the independent variables (except age) to run from 0 to 1. More information on question wording and coding is provided in appendix 2.
RESULTS
Table 1 summarizes the results from a series of multivariate logistic regression models that explain voting for Trump in 2016. In the first model, we included only the variables traditionally included to explain voting behavior in US presidential elections. This model explains the vote choice quite well: partisanship, self-placement on the liberal–conservative dimension, and assessment of the state of the economy were important determinants. When considering these variables, voters’ sociodemographic characteristics did not appear to strongly affect vote choice. The exception was race: we found that black voters were significantly less likely to vote for Trump than whites. It is interesting that the same did not hold for Hispanic voters in our sample; however, the included number of Latino voters was small. Gender also did not have a significant effect, despite the various issues that arose during the election campaign.Footnote 5
Explaining the Trump Vote
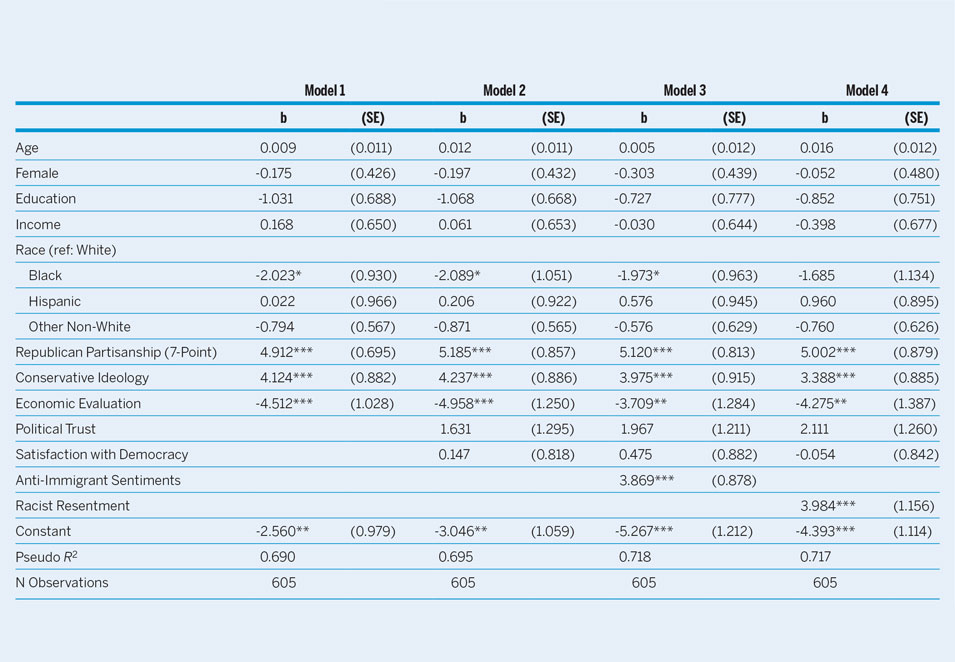
Notes: Estimates from logistic regression model that explains voting for Trump (=1) versus Clinton, Stein, Johnson, or another candidate (=0). Abstainers are excluded from the analyses. Logistic regression coefficients and standard errors (in parentheses) are reported. Significance levels: * p < 0.05, ** p < 0.01, *** p < 0.001. Data are weighted to reflect the characteristics of the national electorate. Source: 2016 CCES Survey.
In models 2 through 4, we included the variables crucial in the literature on protest voting and new social cleavages. In model 2, we added the indicators of political trust and satisfaction with democracy. As shown in the results in table 1, neither trust in political institutions nor satisfaction with democracy were significant predictors of vote choice.
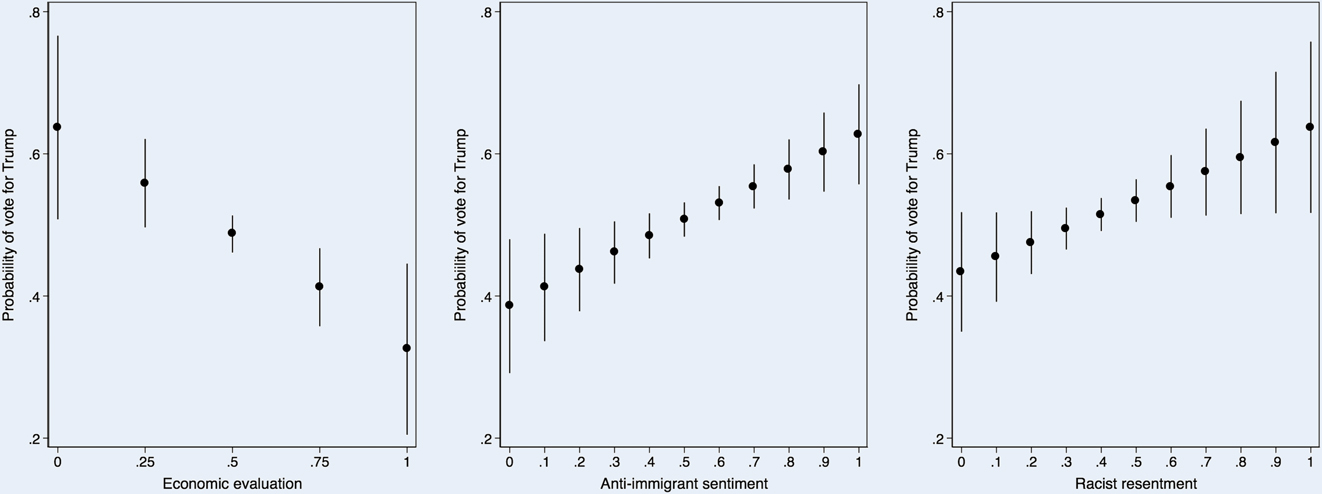
In models 3 and 4, we added anti-immigrant sentiments and racism indicators, respectively.Footnote 6 Both were observed as strong and highly significant predictors of the Trump vote. Both variables appear to have had essentially the same effect, and they added approximately the same predictive power (in terms of the pseudo-RFootnote 2) to the model. Figure 2 shows the estimated predicted probability of voting for Trump (versus another candidate) for different values of the main independent variables in our analyses, further clarifying the comparable impact of both indicators. In addition, figure 2 shows that the impact of these variables was fairly similar to the impact of respondents’ economic evaluations—a key indicator in most vote-choice models in a US context.
Predicted Probability of Voting for Trump by Economic Evaluation, Anti-Immigrant Sentiments, and Racist Resentment
Note: Estimated probability of voting for Trump (versus another candidate) at varying levels of economic evaluations (left panel), anti-immigrant sentiments (middle panel), and racist resentment (right panel). Estimates obtained from model 3 (i.e., economic evaluations and anti-immigrant sentiment) and model 4 (i.e., racist resentment) in table 1.
Previous research indicates that it is not always possible to measure racist resentment and anti-immigrant sentiments in a straightforward manner among respondents who are members of an ethnic minority. Therefore, we also estimated models 3 and 4 on a subsample of only non-Hispanic white respondents; we found the same results (see appendix 3).
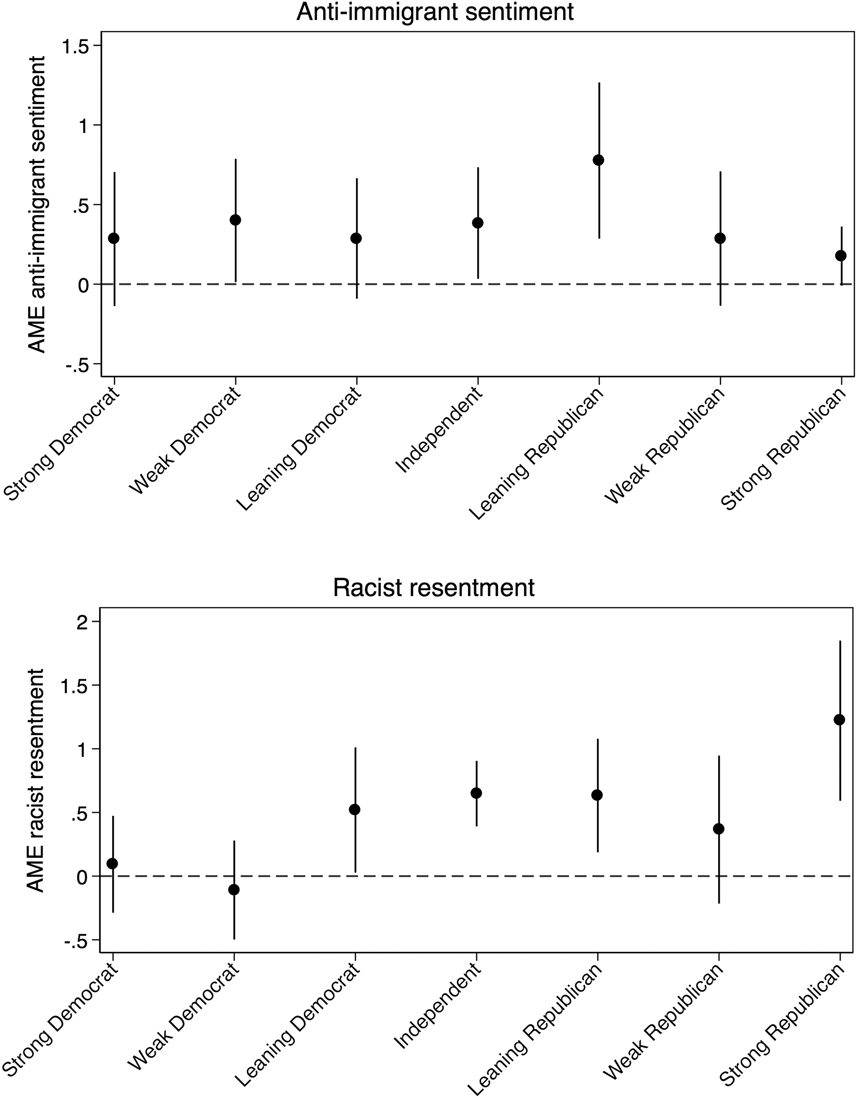
Dividing respondents according to their level of partisanship, it became clear that anti-immigrant sentiments strongly affected the choice of leaning Republicans, whereas racist resentment significantly influenced the vote choice of strong Republicans.
In the next step, we evaluated whether the impact of these values was conditional on partisanship. We expected that the effect of anti-immigrant sentiments and racist resentment would be most pronounced among independents. To verify whether this was the case, we reestimated models 3 and 4 in table 1 but included the 7-point partisanship variable as a categorical variable (rather than treating it as a continuous variable). We also added interaction terms between the partisanship categories and anti-immigrant sentiments or racist resentment, respectively. The full results of these analyses are in appendix 4. Figure 3 summarizes the average marginal effect of anti-immigrant sentiments (upper panel) and racist resentment (lower panel) on voting for Trump for different partisan groups. Dividing respondents according to their level of partisanship, it became clear that anti-immigrant sentiments strongly affected the choice of leaning Republicans, whereas racist resentment significantly influenced the vote choice of strong Republicans. Overall, however, most noteworthy is the overall stability of the average marginal effects of anti-immigrant sentiments and racist resentment among different partisan groups. The significant similarities among different groups suggest that immigration and racism functioned to some extent as wedge issues in the 2016 presidential election. Anti-immigrant sentiments and racist resentment affected not only the vote choices of Republicans but also those of Democratic identifiers. This suggests that if these voters were cross-pressured—that is, feeling closer to the Democratic Party but having more anti-immigrant sentiments or more racist resentment—these attitudes might have led them to vote for Trump.
Effects of Anti-Immigrant Sentiments and Racist Resentment on the Probability to Vote for Trump by Partisan Identity
Note: Estimates are average marginal effects; 95% confidence intervals are reported. Estimates obtained from model 1 (upper panel) and model 2 (lower panel) are in appendix 4. Source: Vavreck and Rivers Reference Vavreck and Rivers2008.
DISCUSSION
The results of our analyses demonstrated that it is too easy to consider Trump to be anti-establishment candidate, at least with regard to the voting motives of his supporters. Although we operationalized political trust and political support in two different ways, in not a single model was this a significant voting motive. Although the rhetoric about “draining the swamp” (of bureaucracy in Washington, DC) received ample media attention, our analysis suggests that it was not a major voting motive for Trump voters. Theoretically, this is important because the literature on protest voting (and populism) states that a hostile attitude toward the political elite functions as a major voting motive for populist parties (Moffit Reference Moffit2016; Rooduijn Reference Rooduijn2014). Trump voters did not follow this pattern; therefore, it would be incorrect to state that the Trump election fits this general pattern of protest voting.
Furthermore, our analyses show evidence of the enduring strength of partisanship in US politics. Despite the fact that Donald Trump could be considered an ideologically extreme candidate—with personal positions that often were at odds with the official position of the Republican Party—considerations of partisanship continued to play an important role as a voting motive. Even in these conditions, most partisans followed the lead of their party. However, even among Democratic supporters, we observed a significant effect of racist resentment and anti-immigrant sentiments.
The most important finding of the analysis, however, is that racism—regardless of how it was measured—appears to have been an important motive in voting for Trump. As such, this is not a new finding because we know that, indeed, in 2008 Barack Obama suffered from a lack of support among racist voters (Lewis-Beck, Tien, and Nadeau Reference Lewis-Beck, Tien and Nadeau2010). The 2016 campaign, however, demonstrated that the effect of racism is not only present when voters have a choice among candidates with different ethnic backgrounds. The ideological positions and the rhetoric of the candidate clearly matter as well. In this specific election, negative attitudes toward ethnic minorities and immigrants swayed independents and some Democrats to opt for candidate Trump, thereby considerably strengthening his electoral-support base.
SUPPLEMENTARY MATERIAL
To view supplementary material for this article, please visit https://doi.org/10.1017/S1049096518000367
ACKNOWLEDGMENTS
The authors gratefully acknowledge funding provided by the European Research Council (ERC Advanced Grant 295920, “Democratic Linkage”). Ruth Dassonneville acknowledges support from the Canada Research Chairs program (Grant Number 950-231173).


