


Over the past three decades there has been renewed interest in dietary intake of fish and fish oil, rich in marine-derived long-chain n-3 PUFA, and intense interest has been sparked by epidemiological studies which suggest a favourable effect of fish on CHD(Reference Stone1). Low mortality rate from CHD in epidemiological studies has been reported in populations with high intake of fish, such as Alaskan Natives(Reference Newman, Middaugh and Propst2), Greenland Eskimos(Reference Kromann and Green3) and Japanese residing in fishing villages(Reference Hirai, Hamazaki and Terano4). However, not all prospective cohort studies have found an inverse association between fish consumption and fatal CHD(Reference Oomen, Feskens and Rasanen5–Reference Iso, Kobayashi and Ishihara7). In addition, clinical trials of fish or fish oil in patients with CHD did not corroborate early observational findings(Reference Yokoyama, Origasa and Matsuzaki8, Reference Burr, Ashfield-Watt and Dunstan9).
In 2004, two meta-analyses(Reference He, Song and Daviglus10, Reference Whelton, He and Whelton11), which pooled all available cohort data at that time, reported significant inverse associations between fish consumption and fatal CHD. A consistent result was achieved in a quantitative analysis regarding this issue in 2005(Reference Konig, Bouzan and Cohen12). However, stratified analyses in these meta-analyses were limited and could not help explain the heterogeneity. In addition, among several(Reference Iso, Kobayashi and Ishihara7, Reference Folsom and Demissie13–Reference Manger, Strand and Ebbing20) recently published cohort studies, most(Reference Iso, Kobayashi and Ishihara7, Reference Folsom and Demissie13, Reference Yamagishi, Iso and Date15, Reference Streppel, Ocke and Boshuizen17, Reference Nakamura, Ueshima and Okamura18, Reference Manger, Strand and Ebbing20) of them showed no statistically significant inverse association between fish intake and CHD mortality. Therefore, these results to date are still inconsistent and more detailed stratified analyses need to be done to find the potential heterogeneity. As a result, it is necessary to update the meta-analysis with relevant cohort studies in relation to fish consumption and CHD mortality.
The objective of the present study was to investigate the association between fish consumption and fatal CHD with published, up-to-date cohort studies. In addition, dose–response analysis was conducted to get trend estimation and subgroup analyses were conducted to examine sources of heterogeneity.
Methods
Selection of studies
We conducted a literature search in PubMed and ISI Web of Science up to September 2010 for all relevant papers published. Key words included ‘fishes’, ‘fish oils’, ‘seafood’, ‘omega-3’ or ‘fatty acids’ in combination with ‘coronary disease’ or ‘myocardial infarction’ (as Medical Subject Headings or text words) for the PubMed search. For the ISI Web of Science search, terms used as topic search included ‘fish’, ‘fish oil’, ‘seafood’, ‘omega-3 fatty acids’, ‘n-3 fatty acid’ or ‘polyunsaturated fatty acid’ in combination with ‘cardiovascular disease’, ‘fatal coronary heart disease’, ‘fatal myocardial infarction’ or ‘CHD’. Furthermore, references from the retrieved articles were reviewed to make sure that all the relevant bibliographies published were reviewed. Our search was confined to English-language journals only.
Two of the authors (J.Z. and T.H.) conducted the search independently. Discrepancies were resolved through group discussion. The following inclusion criteria were used in our meta-analysis: (i) studies were restricted to prospective cohort study design; (ii) risk estimates (relative risk (RR) or hazard ratio (HR)) with their corresponding 95 % confidence interval of CHD mortality rate for each category of fish consumption were provided; and (iii) if cohorts were duplicated in more than one study, the most recent and complete study (most detailed category classification) was included.
We excluded studies if: (i) cross-sectional, case–control or experimental designs were used; (ii) the outcome was not fatal CHD; (iii) there were only two fish intake categories; and (iv) the reference group was not the lowest fish intake category or the reference fish intake category was too high to be comparable with other studies.
Data extraction
We collected the following data from each publication: the first author's name, year of publication, country of origin, range or mean of participants’ age, duration of follow-up, gender, sample size, number of events for each fish consumption category, person-years for each fish consumption category, adjusted covariates, methods of outcome assessment, methods of dietary assessment, categories of fish consumption and their corresponding RR or HR with their 95 % CI for CHD mortality. We extracted the greatest degree of adjusted risk estimates from each study.
Statistical analysis
We standardized and categorized the fish consumption into four groups based on the fish intake frequency: (i) high (>5 servings/week); (ii) moderate (2–4 servings/week); (iii) low (1 serving/week); and (iv) very low (comparison group; <1 serving/month or 1–3 servings/month). If a study contained categories of both <1 serving/month and 1–3 servings/month, we chose the previous category as the very low group. We assigned each RR from included studies into its corresponding group. If more than one fish intake category fell into the same group of our meta-analysis, we combined the RR with inverse variance weights and conducted a sensitivity analysis to examine the influence of these studies (two in low fish intake group, six in moderate fish intake group). For the present meta-analysis, RR were used as the common risk assessment measurement and HR were considered as RR directly. RR from each study was transformed to its natural logarithm and the 95 % CI was used to calculate the corresponding standard error. Combined RR was used in a study if it presented RR with multiple outcomes or multiple exposures(Reference Yuan, Ross and Gao21, Reference Mozaffarian, Lemaitre and Kuller22). The combined RR were weighted by the inverse of their variances.
All meta-analyses as well as the dose–response analysis were conducted using the STATA statistical software package version 11 (StataCorp LP, College Station, TX, USA). For dose–response analysis, we used the method described by Greenland and Longnecker(Reference Greenland and Longnecker23) and Orsini et al. (Reference Orsini, Bellocco and Greenland24) to get study-specific slopes and 95 % CI from the natural logarithms of the RR and CI across categories of fish intake (nine studies). Amount of fish consumption, RR, 95 % CI and distribution of cases and person-years/non-cases in each included study should be extracted according to this method; the GLST command in STATA was used to estimate the dose–response association. If the distribution of cases and person-years/non-cases was not provided, slopes were estimated using variance-weighted least-squares regression (eight studies) and the VWLS command was used accordingly. The median or mean amount of fish consumption in each category was used for the dose–response analysis. The midpoint of upper and lower boundaries was considered as the dose of each category if the study reported only the range of fish consumption. If the highest category was open-ended, we regarded it as of the same amplitude as the preceding one. The lowest boundary was set to zero if the lowest category was open. If studies reported fish consumption using servings of fish per day, we transferred the fish amount to gram level according to the description of the study. If there was no portion size description, we deemed it to be 105 g/serving according to He et al.(Reference He, Song and Daviglus10). To assess for potential curvilinear relation, restricted cubic splines (three knots) were used to flexibly model and graph the RR(Reference Harrell, Lee and Pollock25), and the MKSPLINE command, which is used for linear and restricted cubic spline construction in STATA, was chosen.
To obtain a pooled RR and its 95 % CI, log RR were weighted by the inverses of their variances. A random-effects model which takes into account both within- and between-study variability was used to combine the studies. We assessed statistical heterogeneity with the Q and I 2 statistics(Reference Higgins, Thompson and Deeks26). I 2 values of 25 %, 50 % and 75 % correspond to cut-off points for low, moderate and high degrees of heterogeneity, respectively.
If heterogeneity was presented, we conducted meta-regression with study population (non-US v. US), method of dietary assessment (interview v. self-administered questionnaire) and energy adjustment (yes v. no) to explore the sources of heterogeneity. Stratified analyses regarding the study region, dietary assessment, gender, follow-up period, publication year and energy adjustment were also conducted to further examine potential heterogeneity sources. A sensitivity analysis in which one study at a time was excluded was done to evaluate the effect of an individual study on the result. Funnel plots was used to assess the publication bias and Egger's regression test to determine funnel plot asymmetry(Reference Egger, Smith and Schneider27). P < 0·10 was deemed to possess publication bias. To identify and correct for funnel plot asymmetry arising from publication bias, the trim and fill algorithm was used(Reference Duval and Tweedie28). RR of excluded studies with only two fish intake categories (yes v. no) or studies in which the reference group was not the lowest fish intake group (highest v. reference) were pooled to examine the impact of these excluded studies on the overall conclusions.
Results
Search results and study characteristics
Figure 1 presents the detailed selection process. We identified twenty-nine potential studies(Reference Oomen, Feskens and Rasanen5–Reference Iso, Kobayashi and Ishihara7, Reference Folsom and Demissie13–Reference Mozaffarian, Lemaitre and Kuller22, Reference Curb and Reed29–Reference Zhang, Woo and Heller44). Seven studies(Reference Curb and Reed29, Reference Shekelle, Missell and Paul31–Reference Norell, Ahlbom and Feychting33, Reference Salonen, Nyyssonen and Salonen37, Reference Meng, Wilkens and Kolonel43, Reference Zhang, Woo and Heller44) were excluded because of their incomplete information on RR estimation or fish intake. Two studies(Reference Nakamura, Ueshima and Okamura18, Reference Osler, Andreasen and Hoidrup42) were excluded because the reference group was not the lowest exposure group. Two studies(Reference Iso, Kobayashi and Ishihara7, Reference Manger, Strand and Ebbing20) were excluded because their reference fish intake categories were extremely high compared with other studies. One study(Reference Fraser, Sabate and Beeson34) possessing a greatly different CHD baseline risk compared with the risk for the general population was ruled out. Three studies(Reference Streppel, Ocke and Boshuizen17, Reference Kromhout, Feskens and Bowles36, Reference Rodriguez, Sharp and Abbott38) containing only two categories of fish consumption were excluded. One study(Reference Oomen, Feskens and Rasanen5) which contained populations from three different regions was regarded as three independent cohort studies. Two studies(Reference Järvinen, Knekt and Rissanen14, Reference Kromhout, Feskens and Bowles36) which provided the data of men and women separately were recognized as two different cohort studies respectively. Thus our meta-analysis included fourteen articles with seventeen independent cohort studies.
Flowchart of the study selection process

Table 1 shows part of the information extracted from the included studies, which contained 4472 cases among 315 812 participants. The duration of follow-up ranged from 6 years reported by Ascherio et al.(Reference Ascherio, Rimm and Stampfer35) to 30 years reported by Daviglus et al.(Reference Daviglus, Stamler and Orencia39). Our meta-analysis included seventeen cohorts (seven from the USA, two from Asia and eight from Europe). Overall, eight cohorts used a self-administered questionnaire, while nine cohorts used an interview. Seven cohorts in six studies(Reference Iso, Kobayashi and Ishihara7, Reference Folsom and Demissie13–Reference de Goede, Geleijnse and Boer16, Reference Tomasallo, Anderson and Haughwout19) (from 2004 to 2010) were published recently and so not included in previous meta-analyses(Reference He, Song and Daviglus10, Reference Whelton, He and Whelton11).
Characteristics of cohort studies included in the meta-analysis of fish consumption and CHD mortality
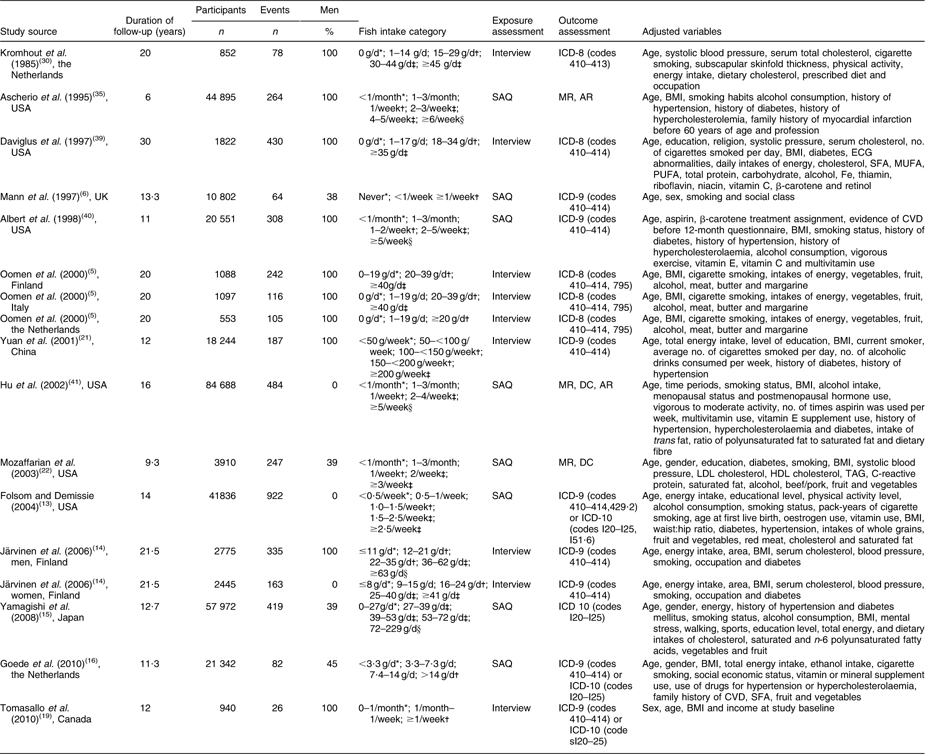
SAQ, self-administered questionnaire; ICD, International Classification of Diseases; MR, medical records; AR, autopsy report; DC, death certificate; ECG, electrocardiogram.
*Categories used as the very low fish consumption group (comparison group) in the meta-analysis.
†Categories used as the low fish consumption group in the meta-analysis.
‡Categories used as the moderate fish consumption group in the meta-analysis.
§Categories used as the high fish consumption group in the meta-analysis.
Pooled effect estimates of fish consumption on fatal CHD
Pooled RR of CHD mortality in connection with low fish consumption (1 serving/week; sixteen studies included) indicated that individuals consumed 1 serving/week had a significant lower RR of CHD mortality compared with those who consumed fish less than 1 serving/month or 1–3 servings/month (RR = 0·84; 95 % CI 0·75, 0·95; Fig. 2); slight heterogeneity was observed among studies (P = 0·225, I 2 = 20·1 %) and exclusion of studies in which more than one category fell into the low fish consumption group did not markedly change the result (RR = 0·83; 95 % CI 0·74, 0·94). Moderate fish consumption (2–4 serving/week; thirteen studies included) had lower CHD mortality by 21 % (RR = 0·79; 95 % CI 0·67, 0·92; Fig. 3) compared with the very low fish consumption; significant heterogeneity was found among studies (P = 0·006, I 2 = 56·7 %) and exclusion of studies in which more than one category fell into the moderate fish consumption group did not change the result significantly (RR = 0·80; 95 % CI 0·62, 1·03). High fish consumption (>5 serving/week; five studies included) had a marginally protective effect on fatal CHD (RR = 0·83; 95 % CI 0·68, 1·01; Fig. 4); no heterogeneity was found (P = 0·451, I 2 = 0).
(colour online) Pooled relative risk (RR) and 95 % CI of studies assessing the association between low fish consumption (1 serving/week) and CHD mortality. Grey square represents the adjusted RR in each study, with the square size reflecting the study-specific weight and the 95 % CI represented by horizontal bars. Open diamond indicates the pooled risk estimate and its corresponding 95 % CI

(colour online) Pooled relative risk (RR) and 95 % CI of studies assessing the association between moderate fish consumption (2–4 servings/week) and CHD mortality. Grey square represents the adjusted RR in each study, with the square size reflecting the study-specific weight and the 95 % CI represented by horizontal bars. Open diamond indicates the pooled risk estimate and its corresponding 95 % CI

(colour online) Pooled relative risk (RR) and 95 % CI of studies assessing the association between high fish consumption (>5 servings/week) and CHD mortality. Grey square represents the adjusted RR in each study, with the square size reflecting the study-specific weight and the 95 % CI represented by horizontal bars. Open diamond indicates the pooled risk estimate and its corresponding 95 % CI

For dose–response analysis, every 15 g/d increase of fish intake led to a significant reduction by 6 % (RR = 0·94; 95 % CI 0·90, 0·98) for fatal CHD (Fig. 5). However, restricted cubic splines (Fig. 6) found some evidence of a non-linear association (P value for linearity = 0·01).
(colour online) Pooled relative risk (RR) and 95 % CI of studies assessing the association between an increment of 15 g/d fish consumption and CHD mortality. Grey square represents the adjusted RR in each study, with the square size reflecting the study-specific weight and the 95 % CI represented by horizontal bars. Open diamond indicates the pooled risk estimate and its corresponding 95 % CI

Dose–response relationship between fish consumption (g/d) and CHD mortality with a restricted cubic spline model. The grey shaded area represents the 95 % confidence limits for the fitted curve (RR, relative risk)

Excluded cohort studies with only two fish consumption categories or studies in which the reference group was not the lowest fish consumption category

RR, relative risk; SAQ, self-administered questionnaire; ICD, International Classification of Diseases; MR, medical records; DC, death certificate.
Stratified analyses and publication bias diagnostics
Stratified analyses were conducted to examine the sources of heterogeneity for low and moderate fish consumption, as shown in Table 3. For low and moderate fish consumption, pooled RR of studies conducted in the USA were 0·81 (95 % CI 0·70, 0·93) and 0·80 (95 % CI 0·70, 0·93) and consistent with the overall RR, while the heterogeneity was greatly reduced for both. The method of dietary assessment also affected the results. For moderate fish consumption, studies conducted by in-person interview shared a stronger inverse association (RR = 0·71; 95 % CI 0·53, 0·96) compared with self-administered questionnaire (RR = 0·91; 95 % CI 0·81, 1·02); however, the heterogeneity was greatly reduced for self-administered questionnaire (I 2 = 23·1 %) compared with in-person interview (I 2 = 67·6 %). Pooled RR estimate of fatal CHD among females was more evident than that of males for low fish consumption but not for moderate fish consumption. Pooled RR estimate of fatal CHD of studies with no energy adjustment was more evident than that with energy adjustment for both fish consumption models. For moderate model, the heterogeneity was reduced to be 0 for studies with no energy adjustment.
Stratified pooled risk estimates and 95 % confidence intervals for low (1 serving/week) and moderate (2–4 servings/week) fish consumption and CHD mortality

RR, relative risk.
Pooled results of meta-regression indicated that none of the items used was a major contributor to the identified heterogeneity. Sensitivity analysis showed no significant change by excluding any study. For the low fish consumption model, visualization of the funnel plot (Fig. 7) and Egger's test (P = 0·265) indicated no publication bias. For the moderate fish consumption model, visualization of the funnel plot (Fig. 8) and Egger's test (P = 0·018) indicated publication bias and the pooled RR remained unchanged using the trim and fill method. The pooled RR of excluded studies with only two fish intake categories was 0·59 (95 % CI 0·44, 0·80) and the significant inverse association still existed after adding another two excluded studies in which the reference was not the lowest fish intake category (RR = 0·69; 95 % CI 0·53, 0·91; Fig. 9).
(colour online) Begg's funnel plot with pseudo 95 % confidence limits indicating the publication bias of the relative risk (RR) assessing the association of low fish consumption (1 serving/week) and CHD mortality. The horizontal line indicates the summary estimate of RR, with the sloping dashed lines representing the expected 95 % CI for a given se

(colour online) Begg's funnel plot with pseudo 95 % confidence limits indicating the publication bias of the relative risk (RR) assessing the association of moderate fish consumption (2–4 servings/week) and CHD mortality. The horizontal line indicates the summary estimate of RR, with the sloping dashed lines representing the expected 95 % CI for a given se

(colour online) Pooled relative risk (RR) and 95 % CI of excluded studies with only two fish intake categories (yes v. no) or studies in which the reference group was not the lowest fish intake category (highest v. reference) in assessing the association between fish consumption and CHD mortality. Grey square represents the adjusted RR in each study, with the square size reflecting the study-specific weight and the 95 % CI represented by horizontal bars. Open diamond indicates the pooled risk estimate and its corresponding 95 % CI

Discussion
The present study was an updated meta-analysis regarding fish consumption and CHD mortality. Its results showed a remarkable inverse association of moderate (2–4 servings/week) and low (1 serving/week) fish consumption with CHD mortality, adding updated information to the previous studies(Reference He, Song and Daviglus10–Reference Konig, Bouzan and Cohen12). The protective effect of fish intake on CHD mortality was much stronger among those who shared the habit of moderate fish consumption (2–4 servings/week) than those who consumed low amounts of fish (1 serving/week). The protective effect of high fish consumption (>5 servings/week) on fatal CHD was much weaker and this might be due to commonly existing contaminants such as methyl mercury in the fish counterbalancing the effect of protective components. Summary RR for different categories of fish exposure did not suggest an apparent linear dose–response relationship, and a possible J-shaped relationship between fish intake and CHD mortality was indicated with restricted cubic splines. Nevertheless there were only limited high fish consumption categories, and the analysis lacked statistical power to get a definite J-shaped relationship; in addition, a linear dose–response analysis showed that every 15 g/d increment of fish consumption lowered CHD mortality by 6 %, which was consistent with previous results reported by He et al. (7 % per 20 g/d increment of fish intake)(Reference He, Song and Daviglus10) and Konig et al. (5·5 % per 20 g/d increment of fish intake)(Reference Konig, Bouzan and Cohen12).
Stratified analyses
For both low and moderate fish consumption models, inverse associations between fish consumption and CHD mortality in the USA were statistically significant compared with Europe where no significant inverse associations were observed; and there was no heterogeneity in the US studies. This might be partially due to the more detailed categorization among American studies that made corresponding fish intake categories more comparable with one another, thus decreasing the heterogeneity. Moreover, the differences between the cohorts may also have contributed to the results: different populations may respond differently to dietary fish rich in n-3 PUFA based on differing genetic backgrounds. Recent emerging data documenting gene–fatty acids interactions for CHD-related traits supported this hypothesis(Reference Tai, Corella and Demissie45). Besides population regions, the method of dietary assessment also affected the pooled RR; for moderate fish consumption, self-administered questionnaire rather than in-person interview reduced the heterogeneity significantly. This is contradictory to the common understanding that in-person interview may reduce the heterogeneity more evidently than self-administered questionnaire, and the reasons are yet to be investigated. Furthermore, for both fish consumption models, summary RR with no energy adjustment were more significant than with energy adjustment. The overall protective effect of fish on fatal CHD might be decreased if all the studies are adjusted for energy. In addition, for low fish consumption, no heterogeneity was observed for studies with only male or female subjects. The more evident protective effect of fish on women might be partially due to the limited studies about women. More studies regarding women are needed to clarify the gender differences.
Advantages and limitations
The present meta-analysis possesses several advantages compared with previous ones. First, as category classification of fish consumption and portion size varied across studies, it was difficult to pool RR based on detailed fish intake between studies; however, our standardization generally unifies the fish consumption categories and gives a clear idea about the impact of fish intake on fatal CHD across different cohorts. Second, compared with the three previous studies(Reference He, Song and Daviglus10–Reference Konig, Bouzan and Cohen12), the present study included more participants, providing updated information about the association between fish intake and CHD mortality. In addition, generalized least-squares regression was used to assess the possible dose–response relationship; this method provided more efficient estimation than weighted linear regression. Furthermore, a possible J-shaped relationship between fish consumption and fatal CHD was found with restricted cubic splines, which adds new information to the previous studies(Reference He, Song and Daviglus10–Reference Konig, Bouzan and Cohen12); however, this relationship is weak due to the limited studies among high fish consumption groups and should be adopted cautiously.
In general, compared with previous meta-analyses, the present study adds more powerful statistical methods to achieve the dose–response analysis and more participants containing updated information on this topic. In addition, more detailed stratified analyses were conducted in our study to examine potential heterogeneity.
Some limitations of the present study should be mentioned. First, cohort studies could not avoid the residual confounding or bias, despite their relatively longer duration and larger sample size. Second, the high fish consumption group (>5 servings/week) contained limited studies (five studies) owing to the fact that many studies possessed only limited fish intake categories, which could not be categorized into the high fish consumption group, and this might be a major limitation of the categorization in the meta-analysis. Third, six of the included studies did not adjust for energy; these studies showed more apparent protective effect, so the overall protective effect of fish on fatal CHD might be overestimated by the including these studies. Fourth, exclusion of studies with only two fish consumption categories or studies in which the reference group was not the lowest fish consumption category might bias our findings (Table 2), as the pooled RR of the excluded studies was more significant than either group of fish intake. Thus the inverse association of fish consumption and CHD mortality might be more significant if these studies could be categorized and included in the present meta-analysis. Fifth, if more than one fish intake category fell into the same group of our meta-analysis, we combined the RR with inverse variance weight. This procedure might lead to overestimation of the precision of the RR estimates; however, for both low and moderate fish consumption groups, our sensitivity analyses did not show any significant changes excluding these studies. In addition, for moderate fish consumption (2–4 servings/week), publication bias (trim and fill method did not change the pooled RR) was found in the meta-analysis and great heterogeneity was also observed; these might be partially due to the relatively wide range of moderate fish consumption (2–4 servings/week). We included papers published only in the English language, which would be the source of our publication bias.
Apart from the above issues, the cooking methods and contaminants (e.g. methyl mercury) of certain types of fish affect the results severely. However, among included studies, few(Reference Oomen, Feskens and Rasanen5, Reference Mozaffarian, Lemaitre and Kuller22) contained information about these issues.
Mechanisms of fish on fatal CHD
It has long been assumed that long-chain n-3 PUFA, including 20 : 5n-3 and 22 : 6n-3, play an important role in the protective effect of fish on CHD risk. The possible mechanisms include their antiarrhythmic properties, reduction of serum TAG(Reference Harris46) and platelet aggregation(Reference von Schacky47). Fish oil may also improve endothelial dysfunction(Reference De Caterina, Liao and Libby48), which is considered an early marker of atherosclerosis. However, considering the synergic effect of many components in fish, such as high-quality protein, amino acid and vitamins, analysis of total fish consumption on CHD is probably more valuable than the sole evaluation of long-chain n-3 PUFA(Reference He49).
Conclusion
In conclusion, fish consumption of 1 serving/week or 2–4 servings/week has a significant protective effect on fatal CHD; fish consumption of >5 servings/week could marginally decrease CHD mortality, but the limited number of studies included in this group might contribute to the result. Our findings support the public dietary guideline to eat fish two times per week.
Acknowledgements
The project was funded by the National Natural Science Foundation of China (grant no. 30972464). There are no conflicts of interest. J.Z. and T.H. carried researched the studies for inclusion in the meta-analysis, extracted and analysed data, and drafted the manuscript; J.Z., T.H. and Y.Y. participated in manuscript preparation; and Y.Y., X.H., Y.B. and D.L. helped with revising the manuscript. The authors would thank Mr Ka He from the Departments of Nutrition and Epidemiology of the University of North Carolina at Chapel Hill for his suggestions and revisions of the draft manuscript.



