


Introduction
Urbanization can increase natural resource use (Güneralp et al., Reference Güneralp, Lwasa, Masundire, Parnell and Seto2017), contradicting previous assumptions that rural depopulation leads to net conservation benefits (Wright & Muller-Landau, Reference Wright and Muller-Landau2006). For instance, in West and Central Africa, population growth and urbanization have increased urban demand for wildmeat, with widespread markets and informal trade negatively affecting wildlife (van Vliet et al., Reference van Vliet, Muhindo, Nyumu and Nasi2019; Luiselli et al., Reference Luiselli, Hema, Segniagbeto, Ouattara, Eniang and Parfait2020). In Peru, wildmeat trade in a large urban market has increased in parallel with urban population growth since 1973 (Mayor et al., Reference Mayor, El Bizri, Morcatty, Moya, Bendayán and Solis2021). Wildmeat demand contributes to defaunation around Amazonian towns (Parry & Peres, Reference Parry and Peres2015; Abrahams et al., Reference Abrahams, Peres and Costa2017), which could compromise the well-being of forest-dependent rural communities (Nasi et al., Reference Nasi, Taber and van Vliet2011). Yet forest dwellers circulate between rural and urban spaces, and urban demand for wildmeat creates income opportunities (van Vliet et al., Reference van Vliet, Cruz, Quiceno-Mesa, Jonhson Neves de Aquino, Moreno, Ribeiro and Fa2015a,Reference van Vliet, Quiceno, Cruz, Jonhson Neves de Aquino, Yagüe and Schorb; Chaves et al., Reference Chaves, Monroe and Sieving2019).
Wildmeat and urbanization in Amazonia
Until recently, urban wildmeat consumption in Amazonia was considered negligible (Nasi et al., Reference Nasi, Taber and van Vliet2011), reflecting a paucity of relevant research. However, emerging evidence shows that most households in provincial Amazonian towns consume terrestrial and aquatic wild species (excluding fish) at least occasionally (Parry et al., Reference Parry, Barlow and Pereira2014; Morsello et al., Reference Morsello, Yagüe, Beltreschi, van Vliet, Adams and Schor2015), and estimates of overall urban consumption in Amazonia number in the thousands of tonnes annually (van Vliet et al., Reference van Vliet, Quiceno-Mesa, Cruz-Antia, Neves de Aquino, Moreno and Nasi2014; El Bizri et al., Reference El Bizri, Morcatty, Valsecchi, Mayor, Ribeiro and Vasconcelos Neto2020b; Chaves et al., Reference Chaves, Valle, Tavares, Morcatty and Wilcove2021a,Reference Chaves, Valle, Tavares, von Muhlen and Wilcoveb).
Most studies attribute urban wildmeat consumption in Amazonia to commercial trade either explicitly (van Vliet et al., Reference van Vliet, Cruz, Quiceno-Mesa, Jonhson Neves de Aquino, Moreno, Ribeiro and Fa2015a,Reference van Vliet, Quiceno, Cruz, Jonhson Neves de Aquino, Yagüe and Schorb; El Bizri et al., Reference El Bizri, Morcatty, Valsecchi, Mayor, Ribeiro and Vasconcelos Neto2020b) or implicitly (Chaves et al., Reference Chaves, Monroe and Sieving2019). However, there is also evidence of non-market acquisition (wildmeat gifts; Morsello et al., Reference Morsello, Yagüe, Beltreschi, van Vliet, Adams and Schor2015; Carignano Torres et al., Reference Carignano Torres, Morsello, Parry and Pardini2021) that contributes to maintaining social relations and meeting food needs (WinklerPrins & de Souza, Reference WinklerPrins and de Souza2005; Nunes et al., Reference Nunes, Guariento, Santos and Fischer2019a).
Rural–urban mobility
Amazonia has undergone rapid but spatially heterogeneous urbanization (Guedes et al., Reference Guedes, Costa and Brondízio2009), with consequences for rural–urban mobility, which concerns the circulation of people (both rural and urban residents), goods and ideas between urban and rural areas (Nasuti et al., Reference Nasuti, Eloy, Raimbert and Le Tourneau2015; Dodd, Reference Dodd2020). Rural–urban mobility could affect livelihoods and natural resource use (Eloy et al., Reference Eloy, Brondizio and Do Pateo2015). Many rural–urban migrants in Amazonia circulate between both areas, thus retaining rural consumption habits and stimulating urban markets for forest products (Padoch et al., Reference Padoch, Brondizio, Costa, Pinedo-Vasquez, Sears and Siqueira2008). However, rural–urban migrants also acquire forest and agricultural products, including wildmeat, outside of market exchanges. Based on redistribution (e.g. gifting) and reciprocity, this so-called economy of affection can equal trade in some households (WinklerPrins & de Souza, Reference WinklerPrins and de Souza2005; Minzenberg & Wallace, Reference Minzenberg and Wallace2011). Social relations underlie wildmeat consumption in urban and peri-urban locations in the Brazilian Amazon (Morsello et al., Reference Morsello, Yagüe, Beltreschi, van Vliet, Adams and Schor2015; Carignano Torres et al., Reference Carignano Torres, Morsello, Parry and Pardini2021).
Urbanization in the forested tropics brings changes to rural areas through increased market access, remittances from urban relatives and households that become multi-sited, spreading their time between rural and urban areas (Hecht et al., Reference Hecht, Yang, Basnett, Padoch and Peluso2015). Rural–urban movements have intensified because of the greater affordability of motorized river transport and the desire to access market goods and services (Dodd, Reference Dodd2020). This rural–urban mobility could change food consumption patterns (Kramer et al., Reference Kramer, Urquhart and Schmitt2009) and increase rural–urban trade (Padoch et al., Reference Padoch, Brondizio, Costa, Pinedo-Vasquez, Sears and Siqueira2008), thereby altering forest use (Hecht et al., Reference Hecht, Yang, Basnett, Padoch and Peluso2015). For instance, urban visitation reduces wildmeat consumption by rural people through either increasing domesticated meat consumption or stimulating wildmeat trade at the expense of their own consumption (Chaves et al., Reference Chaves, Wilkie, Monroe and Sieving2017).
Understanding rural–urban wildmeat flows and the scale of consumption in the forested tropics is important to achieving wildlife management that balances conservation with the well-being of people, including food security (Cawthorn & Hoffman, Reference Cawthorn and Hoffman2015). However, we lack information regarding wildmeat access amongst both urban and rural Amazonian populations and its linkages to rural–urban mobility, although both aspects have been studied separately (van Vliet et al., Reference van Vliet, Cruz, Quiceno-Mesa, Jonhson Neves de Aquino, Moreno, Ribeiro and Fa2015a,Reference van Vliet, Quiceno, Cruz, Jonhson Neves de Aquino, Yagüe and Schorb; Chaves et al., Reference Chaves, Wilkie, Monroe and Sieving2017; El Bizri et al., Reference El Bizri, Morcatty, Ferreira, Mayor, Vasconcelos Neto and Valsecchi2020a,Reference El Bizri, Morcatty, Valsecchi, Mayor, Ribeiro and Vasconcelos Netob).
Our aim was to understand how consumption of terrestrial wildlife species (hereinafter wildmeat) varies between urban and rural areas and whether urban consumption is shaped by rural–urban mobility. Based on field surveys in four municipalities in a highly forested region in the central Brazilian Amazon we examined: (1) differences in patterns of wildmeat consumption between urban and rural areas based on consumption frequency, species consumed and preferred and means of acquiring wildmeat; (2) the association between rural–urban mobility and wildmeat access; and (3) rural–urban differences in total wildmeat demand (accounting for per-capita consumption and number of consumers) in a study region of 43 riverine, geographically isolated municipalities, based on extrapolation from our empirical data.
Study area
We conducted our research in the municipalities of Caapiranga, Maués, Jutaí and Ipixuna in Amazonas State, Brazil (Fig. 1). Each municipality constitutes a town unconnected to the road network and surrounded by an extensive, mostly intact forested area (> 90% of municipal forest cover remaining), in which riverine communities are located. There are also some non-riverine rural settlements around each town (connected by rough roads) but these were not investigated. The study towns are distant from one another, relatively isolated and vary in watershed location, urban population (c. 13,300–65,000 people; IBGE, 2020) and fluvial distance to the state capital, Manaus (162–2,566 km; Parry et al., Reference Parry, Davies, Almeida, Frausin, de Moraés and Rivero2018; Table 1), which underpins their variable access to larger markets and services (private and public). These municipalities have low development outcomes (Human Development Index = 0.49–0.59) and maintain significant rural populations (41.4–57.3% of the municipal population in 2010; IBGE, 2010).
Study area in Amazonas State in Brazil, including the four study municipalities (Table 1) and the other 39 non-road-connected towns (unsampled) in the state. Detailed maps show the locations of the 63 rural riverine communities surveyed (c. 16 in each municipality): (a) Ipixuna, (b) Jutaí, (c) Caapiranga, (d) Maués.

Physical and demographic characteristics of the four Amazonian municipalities studied (Fig. 1).

The four study towns have grown substantially (mean population growth = 47.2%, range = 22–65%) between 2000 and the last census in 2010, although the total municipal populations have been growing to a lesser extent or even declining (mean = 21.6%, range = –19.8–50.8%; IBGE, 2000, 2010). This rapid growth of small cities is typical in Latin America (Baeumler et al., Reference Baeumler, D'Aoust, Das, Gapihan and Goga2021), leading to an increase in the proportion of the population of Amazonia living in urban areas (i.e. urbanization). Growth in our study towns reflects ongoing rural–urban migration (Parry et al., Reference Parry, Day, Amaral and Peres2010) and population growth because of the age structure of the population, with a large proportion of young people.
The main economic activities of the municipalities’ inhabitants are harvesting non-timber forest products, small-scale fishing and agriculture. Also important are public-sector employment in urban areas and government cash transfers to low-income households.
The rural populations are distributed mainly in riverine communities of various sizes, including along remote sub-tributaries. These river dwellers are peasants of mixed ancestry (Indigenous, African and European backgrounds) who live inside and outside Sustainable Use Reserves (human-inhabited protected areas). Although the study areas are also home to Amerindian societies, we did not include these in our study.
To estimate total wildmeat demand in urban and rural areas in the region, we included population size data for all 43 river-dependent municipalities in Amazonas State (Chacón-Montalván et al., Reference Chacón-Montalván, Taylor, Cunha, Davies, Orellana and Parry2021), constituting 77.1% of the state's area and 65.8% of the population outside of Manaus.
Methods
Sampling design
In each municipality, we aimed to randomly sample 200 households from the urban centre (total 800) and 80 households from 16 surrounding rural communities (five households per community, totalling 320 households from 64 communities). The sampling in each municipality was split across two hydrological seasons, with no repeated sampling (i.e. the per-season aim in each municipality was 100 urban households and 40 rural households from 8 rural communities), as this affects the availability of and access to wildmeat (van Vliet et al., Reference van Vliet, Cruz, Quiceno-Mesa, Jonhson Neves de Aquino, Moreno, Ribeiro and Fa2015a; Endo et al., Reference Endo, Peres and Haugaasen2016; Chaves et al., Reference Chaves, Wilkie, Monroe and Sieving2017). Low-water season sampling spanned August–December 2015, whereas high-water season sampling spanned March–July 2016. In each municipality we concentrated the sampling for each season into 4–5 weeks during the low- and high-water peaks, planned around spatial differences in hydrological seasonality (extended data available in Fig. 4 of Chacón-Montalván et al., Reference Chacón-Montalván, Taylor, Cunha, Davies, Orellana and Parry2021).
The final sample included 198–201 urban households per municipality (total 798) and 311 rural households from 63 communities. The lower sampling effort in rural areas was caused by us sampling nine fewer rural households (and one fewer community) than planned in Jutaí because of logistical issues. We chose the sampled rural communities (or settlements in places with fewer households; range: 3–42 households) to capture a gradient in travel distance from the nearest town (range: 7–249 km), locations inside and outside Sustainable Use Reserves, and different habitat types (floodplain and non-floodplain, which affects wildlife assemblages and abundance, and hunting activity; Endo et al., Reference Endo, Peres and Haugaasen2016; Pereira et al., Reference Pereira, Valsecchi and Queiroz2019; Fig. 1). We selected urban households according to their proximity to randomized geographical coordinates, and rural households were selected randomly from a list informed by the community members, containing all households in each community (Supplementary Material 1). Household members included all people considered residents during the interview, even if their residency was only part-time (i.e. when the individual also spent time in rural areas or working elsewhere). We did not sample multi-sited households in both their urban and rural locations.
Data collection
We conducted a survey to collect data on household rural–urban mobility, wildmeat consumption and socio-economic and demographic characteristics using face-to-face interviews (Supplementary Material 1–4). Using the same method, we collected community-level information from rural community leaders (Table 2, Supplementary Table 1). We conducted the interviews in Brazilian Portuguese, the native language of all interviewees and interviewers. We pre-tested the interview protocol (in May/June 2015) in urban and rural areas of a similar municipality in Amazonas (Autazes). Authors PCT and LP coordinated the survey, which was conducted together with nine other researchers and assistants.
Household- and community-level characteristics and variables of the study population across four Amazonian municipalities.
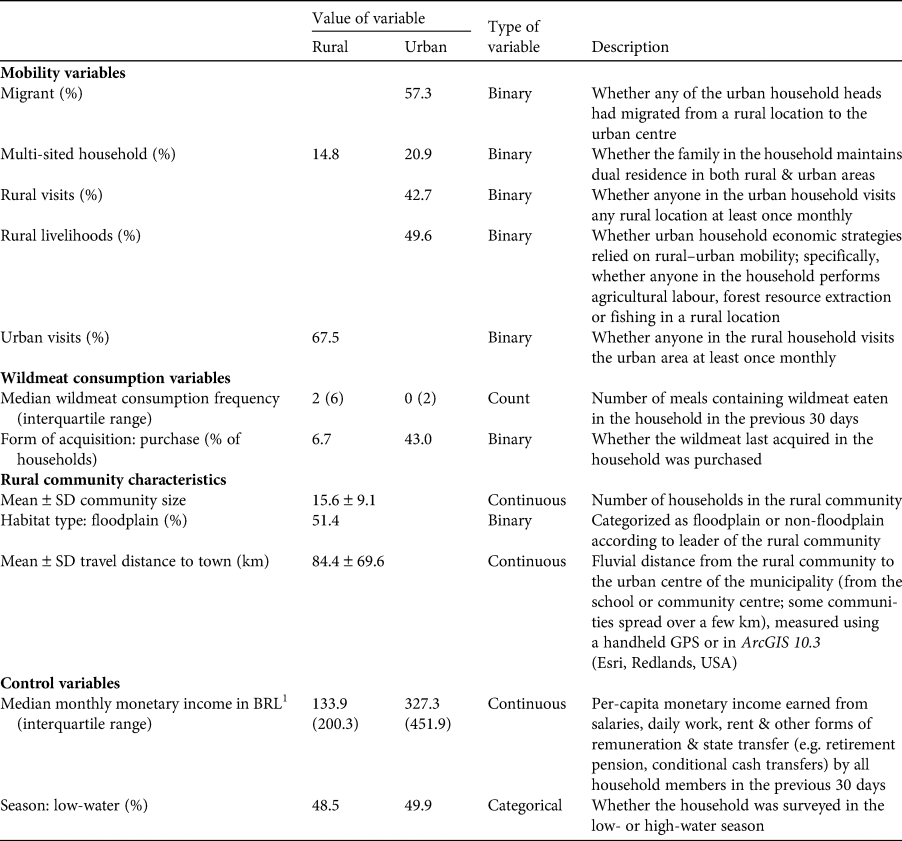
1 Conversion rate: USD 1 = BRL 3.70.
Measures of mobility
We measured the rural–urban mobility of households using four binary indicators for urban households and two for rural households (Table 2). Mobility constitutes rural–urban movements (i.e. circulation; Dodd, Reference Dodd2020), household economic strategies (Nasuti et al., Reference Nasuti, Eloy, Raimbert and Le Tourneau2015) and the geographical origin and identity of household heads (Castree et al., Reference Castree, Kitchin and Rogers2013).
Measures of wildlife consumption, preference and potential reporting bias
To measure wildmeat consumption, we asked about the number of meals in which wildmeat had been consumed in the previous 30 days. We also asked when wildmeat had last been consumed in the household and recorded the date of that event (to establish whether it had been consumed in the previous 12 months), whether it had been purchased, gifted or hunted by a household member (Table 2) and which species had been eaten, the quantity (in kg, the whole animal or pieces) and divided across how many meals. With this information, we estimated wildmeat consumed per meal in the household and per person (for each household; Supplementary Material 1).
To evaluate meat preferences, we asked the interviewee (male or female household head) to rank their three most preferred types of meat. If the interviewee cited wildmeat we asked which species they preferred.
In Brazil commercial hunting and wildmeat trade are illegal whereas subsistence hunting has an uncertain legal status, with it being allowed for traditional communities or subsistence hunters in a state of necessity, although this is subject to arbitrary legal interpretation (Antunes et al., Reference Antunes, Rebêlo, Pezzuti, de Vieira, de Constantino and Campos-Silva2019). Despite this, wildmeat hunting and consumption are ubiquitous in Amazonia and trade occurs in some food markets (under the counter), restaurants (clandestinely) and elsewhere through social networks (van Vliet et al., Reference van Vliet, Quiceno, Cruz, Jonhson Neves de Aquino, Yagüe and Schor2015b; Chaves et al., Reference Chaves, Monroe and Sieving2019; El Bizri et al., Reference El Bizri, Morcatty, Valsecchi, Mayor, Ribeiro and Vasconcelos Neto2020b). Wildmeat consumption in small and medium-sized towns in Amazonas State is unlikely to be underreported when using direct questioning. If a household declares its consumption of wildmeat it is unlikely to underreport the quantity consumed (Chaves et al., Reference Chaves, Valle, Tavares, von Muhlen and Wilcove2021b). We were often offered wildmeat in both rural and urban areas whilst conducting the current study. Similarly, numerous Amazonian studies using direct questioning have documented high rates of wildmeat consumption (Chaves et al., Reference Chaves, Monroe and Sieving2019; El Bizri et al., Reference El Bizri, Morcatty, Valsecchi, Mayor, Ribeiro and Vasconcelos Neto2020b) and that local attitudes towards wildmeat purchases are not negative (Chaves et al., Reference Chaves, Monroe and Sieving2019).
Data analysis
We conducted all data analyses in R 4.0.2 (R Core Team, 2020).
Objective 1
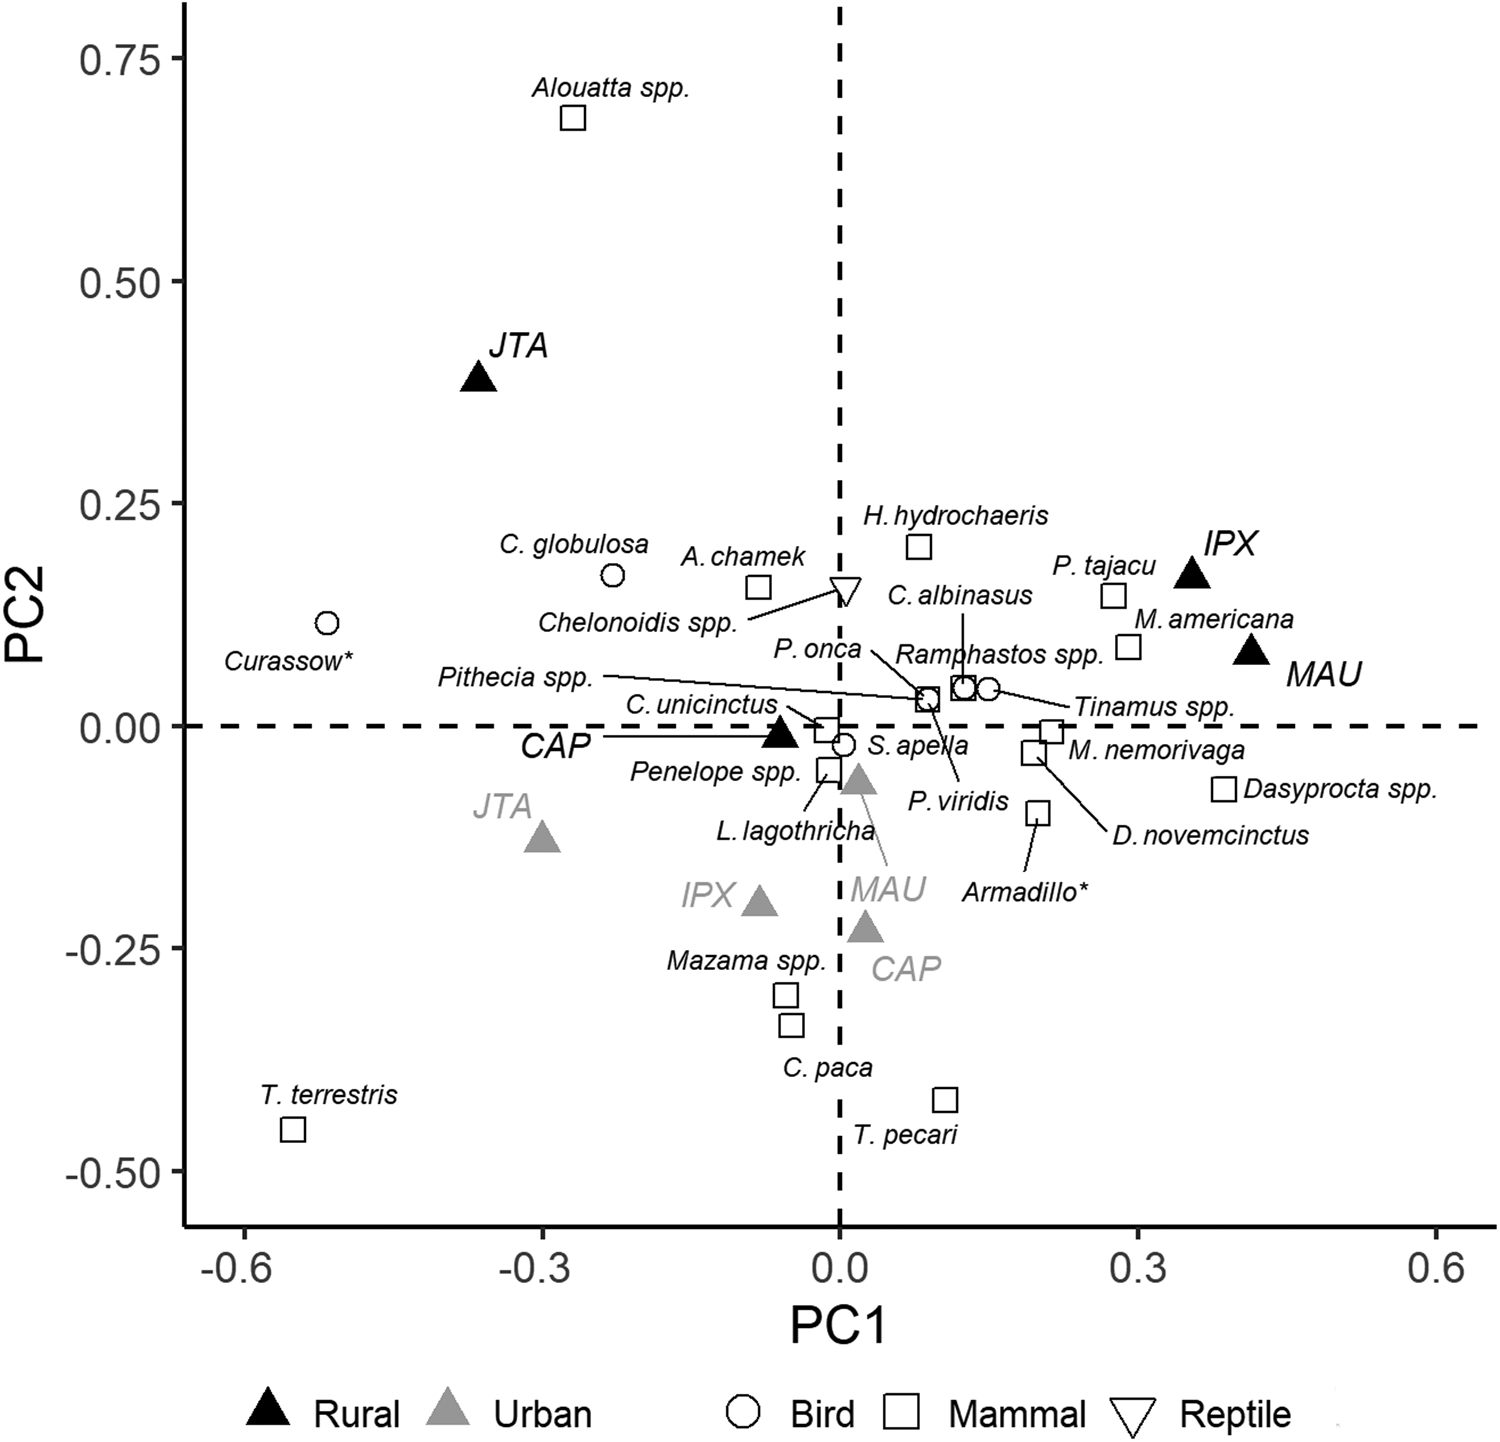
We used descriptive statistics to compare differences in consumption rates and means of acquiring wildmeat between rural and urban areas. We estimated mean per-capita consumption in rural and urban areas in each municipality per month and year including all sampled households (even those where wildmeat was not consumed, meaning consumption = 0). We calculated monthly per-capita consumption for each household based on the quantity consumed per meal per person multiplied by the number of meals consumed in that given household in the previous 30 days. We assessed species consumption profiles in each urban and rural area in the previous 12 months using a principal component analysis conducted in the vegan package in R. We assessed the number of times each species was consumed relative to the total number of declared events in each municipality and area (urban or rural).
Objective 2
To investigate how wildmeat access is associated with rural–urban mobility, we modelled consumption frequency (i.e. the number of wildmeat meals consumed in the previous 30 days, using a negative binomial distribution to account for excess zeros) and types of acquisition (i.e. the probability of acquiring wildmeat through different means (purchase = 1; hunted/gift = 0) based on the last acquisition, using a binomial distribution model). For both analyses we excluded households that declared no consumption in the previous 12 months, thus including 73.4% (n = 586) of sampled urban households and 98.7% (n = 307) of sampled rural households. We ran separate models for urban and rural samples and controlled for household- and community-level characteristics (Table 2, Supplementary Material 1). We used generalized linear models for urban households and generalized linear mixed-effects models for rural households, using community identity as a random variable to nest households within the same community so as to account for spatial dependency. We treated municipality as a fixed-effect factor for both rural and urban models. We tested for correlation between independent variables and found no strong correlations that would justify their exclusion, although community size (number of households) and frequency of urban visits bore some association with rural remoteness (distance from the nearest town; Supplementary Table 2).
Objective 3
We calculated the total amounts of wildmeat consumed in urban and rural areas of our study region based on our estimates of mean monthly and yearly consumption of wildmeat (kg) per household and per person (Supplementary Material 1). We then extrapolated these estimates to include the other 39 municipalities not connected to roads in Amazonas (Fig. 1), using 2020 municipal population estimates (IBGE, 2020) and estimating the sizes of urban and rural subpopulations. We assumed two demographic scenarios: (1) no change in the urbanization rate (proportion of the municipal population residing in urban areas) after 2010, and (2) that post-2010 the decadal change in the urbanization rate of a municipality was equal to that observed between the censuses of 2000 and 2010 (IBGE, 2000, 2010; e.g. an increase from 60 to 65% in 2000–2010 would mean a further increase to 70% in 2010–2020). We indicate the lower and higher bounds of our region-wide estimates based on the lowest and highest per-capita values calculated from the four fieldwork municipalities.
Results
Rural–urban mobility
We found considerable rural–urban mobility amongst town residents, even in the largest town of Maués. In most households in towns (57.3%) at least one of the household heads was a rural in-migrant, and in many households (42.7% overall or 44.2% of migrant households) someone visited rural areas at least monthly or practiced rural livelihoods (49.7% overall, increasing to 56.2% of migrant households, with rural-centric activities including agriculture, forest resource extraction and fishing). Dual residence (being multi-sited) was maintained by 24.5% of rural in-migrant households. Similarly, for rural residents rural–urban circulation was common: 67.5% travelled to the nearest town (mean = 84 km) at least monthly, whereas visiting weekly was rare (8.4%). Dual residence was maintained by 14.8% of rural residents (Fig. 2).
Summary statistics of rural–urban mobility for households surveyed in four municipalities in Amazonas State, Brazil (Table 2). Error bars represent 95% CIs for the observed per cent values estimated using Wilson score intervals (CIs for binomial proportions).

Objective 1: rural and urban wildmeat consumption
Wildmeat was eaten less often in towns than in rural communities. Consumption of wildmeat was ubiquitous in rural areas, whereas in towns 26.6% of households had not eaten any wildmeat in the previous 12 months (Table 3). Within our sample, per-capita annual consumption across municipalities was 14.7–28.8 kg in rural areas (mean = 21.1; 95% CI =15.9–27.3) and 1.3–6.4 kg in urban areas (mean = 4.9; 95% CI = 3.9–5.9). Wildmeat consumption was lower in towns because it was eaten less often (urban mean = 1.3; 95% CI = 1.0–1.5 meals per month; rural mean = 4.7; 95% CI = 3.9–5.5 meals per month) and these meals were smaller (urban mean = 1.1; 95% CI = 1.0–1.3 kg wildmeat; rural mean = 1.8; 95% CI = 1.3–2.3 kg wildmeat; Supplementary Table 3).
Wildmeat consumption in per cent of households across four Amazonian municipalities where wildmeat had been consumed, and the mean number of meals consumed containing wildmeat.

Wildmeat consumed in urban areas was mainly of three species: the lowland paca Cuniculus paca (eaten in 30.9% of events), tapir Tapirus terrestris (21.7%) and white-lipped peccary Tayassu pecari (20.5%). These species were also the ones most often declared as preferred (Figs 3 & 4, Supplementary Table 4). However, consumption in towns included 10–12 species, and in 26.7% of events people consumed brocket deer Mazama spp., curassow (Cracinae), agouti Dasyprocta spp., collared peccary Pecary tajacu or tortoise Chelonoidis spp. In rural areas consumption included 12–18 terrestrial species, with a more even distribution of the per cent of consumption events across species. Lowland paca, tapir and white-lipped peccary accounted for 39.2% of events (16.0, 6.2 and 17.0%, respectively), compared to nearly 75% in towns. Howler monkeys Alouatta spp. were consumed almost as frequently as lowland paca in rural areas (13.4 and 16.0% of events, respectively), particularly because of widespread rural consumption in Jutaí. In contrast, howler monkeys were rarely consumed in towns (2% of events) and brocket deer, curassow, agouti, collared peccary and tortoise together accounted for 39.9% of rural events (Supplementary Fig. 1).
Ordination of species composition based on the last species consumed in the households during the previous 12 months (Table 3). Species occurrence was pooled by municipality and area (urban or rural). Species are represented by shapes according to taxonomic classes. The municipalities are represented by filled triangles (CAP = Caapiranga, IPX = Ipixuna, JTA = Jutaí, MAU = Maués) and their areas are represented by different shades. Asterisks (*) denote taxa that were not identified to genus/species level.
Consumption of and preferences for wildmeat from three frequently consumed species in urban and rural households in each municipality (Table 3). Symbols plotted represent the per cent of households that had consumed each species when wildmeat was last consumed in the household in the previous 12 months and the per cent of interviewees (one per household) that declared the species to be their favourite wildmeat type in each municipality.

Wildmeat acquisitions via purchase and gifting were at similar levels in towns (44.0 and 42.6% of households, respectively). In rural areas only 7.5% of households purchased wildmeat. Hunting by a household member also occurred amongst urban populations (11–15% of households). However, means of acquiring wildmeat varied by municipality (Fig. 5) and species. In the more remote municipalities of Ipixuna and Jutaí, purchase centred on tapir and white-lipped peccary, whereas paca was the most purchased species in Maués (Supplementary Figs 2 & 3).
Means of acquiring wildmeat, based on the last time wildmeat was consumed in households in urban and rural areas of the four study municipalities (Table 3).

Objective 2: rural–urban mobility and wildmeat access
In towns, consumption of wildmeat meals was 57% greater amongst rural in-migrants (incidence rate ratio = 1.57; 95% CI = 1.15–2.12) than amongst non-in-migrants, and 42% greater for those with rural livelihoods (incidence rate ratio = 1.42; 95% CI = 1.06–1.89) than those who did not pursue rural-centric activities. Consumption frequency was unrelated to rural visitation by town-dwellers when other variables were accounted for (Supplementary Table 5).
In rural areas, consumption of wildmeat meals was 90% greater in the high-water season (incidence rate ratio =1.90, 95% CI = 1.23–2.89) than in the low-water season. Consumption was twice as high amongst non-floodplain communities compared to floodplain (várzea) communities (increasing by 107%; incidence rate ratio = 2.07, 95% CI = 1.08–4.01). Living 100 km farther from a town increased wildmeat consumption frequency by one meal per month (95% CI = 0.5–10.0; Supplementary Table 6). After accounting for rural remoteness, urban visitation by rural people was unrelated to wildmeat consumption frequency. Although we cannot completely exclude an effect of urban visits, it is probable that variation in rural consumption of wildlife reflects aspects of rural remoteness (e.g. lower human population density and more forest) more strongly than access to urban markets, as remoteness and urban visits were not strongly correlated.
In towns, purchasing wildmeat correlated with higher income. For a BRL 100 increase in monthly per-capita income (c. USD 19 at the time of the study), the odds of purchasing wildmeat increased by 13% (odds ratio = 1.13, 95% CI = 1.04–1.24). In contrast, having a rural livelihood (compared to not) decreased the odds of purchasing wildmeat by 33% (odds ratio = 0.67, 95% CI = 0.46–0.96). The likelihood of wildmeat being purchased differed between towns; it was less likely in Caapiranga, with 53% lower odds compared to in Ipixuna (odds ratio = 0.47, 95% CI = 0.29–0.76).
In rural areas, living in a larger community increased the odds of a household purchasing wildmeat. An increase of 10 households increased the odds by 97% (odds ratio = 1.97, 95% CI = 1.01–4.08; Supplementary Table 7).
Objective 3: estimated wildmeat consumption in non-road-connected municipalities
When considering the study region and static municipal urbanization rates (Scenario 1), we estimated overall wildmeat consumption (including purchased, gifted or hunted) to be over three times greater in rural areas (total 12,057 t/year) compared to urban areas (total 3,614 t/year). This is based on our empirical estimates of per-capita rural and urban consumption, official estimates of municipal population growth during 2010–2020 and the municipality-specific urbanization rates in 2010. Nonetheless, these estimates have broad CIs (rural range: 9,103–15,635 t; urban range: 2,893–4,336 t), given the observed municipality-scale variation in per-capita consumption. When assuming ongoing urbanization (continuation of the observed municipal urbanization trends during 2000–2010; i.e. Scenario 2), the overall rural population of the study region would be 14% lower and the urban population 11% higher compared to Scenario 1. Yet rural consumption would still be more than twice that of urban consumption (rural total: 10,362 t, range: 7,823–13,437 t; urban total: 4,009 t, range: 3,209–4,810 t).
Discussion
There were five main results of our study, highlighting one similarity and four rural–urban differences in wildmeat consumption and access.
Firstly, the importance of gifting in both areas emphasizes the crucial role of social relations in accessing wildmeat. Although wildmeat sharing practices have been investigated in Indigenous and non-Indigenous rural communities in Amazonia (e.g. Nunes et al., Reference Nunes, Guariento, Santos and Fischer2019a), their importance is rarely assessed. Wildmeat purchase was common in urban areas, with the highest rate of purchase being of tapir in Ipixuna. However, even for this most commonly purchased species and location, c. 30% of meals containing the species were obtained as gifts. Some studies found social relations to be important for accessing wildmeat in towns (Morsello et al., Reference Morsello, Yagüe, Beltreschi, van Vliet, Adams and Schor2015), but most studies attribute urban access to trade alone (Chaves et al., Reference Chaves, Monroe and Sieving2019; El Bizri et al., Reference El Bizri, Morcatty, Valsecchi, Mayor, Ribeiro and Vasconcelos Neto2020b).
Secondly, trade was important in towns but rare in rural areas. Studies in other Amazonian towns have reported high rates of urban wildmeat purchases (70–86%; Chaves et al., Reference Chaves, Monroe and Sieving2019; El Bizri et al., Reference El Bizri, Morcatty, Valsecchi, Mayor, Ribeiro and Vasconcelos Neto2020b). Our 43% estimate could reflect underreporting if interviewees perceived purchasing wildmeat as riskier than other forms of acquisition. However, we believe underreporting was probably low, as participants reported high purchase rates (c. 40–50%), even in the largest town of Maués (47%). In addition, direct questioning does not appear to generate underestimations of wildmeat consumption in Amazonian towns (Chaves et al., Reference Chaves, Valle, Tavares, von Muhlen and Wilcove2021b) as urban residents do not have negative attitudes towards purchasing wildmeat (Chaves et al., Reference Chaves, Monroe and Sieving2019). In rural areas, wildmeat was seldom purchased, being instead accessed through direct harvesting or social relations. Although our rural sample overrepresented small communities, we observed a greater probability of wildmeat purchase in larger communities. Nascent trade in these larger communities could reflect less food sharing because of less reciprocal cooperation (Ringen et al., Reference Ringen, Duda and Jaeggi2019). Trade could therefore become more important in rural locations given that rural communities near towns are growing rapidly (Parry et al., Reference Parry, Day, Amaral and Peres2010).
Thirdly, rural–urban mobility remains common in central Amazonia, influencing both wildmeat consumption and acquisition amongst town dwellers, but appearing to be less important in shaping rural consumption. In towns, poor and migrant households tended to access wildmeat through rural connections and social practices (gift-giving) but purchasing was more likely amongst wealthier urban households. The frequency of wildmeat consumption in towns was also mediated by rural connections and practices. Wildmeat was consumed more often by rural–urban migrants and those with rural livelihoods, demonstrating that rural–urban mobility (including identity) explains patterns of wildmeat consumption in urban Amazonia. This supports the notion that wildmeat consumption is a rural tradition that is not restricted to Amazonia (for similar findings in the Republic of the Congo, see Chausson et al., Reference Chausson, Rowcliffe, Escouflaire, Wieland and Wright2019). The wildmeat food practices of migrants appear to fade after they have lived in towns for several decades (Chaves et al., Reference Chaves, Valle, Tavares, Morcatty and Wilcove2021a; Lemos et al., Reference Lemos, Loureiro, Morcatty, Fa, de Vasconcelos Neto and de Souza Jesus2021) and amongst subsequent generations (Chausson et al., Reference Chausson, Rowcliffe, Escouflaire, Wieland and Wright2019; Luiselli et al., Reference Luiselli, Hema, Segniagbeto, Ouattara, Eniang and Parfait2020). In rural areas, remote households consumed more wildmeat, perhaps because of better access to primary forests (and therefore greater game availability; Parry et al., Reference Parry, Day, Amaral and Peres2010) rather than because of reduced access to markets, given that rural consumption was unrelated to urban visitation. Alternatively, lower wildlife consumption in communities nearer towns could reflect wildlife depletion (Parry & Peres, Reference Parry and Peres2015; Abrahams et al., Reference Abrahams, Peres and Costa2017) instead of easier access to and higher consumption of domesticated meat. Nonetheless, a study in another Amazonian municipality found that rural people who spent more time in towns ate less wildmeat (Chaves et al., Reference Chaves, Wilkie, Monroe and Sieving2017).
Fourthly, urban consumption concentrated on three preferred species whereas rural populations generally consumed a greater number of species. The tapir and white-lipped peccary are categorized as Vulnerable on the IUCN Red List (Keuroghlian et al., Reference Keuroghlian, Desbiez, Reyna-Hurtado, Altrichter, Beck, Taber and Fragoso2013; Varela et al., Reference Varela, Flesher, Cartes, de Bustos, Chalukian, Ayala and Richard-Hansen2019) and both our urban and rural interviewees perceived them as becoming more difficult to acquire (Supplementary Table 4). Preferential consumption of these species in urban areas has been reported elsewhere in Amazonia (Parry et al., Reference Parry, Barlow and Pereira2014; van Vliet et al., Reference van Vliet, Cruz, Quiceno-Mesa, Jonhson Neves de Aquino, Moreno, Ribeiro and Fa2015a,Reference van Vliet, Quiceno, Cruz, Jonhson Neves de Aquino, Yagüe and Schorb; El Bizri et al., Reference El Bizri, Morcatty, Valsecchi, Mayor, Ribeiro and Vasconcelos Neto2020b). These species were also most often purchased in the current study, perhaps reflecting taste preferences, reinforcing evidence associating wealth with consumption of preferred species (van Vliet et al., Reference van Vliet, Nasi, Taber, Shackleton, Shackleton and Shanley2011) and hunter preferences for large-bodied species (van Vliet et al., Reference van Vliet, Quiceno-Mesa, Cruz-Antia, Neves de Aquino, Moreno and Nasi2014).
Finally, despite the persistence of social linkages with rural locations, wildmeat was eaten less often and in lower quantities in towns compared to in rural communities, which is consistent with evidence from Africa and Amazonia (Nasi et al., Reference Nasi, Taber and van Vliet2011; van Vliet et al., Reference van Vliet, Quiceno-Mesa, Cruz-Antia, Neves de Aquino, Moreno and Nasi2014; Nunes et al., Reference Nunes, Peres, de Constantino, Santos and Fischer2019b; El Bizri et al., Reference El Bizri, Morcatty, Valsecchi, Mayor, Ribeiro and Vasconcelos Neto2020b). This resulted in greater overall consumption in rural areas, as discussed in the following subsection.
Overall wildmeat consumption in non-road-connected municipalities
Our findings show that forest wildlife provides large quantities of meat to rural and urban inhabitants in our study region, which features largely intact forests. Our estimates of urban consumption fall within those modelled for three out of four other municipalities (El-Bizri et al., Reference El Bizri, Morcatty, Valsecchi, Mayor, Ribeiro and Vasconcelos Neto2020b). Our lowest recorded urban wildmeat consumption was in Maués (1.3 kg/person/year), which is below what would be predicted from previous studies (El-Bizri et al., Reference El Bizri, Morcatty, Valsecchi, Mayor, Ribeiro and Vasconcelos Neto2020b), although it is consistent with findings that consumption rates decline as the population of a town increases (Chaves et al., Reference Chaves, Valle, Tavares, Morcatty and Wilcove2021a). Our estimate of wildmeat consumption in rural areas of 21.1 kg/person/year was below the estimate of 54.8 kg from a previous study (Nunes et al., Reference Nunes, Peres, de Constantino, Santos and Fischer2019b). This discrepancy could be because of the inclusion of Indigenous communities in the previous study, which are often more reliant on wildmeat, and of estimates based on reported hunting offtake rather than household consumption (as not all households include hunters; Nunes et al., Reference Nunes, Peres, de Constantino, Santos and Fischer2019b). In our study, one-quarter of rural households did not have a hunter. In summary, we found strong evidence that per-capita and aggregate urban consumption of wildmeat in central Amazonia is much lower than rural consumption, although we did not attempt to extrapolate our empirical findings to larger or road-connected cities.
Although conservation interest increasingly focuses on wildmeat consumption in urban areas of Amazonia, rural consumption far exceeded urban consumption in our study. This carries important policy implications for biodiversity conservation and livelihoods, because wildmeat consumption is a crucial element contributing to the health of vulnerable rural children by reducing the risk of iron deficiency anaemia (Carignano Torres et al., Reference Carignano Torres, Morsello, Orellana, Almeida, de Moraes and Chacón-Montalván2022). A logical first step to protect game populations whilst sustaining local livelihoods is to incentivize sustainable management in rural locations. Such management is challenging and requires strong formal and informal institutional arrangements (Coad et al., Reference Coad, Fa, Abernethy, van Vliet, Santamaria and Wilkie2019), although there is evidence of sustainable hunting in some Indigenous and traditional forest-dweller territories (Ohl-Schacherer et al., Reference Ohl-Schacherer, Shepard, Kaplan, Peres, Levi and Yu2007; Shaffer et al., Reference Shaffer, Yukuma, Marawanaru and Suse2018). Implementing management plans outside protected areas is particularly challenging because of insecure land tenure. Multi-sited households, which are linked to rural–urban mobility, bring additional challenges to natural resources management, such as altering institutional arrangements in rural areas, as residents are away from their homes periodically (Eloy et al., Reference Eloy, Brondizio and Do Pateo2015). Additionally, subsistence hunting has an ambiguous legal status in Brazil, even for traditional and rural communities, which adds challenges to hunting management (Antunes et al., Reference Antunes, Rebêlo, Pezzuti, de Vieira, de Constantino and Campos-Silva2019).
What could explain the lower consumption of wildmeat in urban areas? The illegality of the wildmeat trade could prevent large flows of wildmeat into towns, despite the weak enforcement of relevant laws. Moreover, domesticated meat, especially frozen chicken, is relatively cheap and substitutes for wildmeat even amongst poor urban households. Beef is also available locally and relatively affordable in Ipixuna, one of the towns we studied (PCT & LP, unpubl. data, 2015). Finally, consuming wildmeat is a rural-related practice that tends to diminish in towns over time and generations (Chaves et al., Reference Chaves, Valle, Tavares, Morcatty and Wilcove2021a; Lemos et al., Reference Lemos, Loureiro, Morcatty, Fa, de Vasconcelos Neto and de Souza Jesus2021).
Conclusion
We show that urban wildmeat consumption in central Amazonia is related to social food-sharing networks and rural–urban mobility. This challenges common perceptions of urban wildmeat consumption being driven primarily by vendors and markets (Fig. 3 in Ingram et al., Reference Ingram, Coad, Milner-Gulland, Parry, Wilkie and Bakarr2021). Accounting for rural–urban mobility and the persistence of rural livelihoods could help achieve sustainability goals (e.g. by including urban stakeholders in discussions regarding the management of natural resources; Padoch et al., Reference Padoch, Brondizio, Costa, Pinedo-Vasquez, Sears and Siqueira2008; Eloy et al., Reference Eloy, Brondizio and Do Pateo2015; Hecht et al., Reference Hecht, Yang, Basnett, Padoch and Peluso2015). If the legal ban on urban wildmeat consumption was actually enforced in Brazilian Amazonia, then the risk of resulting food insecurity would be greatest for rural–urban migrants, who tend to maintain rural livelihoods and social networks. However, policy interventions to restrict the urban trade in wildmeat could affect migrants to a lesser degree, given that they purchase wildmeat less often. This is particularly important as consumer preferences for Vulnerable species (T. pecari and T. terrestris), which are often accessed through market exchanges, are probably a causal factor in the depletion of their populations even in remote locations > 100 km from central Amazonian towns (Parry & Peres, Reference Parry and Peres2015; Abrahams et al., Reference Abrahams, Peres and Costa2017). Despite claims of high demand in towns (El Bizri et al., Reference El Bizri, Morcatty, Valsecchi, Mayor, Ribeiro and Vasconcelos Neto2020b; Chaves et al., Reference Chaves, Valle, Tavares, Morcatty and Wilcove2021a,Reference Chaves, Valle, Tavares, von Muhlen and Wilcoveb) and although demand could increase because of urban growth, we show that conservation interventions relating to wildmeat consumption remain more urgent in rural locations. Thus, monitoring rural–urban flows of threatened species and sustainably managing rural hunting are warranted where strong institutional arrangements facilitate this approach.
Acknowledgements
We thank A. de Moraes, M.A.T. Pinto, G.B. Correia, N.B. Migon, M.G. Fink, M.P. Freire, R.F.R. Costa and L.M.L. Silva for support with data collection; the participants for their involvement in this study; and all institutions and personnel that provided logistical support. This research was funded by a Future Research Leaders Fellowship to LP (ES/K010018/1), the Newton Fund/FAPEAM (ES/M011542/1), CNPq (CsF PVE 313742/2013-8), CAPES-ProAmazonia (3322-2013), the European Commission Horizon 2020 RISE programme (691053 – ODYSSEA) and post-doctoral grants from CNPq (401700/2013-5) and Coordenação de Aperfeiçoamento de Pessoal de Nível Superior (CAPES) – 001 to PCT.
Author contributions
Study design and fieldwork: PCT, LP; data analysis and writing: PCT, CM, LP.
Conflicts of interest
None.
Ethical standards
This research abided by the Oryx guidelines on ethical standards and was carried out following the rules and guidelines of the Brazilian National Health Council (Resolution 466/12) and the British Sociological Association. The research and interview protocol were evaluated and approved by the National Health Research Ethics Committee of Brazil (CONEP/CNS; protocol 45383215.5.0000.0005) and the Research Ethics Committee of Lancaster University (S2014/126). Written free and informed consent was obtained from all interviewees after explaining the research aims and protocols and before administering the interviews. This included a statement ensuring that the information provided to participants would only be known to project researchers and names and personal data would remain confidential. One copy, signed by the study coordinator, remained with the participant. In rural areas, we first approached the leader of each riverine community and held a community meeting to explain our research aims and protocols. Only after receiving the verbal approval of the community for conducting the research did we proceed to interview participants.


 Open access