

Over the past decade, interest in gut microbiome (GM) composition in relation to health status has increased tremendously due to technical advances in genomic analyses(Reference Morgan and Huttenhower1). Many determinants of microbiome patterns, e.g. ageing, use of antibiotics, other medications, environmental exposures and genetics, have been identified(Reference Fu, Randolph and Lim2,Reference Wu, Chen and Hoffmann3) . Nutritional factors influence the presence and activity of specific gut bacteria and are linked to conditions such as the metabolic syndrome, colorectal cancer, inflammatory bowel disease and CVD have emerged(Reference Fu, Randolph and Lim2,Reference Fabiani, Naldini and Chiavarini4) . Diet quality indices are commonly utilised to analyse the impact of overall diet composition as a single measure(Reference Hu5). The Healthy-Eating Index (HEI) describes compliance with the USA federal dietary guidelines(6,Reference Panizza, Shvetsov and Harmon7) .
Our previous report based on the Adiposity Phenotype Study (APS), a subset of the Multiethnic Cohort (MEC) with close to 2000 participants, found that higher diet quality was associated with greater α diversity and the relative abundance of the phylum Actinobacteria and twenty-one genera(Reference Maskarinec, Hullar and Monroe8), including seven members of the Lachnospiraceae family from the phylum Firmicutes. Similarly, in a Swedish study, higher scores for a ‘‘health-conscious” food pattern were related to the abundance of six genera of the phylum Firmicutes(Reference Ericson, Brunkwall and Hellstrand9): loading positively in relation to Roseburia, Lachnospira and unclassified in order RF39 and negatively in relation to Blautia, Eubacterium and Anaerotruncus. Lower HEI-2005 scores were associated with a lower relative abundance of Roseburia in a recent report(Reference Liu, Ajami and El-Serag10). Beneficial effects of the Mediterranean Diet on the diversity and GM composition have also been detected in several investigations(Reference Maskarinec, Hullar and Monroe8,Reference De Filippis, Pellegrini and Vannini11–Reference Mitsou, Kakali and Antonopoulou13) . For example, adherence to the MD was associated with significantly higher levels of total SCFA in fecal samples and linked to a significant reduction in overall mortality and morbidity(Reference De Filippis, Pellegrini and Vannini11–Reference Mitsou, Kakali and Antonopoulou13). Also, a greater presence of Bacteroidetes was associated with a lower animal protein intake(Reference Garcia-Mantrana, Selma-Royo and Alcantara12). A recent report identified a panel of intestinal species that were associated with healthy dietary habits and overlapped with those associated with favourable cardiometabolic and postprandial markers(Reference Asnicar, Berry and Valdes14).
The current analysis examines the association of the HEI-2015 with gut microbial diversity and the structure of the gut microbial community, expanding our previous MEC cross-sectional analysis(Reference Maskarinec, Hullar and Monroe8) of 1735 participants and 103 individual bacteria to a larger study population of more than 5000 cohort members and an updated reference library with 152 genera. By analysing diet quality assessed at cohort entry (Q1) and follow-up (Q3), 21 and 9 years before stool collection, respectively, long-term exposure and changes in diet quality over time can be evaluated. Significant findings for past diet as assessed in Q1 and Q3 were confirmed in the data set that assessed diet quality (APS) and the GM at the same time(Reference Maskarinec, Hullar and Monroe8).
Materials and methods
Study population
The MEC is an ongoing study of more than 215 000 participants aged 45–75 years from five ethnic groups (Japanese American, white, Latino, African American and Native Hawaiian) recruited in Hawaii and Los Angeles, California (online Supplemental Fig. S1). As previously published(Reference Kolonel, Henderson and Hankin15), all participants completed a self-administered questionnaire (Q1) at cohort entry (1993–1996), which collected information on anthropometrics, socio-demographic factors, medical history, physical activity and a quantitative FFQ (QFFQ). A follow-up questionnaire (Q3) during 2003–2008 was completed by 98 214 (46 %) participants(Reference Park, Shvetsov and Kang16). As part of a Microbiome Genome-Wide Association Study (mGWAS) study and the APS conducted in 2013–2016(Reference Lim, Monroe and Buchthal17), 6094 participants were recruited from the MEC study using a uniform stool collection protocol(Reference Fu, Randolph and Lim18). The study protocol was approved by the Biomedical Institutional Review Boards at the University of Hawaii (CHS#17200) and the University of Southern California (#HS-12-00623); all participants signed an informed consent form. After excluding individuals with invalid dietary information as well as missing BMI and/or microbiome data (n 158), the final data set consisted of 5936 mGWAS and APS participants. As 656 did not complete the follow-up questionnaire, 5280 cohort members were part of the Q3 data set.
Microbiome genome-wide association study
The mGWAS includes a MEC subset of 4502 participants aged 60–90 years who had been previously genotyped for different GWAS projects(Reference Fu, Randolph and Lim18). Exclusion criteria due to their known effects on the gut microbiota(Reference Jakobsson, Jernberg and Andersson19,Reference O'Brien, Allison and Grimpen20) included ileostomy/colectomy and dialysis. Participation was deferred for recent treatment with chemotherapy, radiation therapy, corticosteroid hormones, prescription weight-loss drugs, insulin or thyroid medications, antibiotics and flu shot or other vaccination; recent endoscopy or irrigation and/or cleansing of the large intestine and recent substantial weight change(Reference Fu, Randolph and Lim18). Participants were asked to mail their stool sample with a completed questionnaire addressing exposures related to the fecal microbiome, such as recent antibiotics use. The overall participation rate was 43 % among eligible individuals.
Adiposity phenotype study
The APS recruited a subset of 1861 MEC participants aiming to study body fat distribution and its determinants(Reference Lim, Monroe and Buchthal17). Participants aged 60–77 years were stratified by sex, ethnicity and six BMI categories (18·5–21·9, 22–24·9, 25–26·9, 27–29·9, 30–34·9 and 35–40 kg/m2). Exclusion criteria included current BMI outside 18·5–40 kg/m2, current/recent (<2 years) smoking, soft or metal implants or serious health conditions, with similar deferment criteria as in the mGWAS for recent relevant exposures. The overall participation rate was 23 % of eligible individuals. During a clinic visit, blood and stool samples, anthropometric measures, questionnaire data and Magnetic Resonance Imaging (MRI) and Dual-energy X-ray Absorptiometry (DXA) scans were obtained(Reference Lim, Monroe and Buchthal17).
Dietary assessment and healthy eating index-2015
A detailed description of the QFFQ development and calibration has been reported previously(Reference Stram, Hankin and Wilkens21). Briefly, the QFFQ was designed to include food groups that contributed >85 % (for each ethnic group) of the intake of nutrients of interest during the past year(Reference Stram, Hankin and Wilkens21). The frequency of over 180 food items was assessed using eight categories for food groups and nine for beverages and the amount of each item was recorded in three serving sizes(Reference Kolonel, Henderson and Hankin15). Although the substance of the QFFQ remained the same, the original QFFQ was updated in 2003 for Q3 and the APS to modify the food lists, amounts and examples or names given for the food items without substantial change.
Using an extensive food composition database(Reference Murphy22) and the same approach, estimated daily intakes were computed to calculate the HEI-2015, which is an updated version of the original HEI-2005 and HEI-2010(Reference Guenther, Casavale and Reedy23,Reference Guenther, Reedy and Krebs-Smith24) reflecting the Dietary Guidelines for American 2015–2020(6). The HEI-2015 is composed of thirteen components with a maximum of 100 points(Reference Panizza, Shvetsov and Harmon7) and includes nine adequacy components (total fruits, whole fruits, total vegetables, greens and beans, whole grains, dairy, total protein foods, seafood and plant proteins and fatty acids) as well as four moderation components (refined grains, Sodium, added sugars and saturated fats). Most components are scored as amounts per 1000 kcal of intake. The key differences between the 2010 and 2015 index include the allocation of legumes, which was modified to total vegetables, greens and beans, total protein foods and seafood/plant proteins and the empty energy component, which was replaced with saturated fat and added sugars.
Stool collection
During mGWAS and APS studies in 2013–2016, stool samples were collected in RNAlater (Ambion) and stored at −80 °C until bulk shipment on dry ice from Honolulu or Los Angeles to Seattle for processing. Stool sampling was delayed for at least 3 months for participants who first reported use of antibiotics. As previously described(Reference Fu, Randolph and Lim25), DNA was extracted and amplified for the V1–V3 region of the 16S rRNA genes, and amplicons were sequenced on the MiSeq platform (Illumina, San Diego, CA). To classify bacterial taxonomy, sequences were processed using QIIME v.1.8(Reference Caporaso, Kuczynski and Stombaugh26) and SILVA 1.32, as previously described but updated in comparison with the previous study(Reference Fu, Randolph and Lim25). The filtering strategy for operational taxonomic units included parameters in QIIME to exclude low abundant sequences, singletons and chimeras and final filtering at the genera level, in which we removed genera that appeared in <10 % of the samples(Reference Langille, Zaneveld and Caporaso27). Diversity indices were calculated on ComBat-adjusted(Reference Zhang, Parmigiani and Johnson28) operational taxonomic unit counts and then exported for statistical analysis.
Statistical analysis
All statistical modelling was conducted with SAS version 9.4 software (SAS Institute Inc., Cary, NC). All phylum and genus variables had undergone ComBat-adjustment(Reference Zhang, Parmigiani and Johnson28) to correct values across laboratory batches and centered log-ratio transformation to account for their compositional nature(Reference Gloor, Macklaim and Pawlowsky-Glahn29). The HEI-2015 scores were categorised into tertiles with tertile 1 indicating the lowest and tertile 3 the highest diet quality. To examine the association of diet quality with α diversity (Shannon, Chao1 and PD Whole Tree) and relative abundance of phyla and genera, general linear models were applied to estimate covariate-adjusted least square means of gut microbial measures by HEI-2015 tertiles; trend tests using the continuous variables assessed possible dose–response relations. The regression coefficients in these models indicate the change in relative abundance of a GM component per one unit of the HEI-2015 score. All models were adjusted for ethnicity, sex, age at stool collection, BMI, alcohol intake, physical activity (<0·5 v. ≥0·5 h moderate/vigorous activity), total energy intake (log-transformed), smoking status and antibiotic use within the last year, but not other medications as only information on use of antifungals (1 %), laxatives (19 %) and probiotics (8 %) was requested at the time of stool collection.
Assuming a nominal type-I error of 0·05, Bonferroni corrections were applied to the analysis of the 10 phyla (0·05/10 = 0·005) and the 152 genera (0·05/152 = 0·00033) to lower the likelihood of chance associations. To analyse diet quality as assessed 20·8 (sd 1·2) and 9·3 (sd 1·4) years before stool sample collection, separate models were performed for nutritional information obtained at Q1 and Q3. In addition, the APS data set with 1685 participants who completed the QFFQ at the same time as stool sample collection were analysed. Participants who had completed Q1 and Q3 were assigned change variables (T1T1, T1T2, T1T3, T2T1, T2T2, T2T3, T3T1, T3T2 and T3T3). For instance, T1T2 indicates that the individual was in tertile 1 at Q1 and in tertile 2 at Q3. Because of the small sample size, change from Q1 to APS (n 1685) was not computed. To evaluate the influence of change in diet quality between Q1 and Q3, these nine categories were modelled as independent variables using the same approach as above and represented in a heat map. The 13 HEI-2015 components were plotted in a spider plot to identify changes in diet quality responsible for a decrease or increase in tertiles from Q1 to Q3.
Results
The 5936 participants at Q1 (Table 1) were equally distributed between women (52·7 %) and men (48·3 %). A total of 5280 participants completed Q3 and 1685 at APS. The respective mean ages at Q1, Q3 and APS were 54, 65 and 69 years, while the mean time periods to stool collection were 21, 9 and 0 years. Mean HEI-2015 scores increased from Q1 (67 (sd 10)) to Q3 (71 (sd 11)) and APS (72 (sd 10)). Japanese Americans comprised the majority of the study population. A larger proportion of women and normal weight individuals were classified as HEI-2015 tertile 3, whereas men, as well as overweight and obese individuals, were more likely to belong to tertile 1. The Spearman correlation coefficient between Q1 and Q3 was 0·49 (P < 0·0001). Mean total energy intake and alcohol consumption were lower in participants in tertile 3 than 1.
Characteristics of the study population by tertiles of the HEI-2015 at overtime*
(Mean values and standard deviations)

* Healthy Eating Index-2015 (HEI-2015).
† T1 = lowest or first tertile, T2 = intermediate or second tertile, T3 = highest or third tertile.
‡ Individuals who were either past-smokers or current smokers.
Alpha diversity
Alpha diversity as assessed by the Shannon Index (Table 2) was significantly greater across tertiles for diet assessed in Q1 (P < 0·0001), Q3 (P < 0·0001) and APS (P < 0·02). The difference between tertiles 1 and 3 was approximately 1 % for both Q1 and Q3. This trend was also seen for PD Whole Tree, but was only significant for diet assessed at Q1 (P = 0·002). There were no significant associations of the Chao1 index with diet quality at any point in time.
Mean (95 % CI) for diversity measures by tertiles of HEI-2015 over time*
(Mean values and 95 % confidence intervals)

* Healthy Eating Index-2015 (HEI-2015) as independent variable; adjusted means obtained by linear regression for diversity indices; values shown are as means (95% CI) adjusted for sex, age at stool collection in 2013–2016, ethnicity, BMI (kg/m2), total energy intake (log-transformed), physical activity (hours/day), smoking status (never/ever), antibiotic use in past year (yes/no) and alcohol intake
† T1=lowest or first tertile, T2=intermediate or second tertile, T3=highest or third tertile
‡ P trend obtained with HEI-2015 as continuous variable and adjusted for sex, age at stool collection, ethnicity, BMI, total energy intake (log-transformed), physical activity, smoking status, antibiotic use in past year and alcohol intake
Phyla
Of the 10 phyla, Firmicutes had the highest mean relative abundance (54 %), followed by Bacteroidetes (40 %) and Proteobacteria (3 %) (data not shown). Although only the HEI-2015 assessed at the time of stool collection showed a significant inverse relation with Actinobacteria, all regression coefficients describing the difference in relative abundance per one unit of the HEI-2015 score were in the same direction (Table 3). Diet quality at Q1 was positively associated with the presence of Firmicutes but not with diet assessed at stool collection. A significant inverse association of the HEI-2015 with Proteobacteria was only seen for diet at stool collection.
Phyla associated with HEI-2015 among participants at 3 points in time*

* Healthy Eating Index-2015 (HEI-2015) as independent variable.
† Regression parameter obtained by linear regression for 10 phyla with Bonferroni adjusted significance (P < 0·005); values shown are as means (95 % CI) adjusted for sex, age at stool collection in 2013–2016, ethnicity, BMI (kg/m2), total energy intake (log-transformed), physical activity (hours/day), smoking status (never/ever), antibiotic use in past year (yes/no) and alcohol intake.
‡ P trend obtained with HEI-2015 as continuous variable and adjusted for sex, age at stool collection, ethnicity, BMI, total energy intake (log-transformed), physical activity, smoking status, antibiotic use in past year and alcohol intake.
Genera
Of the 152 genera, the following had a relative abundance of at least 1 %: Bacteroides (28 %), Faecalibacterium (9·4 %), Parabacteroides (1·5 %), Ruminococcus 1 (1·5 %), Lachnoclostridium (1·1 %) and Escherichia-Shigella (1·0 %). The genera Eubacterium xylanophilum and Tyzzerella had the highest zero prevalence (26·7 % and 17·8 %). Among the 152 bacterial genera, twenty eight were significantly associated with diet as assessed in at least one of the questionnaires (online Supplemental Table S1). At the phylum (family) level, they were twenty-three families in Firmicutes (12 Lachnospiraceae, 9 Ruminococcaceae, 1 Christensenellaceae and 1 Erysipelotrichaceae), three in Bacteroidetes (Bacteroidaceae, Marinifilaceae and Tannerellaceae), one in Actinobacteria (Coriobacteriaceae) and one in Proteobacteria (Enterobacteriaceae).
Specifically, twelve genera were significantly associated with diet quality assessed at all three time points as shown by the regression coefficients for relative abundance per one unit of the HEI-2015 score (Table 4), while six genera were significantly related to diet from two questionnaires and ten with one (online Supplemental Table S1). However, the regression coefficients were in the same direction and of similar magnitude across time even when statistical significance was not reached. For ten out of the twelve significant genera, the regression coefficients were greatest at APS with 12–88 % lower values at Q1 and intermediate estimates at Q3. The exception was Escherichia-Shigella: the inverse association was only significant for diet as assessed at stool collection, and the coefficient was greater at that time than with diet at Q1 and Q3 (–0·023 v. −0·008 and −0·004). Of the twelve consistent bacterial genera (Table 4), seven (Anaerostipes, Coprococcus 2, Eubacterium eligens group, Lachnospira, Lachnospiraceae ND3007 group, Ruminococcaceae UCG-013 and Ruminococcus 1) showed positive associations and five (Collinsella, Parabacteroides, Ruminiclostridium 5, Ruminococcus gnavus group and Tyzzerella) showed inverse associations with diet quality.
Genera associated with HEI-2015 across all three questionnaires*

* Healthy Eating Index-2015 (HEI-2015) as independent variable; regression parameters obtained by linear regression for 152 genera with Bonferroni adjusted significance (P < 0·00033).
† Relative abundance of the genera based on the total sum of the bacteria.
‡ Percent zero prevalence of genera.
§ β = regression parameter and P trend from trend tests with HEI-2015 as continuous variable and adjusted for sex, age at stool collection, ethnicity, BMI, total energy intake (log-transformed), physical activity, smoking status, antibiotic use in past year and alcohol intake.
Change in diet quality
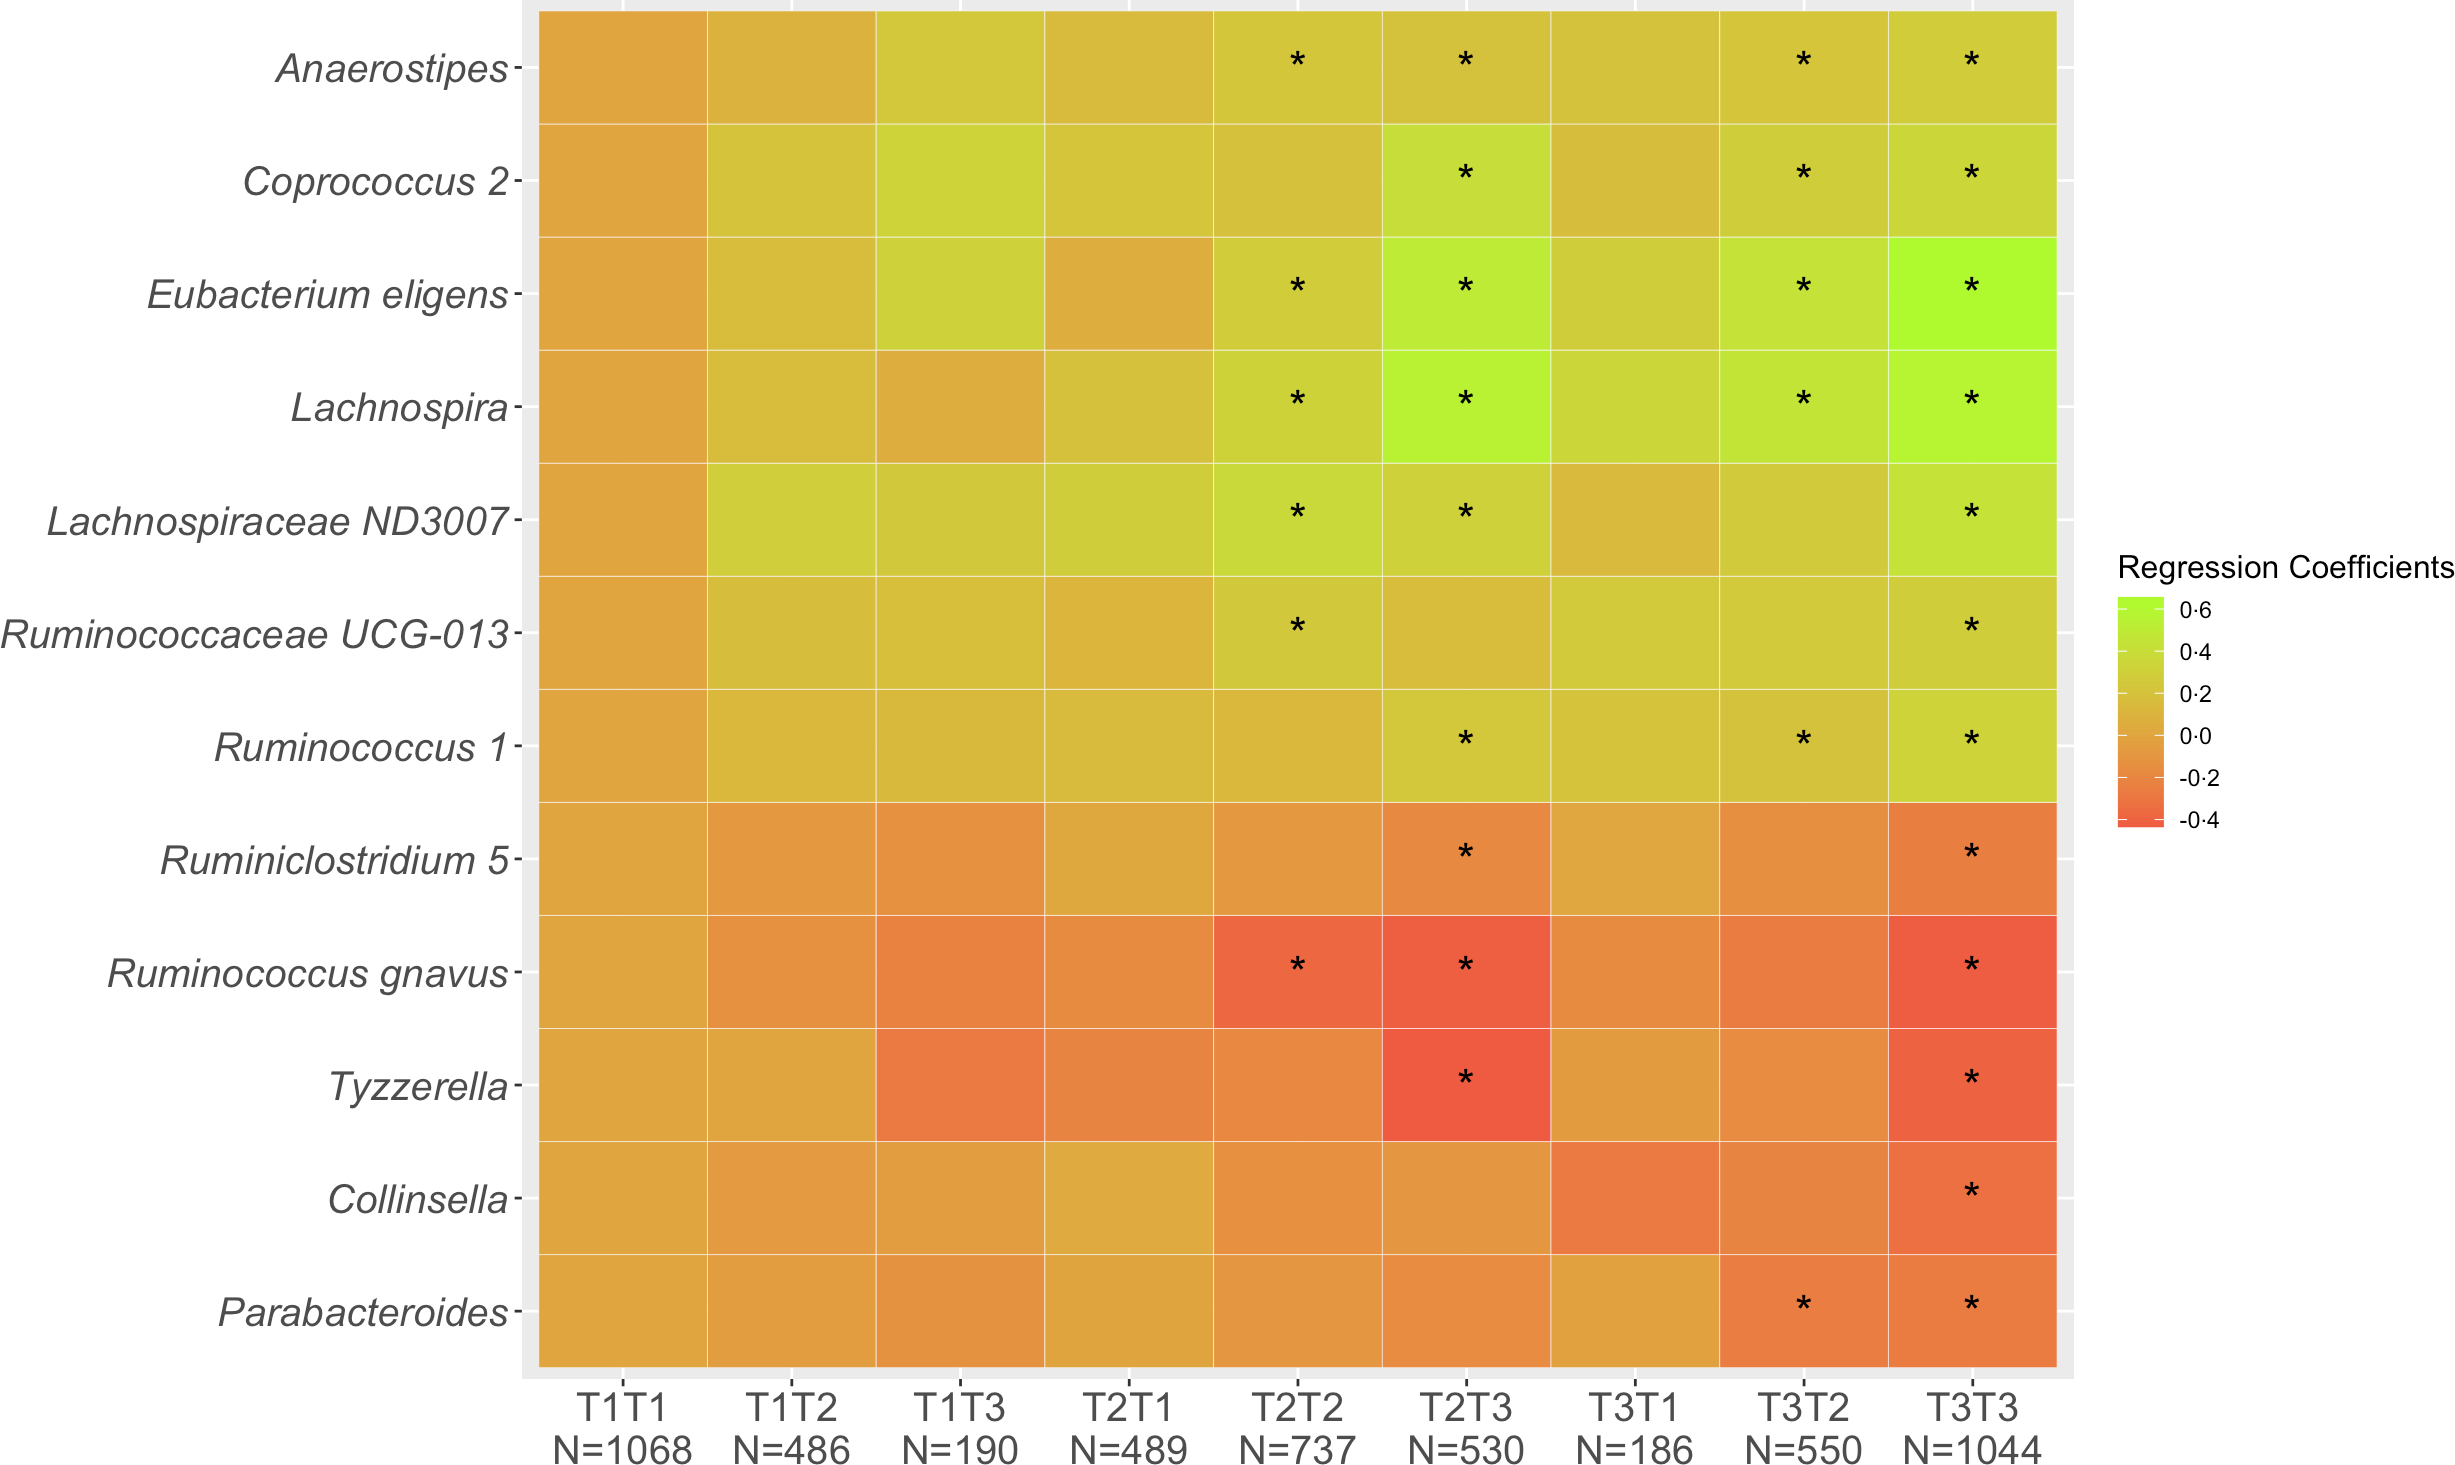
Of the 5280 participants who completed Q1 and Q3, 2849 (54 %) remained in the same tertile of diet quality, 1225 (23 %) shifted to a lower and 1206 (23 %) to a higher tertile. These proportions were very similar across ethnic groups with 53–55 % of cohort members remaining in the same tertiles, 19–28 % decreasing and 19–26 % increasing. Looking at change in diet quality between Q1 and Q3 (Fig. 1), the associations across the nine categories from T1T1 to T3T3 with T1T1 as reference became stronger compared with the cross-sectional associations as evaluated by the regression estimates. The magnitude of changes became smaller for the five inverse associations (Collinsella, Lachnospira, Parabacteroides, Ruminiclostridium 5, Ruminococcus gnavus, Tyzzerella) and gradually greater for the seven positive associations (Anaerostipes, Coprococcus 2, Eubacterium eligens, Lachnospira, Lachnospiraceae ND3007, Ruminococcaceae UCG-013, Ruminococcus 1). As indicated in the heat map (Fig. 1), being in the highest tertile for Q3 predicted strong positive associations for Coprococcus 2, Eubacterium eligens group and Lachnospira and inverse associations for Ruminococcus gnavus group and Tyzzerella even for participants with lower diet quality at Q1.
Associations of 12 genera with tertiles of HEI-2015 at Q1 and Q3. Values shown are regression coefficients obtained by multiple linear regression, which indicate the difference in relative abundance of each genus per category of combined HEI-2015 (T1T1, etc.) with T1T1 as reference. The β estimates were adjusted for sex, age at stool collection, ethnicity, BMI, total energy intake (log-transformed), physical activity, smoking status, antibiotic use in past year and alcohol intake. The asterisk symbol (*) indicates significance (P < 0·05).
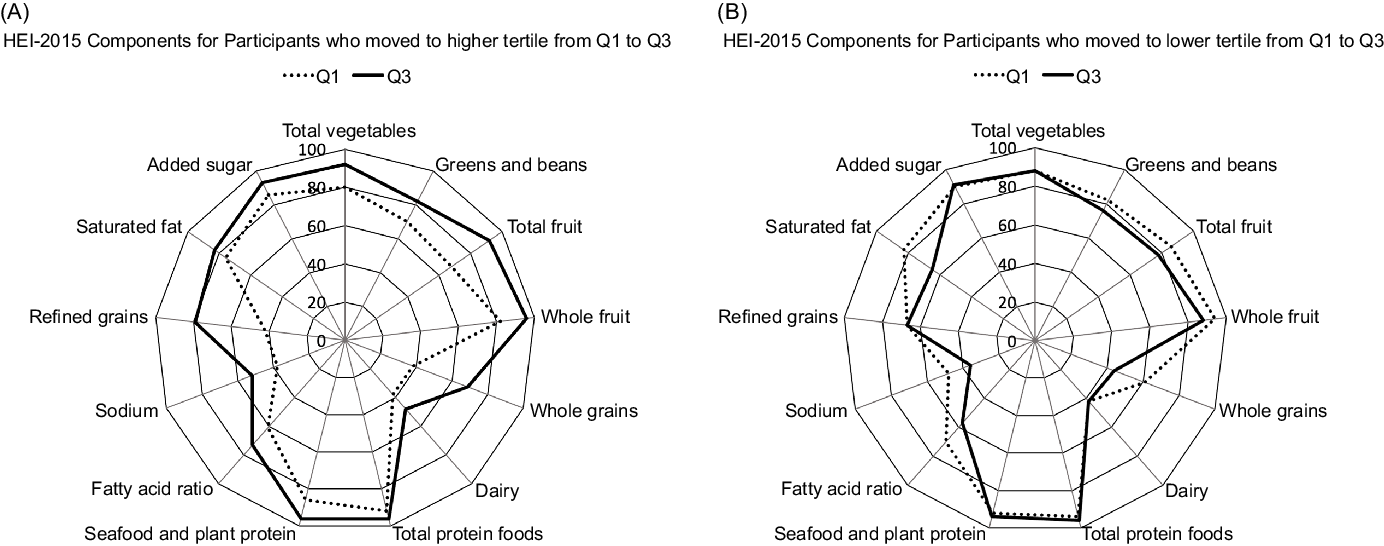
As to the HEI-2015 components responsible for a change in tertiles, participants who moved to a higher tertile from Q1 to Q3 (Fig. 2A) showed stronger adherence to the whole grains and refined grains recommendations but also improved their scores for the total vegetables, total fruits, greens and beans and dairy categories. On the other hand, participants with a lower tertile at Q3 than Q1 (Fig. 2B) showed worse adherence to the saturated fat, fatty acids and whole grain components.
Radar graphs representing the 13 component scores of the Healthy Eating Index-2015 (HEI-2015) in Q1 and Q3 among participants who increased (A) and decreased (B) diet quality from Q1 to Q3. The percentages represent the mean HEI-2015 score divided by the maximum score per category.
Discussion
In the current analysis, higher diet quality measured at three points in time over approximately 30 years was associated with greater α diversity as indicated by the Shannon index although the absolute differences across tertiles of the HEI-2015 were small (around 1 %). After Bonferroni adjustment, the abundance of twenty-eight genera was significantly associated with diet assessed in at least one questionnaire; the majority belonged to the Lachnospiraceae or Ruminococcaceae families of the Clostridiales order (online Supplemental Table S1). Of these, twelve genera were associated with diet quality as assessed at all three time points (Table 4): Anaerostipes, Coprococcus 2, Eubacterium eligens group, Lachnospira, Lachnospiraceae ND3007 group, Ruminococcaceae UCG-013, Ruminococcus, Collinsella, Parabacteroides, Ruminiclostridium 5, Ruminococcus gnavus group and Tyzzerella. The fact the strength of the association as assessed by the regression coefficient for ten of the significant twelve genera were remained quite stable supports the importance of long-term dietary exposure in shaping gut microbial composition although diet close to stool collection shows a stronger association.
Combined diet quality as assessed in Q1 and Q3 (Fig. 1) indicated trends, positive for some and inverse for other bacteria, in the abundance of the twelve genera for participants reporting higher diet quality at both time points and in particular when closer to stool collection as compared with those with low HEI-2015 scores at Q1 and Q3. The availability of repeated dietary information and the analysis of change in diet can be considered novel in comparison with previous publications reporting on diet quality and the gut microbiome(Reference Maskarinec, Hullar and Monroe8,Reference Ericson, Brunkwall and Hellstrand9,Reference De Filippis, Pellegrini and Vannini11–Reference Mitsou, Kakali and Antonopoulou13) .
The current findings are consistent with a previous MEC report that found α diversity to be significantly associated with better diet quality(Reference Maskarinec, Hullar and Monroe8). However, the importance of the very small change or lack of change in α diversity seen here and in previous reports(Reference Maskarinec, Hullar and Monroe8,Reference Ericson, Brunkwall and Hellstrand9,Reference Laitinen and Mokkala30,Reference Yu, Nguyen and Yang31) is not clear. A review of dietary intervention studies also detected a limited effect on microbial diversity across studies and suggested that an increase in microbial diversity in already healthy people may not be as important as among diseased individuals(Reference Willis and Slavin32).
The fibre-fermenting bacteria of the phylum Firmicutes, such as Lachnospira and Ruminococcus, identified here and in the previous report(Reference Maskarinec, Hullar and Monroe8), are able to metabolise dietary plant polysaccharides to produce SCFA, such as butyrate, propionate and acetate, which act as a major energy source for intestinal epithelial cells and strengthen the mucosal barrier(Reference Singh, Chang and Yan33), possibly with beneficial effects on glucose metabolism and inflammation(Reference Ericson, Brunkwall and Hellstrand9). Lachnospira is one of the core genera of the GM and the only Firmicutes besides Faecalibacterium and Eubacterium with the ability to degrade pectins(Reference De Filippis, Pellegrini and Vannini11).
The greater abundance of members from the Lachnospira/Lachnospiraceae ND3007 group is also consistent with previous reports showing a positive relation with a health-conscious diet characterised by fibre-rich and plant-based food(Reference Ericson, Brunkwall and Hellstrand9), a vegetarian pattern(Reference De Filippis, Pellegrini and Vannini11), a prudent dietary pattern(Reference Shikany, Demmer and Johnson34) and a validated index of diet quality(Reference Laitinen and Mokkala30). Similarly, the bacteria Ruminococcaceae UCG-013/Ruminococcus were more abundant among individuals with a fibre-rich diet(Reference So, Whelan and Rossi35) and on a high-quality diet(Reference Laitinen and Mokkala30). However, in two other reports, their abundance was higher for consumers of a Western pattern, which is characterised by high consumption of processed meats, refined grains, potatoes, eggs, sweets and salty snacks(Reference Shikany, Demmer and Johnson34), omnivores(Reference De Filippis, Pellegrini and Vannini11), an animal-based diet(Reference David, Maurice and Carmody36) and a pro-inflammatory diet(Reference Zheng, Hoffman and Chen37). The differences across studies may be due to the fact that particular species within a particular genus have different functions and that specific bacteria use different types of dietary fibres as substrates for SCFA production(Reference Adamberg, Jaagura and Aaspollu38,Reference Makki, Deehan and Walter39) . This suggests that variation in fibre intake can influence the selection of bacteria with similar functions(Reference Ericson, Brunkwall and Hellstrand9) and may explain why within the Lachnospiraceae group, E. eligens and Lachnospira were both positively associated with diet quality, but Roseburia was not seen as one of the significant genera as in other reports(Reference Ericson, Brunkwall and Hellstrand9).
The positive association of diet quality with the Eubacterium eligens group agrees with its higher abundance among those with a vegetarian diet in Thailand(Reference Ruengsomwong, La-Ongkham and Jiang40). Although we are not aware of any connections with diet for Ruminococcus gnavus, it is known that this organism is involved in non-alcoholic fatty liver disease(Reference Alferink, Radjabzadeh and Erler41). Also diets rich in animal products have been associated with Collinsella and Ruminococcus gnavus, two pro-inflammatory genera(Reference van Soest, Hermes and Berendsen42). For Ruminiclostridium 5, which was inversely associated with diet quality, the only report in humans we identified suggested that the relative abundance of Ruminiclostridium_9 increased during a whole wheat diet as compared with a refined wheat diet(Reference van Trijp, Schutte and Esser43).
In addition, Anaerostipes, a fermenting organism, was positively associated with the aMED and DASH in our previous report(Reference Maskarinec, Hullar and Monroe8) and with different diet indices in a recent report from the Personalized Responses to Dietary Composition Trial (PREDICT 1) study(Reference Asnicar, Berry and Valdes14). Coprococcus 2, also a fermenting organism, was positively associated with the DASH in our previous report(Reference Maskarinec, Hullar and Monroe8), a validated index of diet quality among pregnant women with excess weight(Reference Laitinen and Mokkala30) and a vegetarian diet in Thailand(Reference Ruengsomwong, La-Ongkham and Jiang40). The inverse relation to a Western diet among older community-dwelling men(Reference Shikany, Demmer and Johnson34) is also consistent, but the inverse association with a plant-based pattern in a dietary modification trial contradicts the idea of its beneficial influence(Reference David, Maurice and Carmody36). Similar to in this report, a higher abundance of Tyzzerella, which has been associated with cardiovascular disease(Reference Kelly, Bazzano and Ajami44), was seen for lower scores of the HEI(Reference Liu, Ajami and El-Serag10).
The only significant member of the phylum Actinobacteria, Collinsella was inversely associated with diet across time periods in the current analysis and with higher scores of four indices (HEI-2010, AHEI, DASH and aMED) among APS participants(Reference Maskarinec, Hullar and Monroe8). A prudent pattern, characterised by high consumption of fruits, vegetables, nuts, fish and chicken and turkey, among older community-dwelling men showed similar findings(Reference Shikany, Demmer and Johnson34). Collinsella is known to be associated with low fibre diets(Reference Adamberg, Jaagura and Aaspollu38) and result in inflammatory status(Reference van Soest, Hermes and Berendsen42) , fatty liver(Reference Astbury, Atallah and Vijay45) and related diseases(Reference Menni, Louca and Berry46). Escherichia-Shigella was associated with diet quality at the time of stool collection only (online Supplemental Table S1). This may be due to the higher mean age of participants who participated in the APS as it is well known that ageing increases the likelihood to acquire these bacteria due to lower immunity or medication use(Reference Brussow47–Reference O'Sullivan, Coakley and Lakshminarayanan49).
Parabacteroides, the only significant Bacteroidetes, is involved in bile acid metabolism, fat degradation and protein digestion and showed contradictory findings. Our inverse relation agrees with a report that Parabacteroides were part of a cluster that increased on a diet rich in animal foods(Reference David, Maurice and Carmody36) and an inverse association with a vegetarian diet in Thailand(Reference Ruengsomwong, La-Ongkham and Jiang40). However, their abundance was greater with a higher HEI-2005 score in colonic mucosa-associated GM among healthy individuals(Reference Liu, Ajami and El-Serag10). Bacteroides are known to be associated with consumption of animal protein, a variety of amino acids and saturated fat, which represent a more Westernised diet(Reference Wu, Chen and Hoffmann3).
An increasing number of studies have indicated that dietary components may influence or shift the composition of the GM with the potential of beneficial health effects, such as prevention of CVD and obesity, potentially through alteration in host immunity and metabolic activity(Reference Singh, Chang and Yan33). As shown in the current analysis, a high-quality diet, as assessed by the HEI-2015, maintained over many years predicted a GM composition that included several bacteria that have been associated with favourable health effects. As diet quality closer to the time of stool collection had a stronger association with the GM, changes in dietary quality even at an older age may be beneficial(Reference Wilmanski, Diener and Rappaport50,Reference Jeffery, Lynch and O'Toole51) . However, the current results suggest that a consistently high-quality diet over time predicts the most favourable pattern of gut bacteria. Although the number of years between diet quality assessment and stool collection varied, the strength of the associations remained similar across the three questionnaires, supporting the long-term effects of diet on the characteristics of the GM and the stability of dietary habits over time. Alternatively, a certain diet quality at a younger age may be formative in the selection of bacteria that will remain part of a person’s GM(Reference Tamburini, Shen and Wu52,Reference Sarkar, Yoo and Valeria Ozorio Dutra53) . This idea is supported by reports that sudden changes in diet temporarily modify the composition and diversity of the gut microbiota before reverting to its original state(Reference Fu, Randolph and Lim2,Reference Valdes, Walter and Segal54) . Although the microbial composition changed in ten subjects randomly controlled for either a high-fat/low-fibre or low-fat/high-fibre diet for 10 days, the dominant genera remained stable over time indicating its strong association with long-term diet(Reference Wu, Chen and Hoffmann3).
The novelty of the current report lies in the long-term observation with repeated assessments of diet quality and the ability to examine changes in diet quality. The larger sample size and the updated reference libraries partially confirm the previous findings(Reference Maskarinec, Hullar and Monroe8) but also make comparisons between the two reports challenging as the different taxonomic classifications of individual bacteria are not analogous. The choice of the HEI-2015 provides a valid and widely used measure of overall diet quality shown to be related to mortality(Reference Panizza, Shvetsov and Harmon7,Reference Harmon, Boushey and Shvetsov55) , type 2 diabetes(Reference Jacobs, Harmon and Boushey56) and colorectal cancer risk(Reference Park, Boushey and Wilkens57). However, several limitations have to be considered in the interpretation of the current findings. Foremost, the one-time collection of stool samples that may have been affected by concurrent disease(Reference Allaband, McDonald and Vazquez-Baeza58) or other events, the known measurement errors of FFQ(Reference Freedman, Schatzkin and Midthune59) and the different sample sizes at each point in time. As the important influence of different medications has been documented(Reference Asnicar, Berry and Valdes14,Reference Weersma, Zhernakova and Fu60) , our lack of detailed use at stool collection may have confounded the current findings. Applying 16S sequencing instead of whole genome shotgun sequencing restricted our ability to identify bacteria at the species level. For a better understanding of metabolic mechanism involved in the relation between diet quality and the GM, the imputation of functional pathways with PICRUSt(Reference Langille, Zaneveld and Caporaso61) or similar tools will provide an assessment of community function and insights into predictive metagenomics in future studies.
The most remarkable finding of the current analysis is the stability of the associations of diet quality as assessed many years before stool collection with characteristics of the GM. Participants who improved their diet quality scores between Q1 and Q3 showed microbial patterns that were comparable to individuals with high HEI-2015 scores at Q3. The quality of past diet, assessed as far as 21 years before stool collection, was equally predictive of GM composition as concurrently assessed diet, indicative of the long-term nature of this relation.
Acknowledgements
We thank the participants for their time to participate in the study.
This work was supported by US National Cancer Institute (NCI) grants P01 CA168530, U01 CA164973, P30 CA071789, P30 CA015704 and UL1TR000130.
Author contributions were as follows: conceptualisation: U. L., L. L. M., J. W. L., M. A. J. H., C. J. B., and G. M.; data curation: L. R. W., K. R. C., I. C. J., and T. W. R.; formal analysis: E. M., G. M.; funding acquisition: L. L. M., L. R. W., M. A. J. H., and J. W. L.; investigation: E. M. and G. M.; methodology: U. L., C. J. B, and T. W. R.; project administration: U. L., L. L. M.; supervision: G. M.; visualisation: E. M.; writing – original draft: E. M.; and writing – review and editing: C. J. B., U. L., L. R. W., V. W. S., M. A. J. H., J. W. L., T. W. R., and L. L. M.
All authors reviewed and approved the final version of the manuscript.
None of the authors reported a conflict of interest.
Supplementary material
To view supplementary material for this article, please visit https://doi.org/10.1017/S0007114521002968


