

INTRODUCTION
Ice shelves and Ice Shelf Water (ISW)
Antarctic ice shelves are floating portions of land-based ice sheets. More than 60% of the Antarctic coast sits alongside ice shelves (Bindschadler and others, Reference Bindschadler2011). The ocean forms a cavity between the ice shelf and the sea floor (Fig. 1). Basal melting occurs beneath all ice shelves, and ice shelves have come to be characterised as ‘cold cavity’ or ‘warm cavity’, depending on whether inflow of High Salinity Shelf Water (HSSW) or Circumpolar Deep Water (CDW), respectively, is the dominant process causing basal melting (e.g. Hattermann and others, Reference Hattermann, Nøst, Lilly and Smedsrud2012; Rignot and others, Reference Rignot, Jacobs, Mouginot and Scheuchl2013). The ‘cold cavity’ and ‘warm cavity’ definitions essentially equate to ‘mode 1’ and ‘mode 2’ of the three-mode characterisation of basal melting described by Jacobs and others (Reference Jacobs, Helmer, Doake, Jenkins and Frolich1992).
Schematic cross-section of a cold-cavity ice shelf, showing the connections between sea-ice formation, water mass formation processes and ice shelf cavity processes.
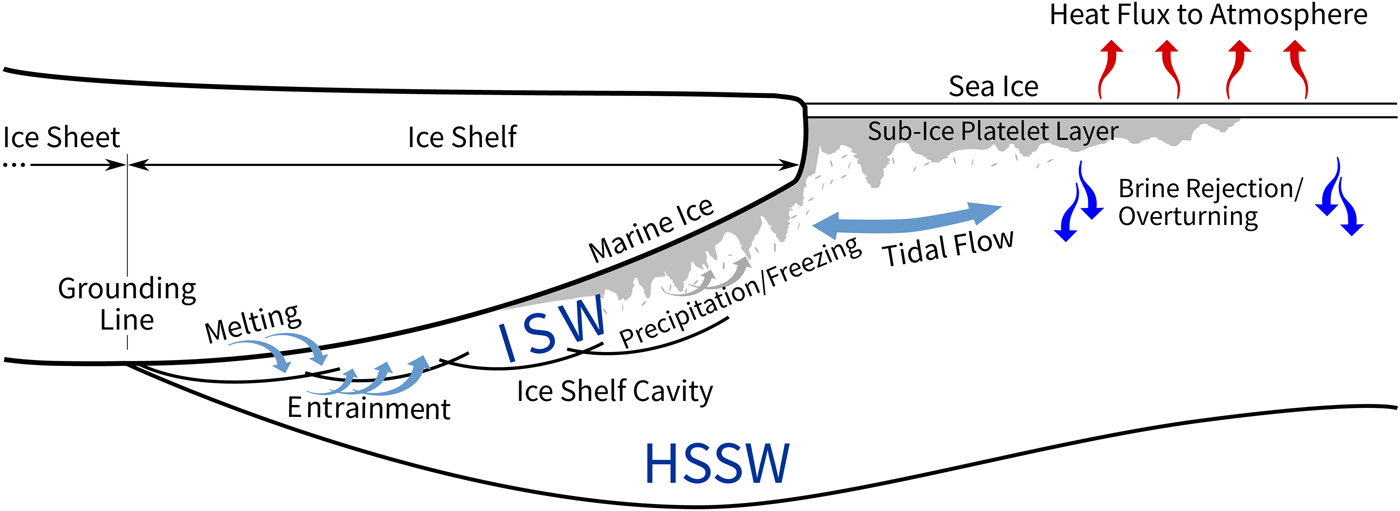
Warm cavity ice shelves such as Pine Island Glacier ice shelf have experienced rapid melting in warm ocean waters (Jacobs and others, Reference Jacobs, Hellmer and Jenkins1996, Reference Jacobs, Jenkins, Giulivi and Dutrieux2011). Cold cavity ice shelves, such as the Ross Ice Shelf being studied here, also experience basal melting, but in this case the heat causing ice melt is due to the pressure dependence of the freezing point and is often accompanied by refreezing at other parts of the ice shelf (Engelhardt and Determann, Reference Engelhardt and Determann1987) or adjacent sea ice (Jeffries and others, Reference Jeffries, Weeks, Shaw and Morris1993; Gow and others, Reference Gow, Ackley and Govoni1998). Figure 1 illustrates major processes occurring under a cold cavity ice shelf. HSSW reaches the deeper parts of the ice shelf near the grounding line and melts ice; the resulting cold, fresh water mixes into the upper part of the HSSW to form ‘Ice Shelf Water’. In this paper, as in others (Jacobs and others, Reference Jacobs, Fairbanks and Horibe1985, Reference Jacobs, Amos and Bruchhausen1970), we shall define ISW as sea water that has the potential temperature below the surface freezing point temperature, and will refer to ISW as exhibiting ‘potential supercooling’, in line with Mahoney and others (Reference Mahoney2011) and earlier papers such as Foldvik and Kvinge (Reference Foldvik and Kvinge1974). As buoyant (due to low salinity) ISW rises along the underside of the ice shelf, and as the pressure decreases, the in situ freezing point temperature rises so that the ISW can become in situ supercooled (as defined in the section In situ supercooled sea water and ISW, below). Ice can then nucleate, forming small frazil crystals in the water column that form marine ice under the ice shelf or platelet ice under the sea ice (Langhorne and others, Reference Langhorne2015).
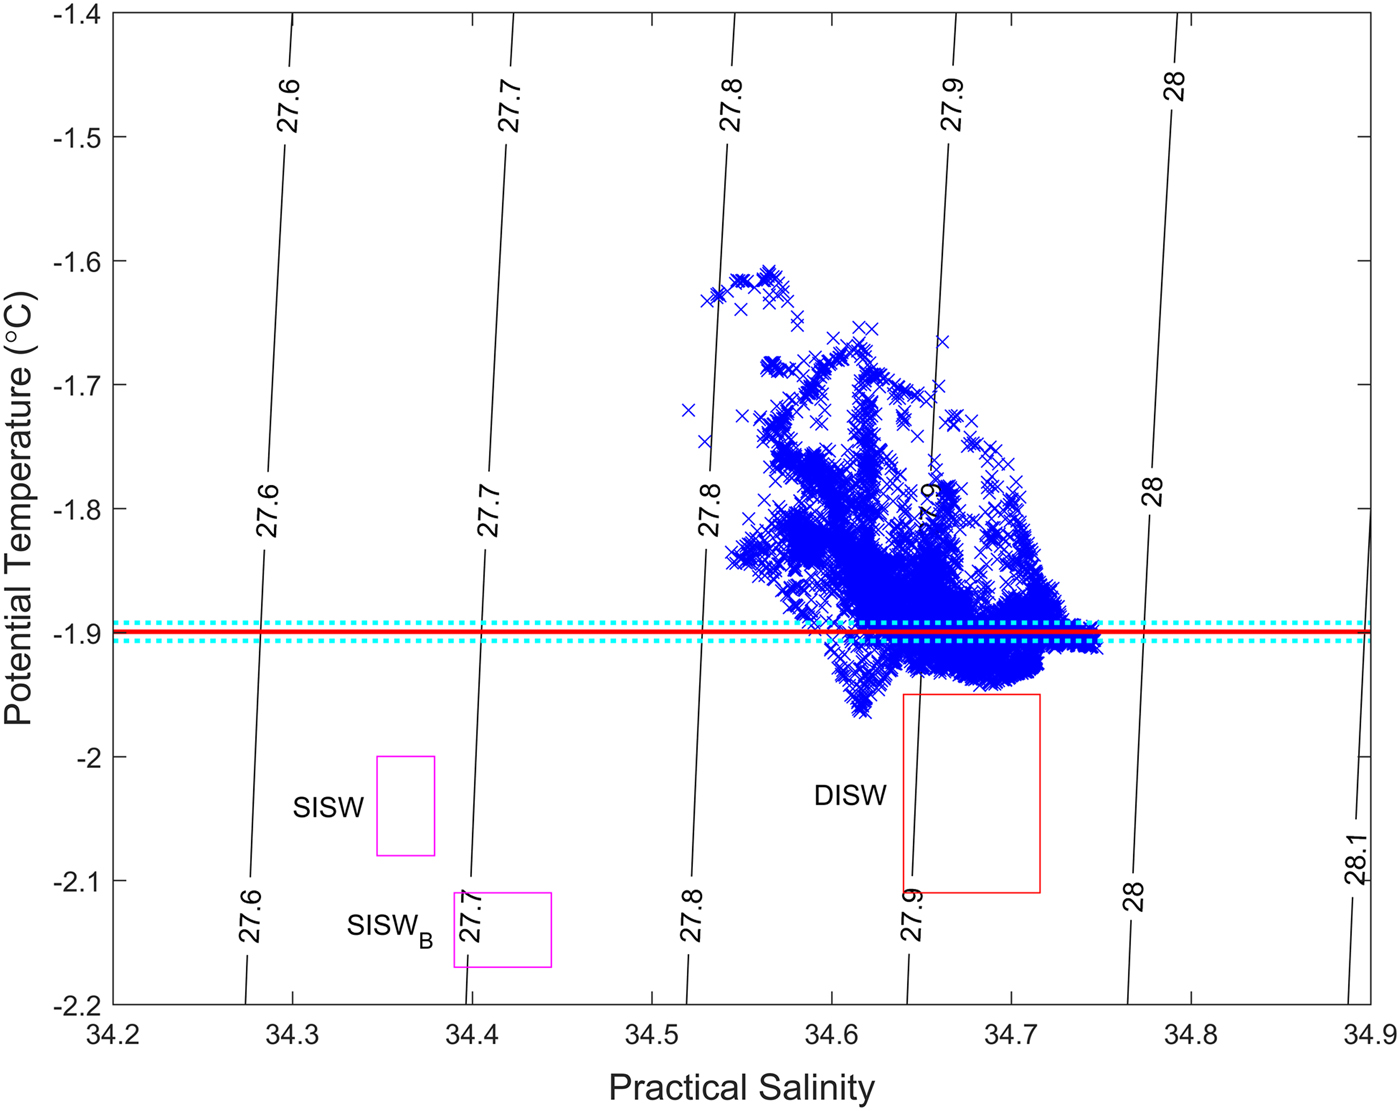
Few direct observations of this process exist under ice shelves; for a rare example of such observations, see images of accreted marine ice at the bottom of boreholes through the Amery Ice Shelf in Craven and others (Reference Craven, Allison, Fricker and Warner2009). For the Ross Ice Shelf, ISW observations from transects along the ice shelf front were reported by Jacobs and others (Reference Jacobs, Fairbanks and Horibe1985) and Smethie and Jacobs (Reference Smethie and Jacobs2005). A single observation of ISW ~460 km south of the Ross Ice Shelf front was obtained from the J9 site beneath the Ross Ice Shelf (Jacobs and others, Reference Jacobs, Gordon and Ardai1979: Coordinates for station NW77-25 from Jaocbs and Haines, Reference Jacobs and Haines1982, used to calculate this distance). In addition, in Arzeno and others (Reference Arzeno2014), their figures 3 and 7 indicate ISW was present. Jacobs and others (Reference Jacobs, Fairbanks and Horibe1985) classified ISW into ‘Deep Ice Shelf Water’ (DISW) and ‘Shallow Ice Shelf Water’ (SISW), with a sub-category SISWB for measurements made beneath the Ross Ice Shelf at location J-9. SISW has characteristics (lower salinity, and therefore lower density) indicating that it forms from melting processes near the ice shelf front, whereas DISW has characteristics (higher salinity, and therefore higher density) indicative of formation through basal melting of the ice shelf at depth.
In situ supercooled sea water and ISW
In situ supercooled sea water is sea water that is cooler than its in situ freezing point temperature, which is a function of salinity and pressure (UNESCO, 1978; IOC and others, 2010) and yet remains in a liquid state (e.g., Smith and others, Reference Smith2001; Skogseth and others, Reference Skogseth, Nilsen and Smedsrud2009). ISW is sea water that has potential temperatures below the surface freezing point temperature; ISW may become in situ supercooled if it ascends sufficiently in the water column (e.g., Leonard and others, Reference Leonard2006; Mahoney and others, Reference Mahoney2011).
ISW has been detected in open water and below sea ice using conductivity-temperature-depth sensors (CTDs) (Lewis and Perkin, Reference Lewis and Perkin1983; Mahoney and others, Reference Mahoney2011), and conductivity-temperature sensors (CTs) (Smith and others, Reference Smith2001; Leonard and others, Reference Leonard2011). Due to logistical constraints, measurements directly beneath ice shelves are rare. Supercooled sea water is an occasional phenomenon that occurs at specific places in the polar regions. In Antarctica both potential and in situ supercooling are particularly linked to ice shelf processes (Lewis and Perkin, Reference Lewis and Perkin1986).
The Ross Sea setting
In this paper, we describe oceanographic measurements that identify the presence or absence of ISW and in situ supercooled sea water near and beneath the Ross Ice Shelf. The measurements were made by an underwater glider that travelled beneath the ice shelf front. Late November, December and January, the operational period of the glider, are months when one would expect to observe surface freshening near the ice shelf front in the Ross Sea, due to a seasonal increase in melting under the outer portion of the ice shelf (Arzeno and others, Reference Arzeno2014) and sea ice melt (Jacobs and others, Reference Jacobs, Fairbanks and Horibe1985). The glider was deployed into the Ross Sea Polynya, which is a region that has zero to low sea-ice concentration locally year-round (Bromwich and others, Reference Bromwich, Liu, Rogers, VanWoert, Jacobs and Weiss1998; Reddy and others, Reference Reddy, Arrigo and Holland2007).
At the Coulman High location (see Fig. 2) discussed by Arzeno and others (Reference Arzeno2014), multi-year current meter measurements from under the Ross Ice Shelf have now been obtained (Craig Stewart, pers. comm., 2016). During the months April–November in 2011–14, the currents observed at pressures of 399, 577 and 778 dbar were northwestward, carrying water out of the cavity. In the summer months December–March, mean flow was southwards, into the ice shelf cavity, for these same pressures. The mean flow at 232 dbar, which is near the base of the ice shelf front, was westwards, closely aligned with the terminal face, throughout the year (Craig Stewart, pers. comm., 2016). Arzeno and others (Reference Arzeno2014) published data from an earlier mooring deployment at Coulman High, which included current data from late November 2010 to mid-January 2011, i.e., the same period as the glider collected its data. As the glider was operating during the austral summer, the available data implies the glider would not necessarily encounter an outflow of ISW from under the Ross Ice Shelf. However, the current data presented in Arzeno and others (Reference Arzeno2014) are depth averaged, and therefore it cannot be inferred directly from that paper what the currents near the ice shelf front depth were over this time period.
Glider positions for the period 29 November 2010–30 January 2011 as reported by GPS, overlaid on a NASA MODIS visible band image from (a) 28 November 2010, and (b) 6 December 2010. Blue dots show new GPS locations, i.e., indicate that the glider transmitted a new GPS location for this dive, while red dots indicate repeated GPS locations, i.e., indicate that the glider had the previous transmitted GPS location recorded as its (erroneous) position. Dive 100 is indicated by the yellow dot, and dive 130 by a light green dot. The location of Coulman High is indicated by a dark green dot. Map projection is WGS 84/Antarctic Polar Stereographic. MODIS imagery was provided by the Land, Atmosphere Near real-time Capability for EOS (LANCE) system operated by the NASA/GSFC/Earth Science Data and Information System (ESDIS) with funding provided by NASA/HQ.

METHODS
Equation of State of Seawater 1980 (EOS-80) used in preference to Thermodynamic Equation of Seawater 2010 (TEOS-10)
The International Thermodynamic Equation of Seawater TEOS-10 (IOC and others, 2010; McDougall and Barker, Reference McDougall and Barker2011) replaced the previously accepted marine science description of sea-water properties, EOS-80 (UNESCO, 1981). Some authors have used TEOS-10 (and Conservative Temperature) to examine ISW beneath other ice shelves (e.g., McDougall and others, Reference McDougall, Barker, Feistel and Galton-Fenzi2014); however, to our knowledge, no papers published to date examining ISW beneath the Ross Ice Shelf have used TEOS-10. Our preliminary analysis with CTD casts from other research indicated that in situ supercooling is larger (~0.003 K) when using TEOS-10 compared with EOS-80. Absolute Salinities calculated using TEOS-10 have higher numerical values than measured Practical Salinities; see section 2.8 of IOC and others (2010) for details. To allow intercomparison with earlier work from beneath the Ross Ice Shelf, in particular Jacobs and others (Reference Jacobs, Fairbanks and Horibe1985), we have used EOS-80 in this paper.
Practical Salinity, S P, a ratio of a sea-water sample's electrical conductivity to that of standard sea water's conductivity, has long been the salinity scale used in oceanography (UNESCO, 1981). The ITS-90 temperature scale was an update from ITS-68, and was simply a scalar correction such that T 68 = 1.00024 × T 90 (IOC and others, 2010). However, since in this work we are using the UNESCO (1978) freezing point temperature equation, we need to use ITS-68 to allow for correctly posed supercooling evaluations. ITS-90 values were therefore converted to ITS-68 values. Potential Temperature, θ, is the temperature that the sea water would be if it was raised adiabatically to the surface, and was used to analyse potential supercooling. Potential supercooling is defined as the Potential Temperature minus the surface freezing point temperature (the temperature at which the water would freeze at the sea surface), while in situ supercooling is defined as the in situ temperature minus the in situ freezing point temperature. In both cases, we take the magnitude of potential or in situ supercooling to be defined as the water potential or in situ temperature minus the surface or in situ freezing point temperature, i.e., the water is potential or in situ supercooled if the respective difference is negative.
Seaglider measurements
Over the 2010/11 austral summer, two Seagliders (Eriksen and others, Reference Eriksen2001) were deployed in the Ross Sea (Queste and others, Reference Queste2015). These autonomous devices carried out hundreds of dives each, measuring both physical and biogeochemical properties of the sea water during each dive. The locations for SG503, the glider of interest in this study, are shown in Figures 2 and 3. The primary reason for deploying these gliders was to analyse dissolved oxygen dynamics during a phytoplankton bloom (Queste and others, Reference Queste2015). Operating gliders in a phytoplankton bloom runs the risk of fouling of the CTD, which would have resulted in salinity biases tied to changes in conductivity cell volume as matter clogs the sensor. These biases are often short lived and the glider's flight and surfacing manoeuvres are often sufficient to clear the conductivity cell. However, no evidence of biofouling was observed in the analysed data. Similarly, operating gliders in a region with frazil ice present can lead to salinity biases (false fresher water and therefore lower density signals) due to icing of the electrodes or due to changes in the internal volume of the conductivity cell, with the latter being harder to detect. There was no evidence of frazil ice being present at the locations and times where the glider operations took place. While the manifestation of frazil directly beneath sea ice, known as sub-ice platelet layers, has been observed in parts of the Ross Sea, the underwater glider measurements described here were in a region where we are not aware of any prior reports of sub-ice platelet layer observations (Langhorne and others, Reference Langhorne2015).
Glider GPS positions (red and blue dots, as in Fig. 2) and contours of ice shelf draft (thickness minus elevation, corrected to the geoid) derived from the Bedmap2 dataset (Fretwell and others, Reference Fretwell2013). The most northerly blue dot on this figure corresponds to dive 78. Coastlines and ice shelf edge (shown in dashed black) are from the SCAR Antarctic Digital Database (Scientific Committee on Antarctic Research, 2016). Coulman High is marked as a green dot.

Glider SG503 was deployed east of Ross Island on 29 November 2010 and recovered on 30 January 2011. SG503 was thought to have strayed under the Ross Ice Shelf in the early part of the deployment, before it travelled north and then east, twice carrying out a bowtie-shaped formation (Fig. 2). The investigation in this paper focused mainly on the early data (dives 1–130) collected by SG503. The data from SG502 was not used as it did not get swept under the Ross Ice Shelf, this paper's area of interest.
The properties logged by SG503 that are of particular interest to this investigation were in situ temperature (ITS-90, which we convert to ITS-68; see the section Equation of State of Seawater 1980 (EOS-80) used in preference to Thermodynamic Equation of Seawater – 2010 (TEOS-10)), electrical conductivity, pressure, GPS location and time. The glider was programmed to surface at the end of each dive to communicate with a satellite and accurately log its position using its on-board GPS. Raw data from the glider were processed using the UEA Seaglider Toolbox (bitbucket.org/bastienqueste/uea-seaglider-toolbox, last accessed 10 March 2017). Conductivity data were corrected for thermal hysteresis using the method described in Garau and others (Reference Garau2011) using the Seaglider flight model regressed following a method adapted from Frajka-Williams and others (Reference Frajka-Williams, Eriksen, Rhines and Harcourt2011). Uncertainties in temperatures and Practical Salinities were estimated by assuming that the glider CTD package had undergone 12 months of use since calibration and had drifted by 0.006°C and 0.07, respectively, in accordance with the manufacturer's specifications (http://www.seabird.com/glider-payload-ctd, accessed 13 March 2017). The temperatures encountered by the glider were within the manufacturer's stated measurement range but out of their calibration range, leading to larger uncertainty estimates than for instruments from the same manufacturer used by Smith and others (Reference Smith2001) and Leonard and others (Reference Leonard2006). The error in surface freezing point temperature was then estimated by taking the stated uncertainty for the equation from UNESCO (1978) of 0.003°C and applying the treatment of random errors as described by Barry (Reference Barry1991). This method takes the partial derivatives of the freezing point temperature equation with respect to S and takes the square root of the sum of the squares of each of the components of the derivative. The maximum and minimum observed salinities were used as input values to this equation. The resulting estimate of uncertainty in surface freezing point temperature was 0.007°C. Drift in the pressure sensor and effects of these on potential temperature and in situ freezing point temperature calculations were assumed to be minimal, so that the uncertainties in potential temperature and in situ freezing point temperature were assumed to be the same as for temperature and surface freezing point temperature, i.e., 0.006°C and 0.007°C, respectively.
Glider data acquisition and processing
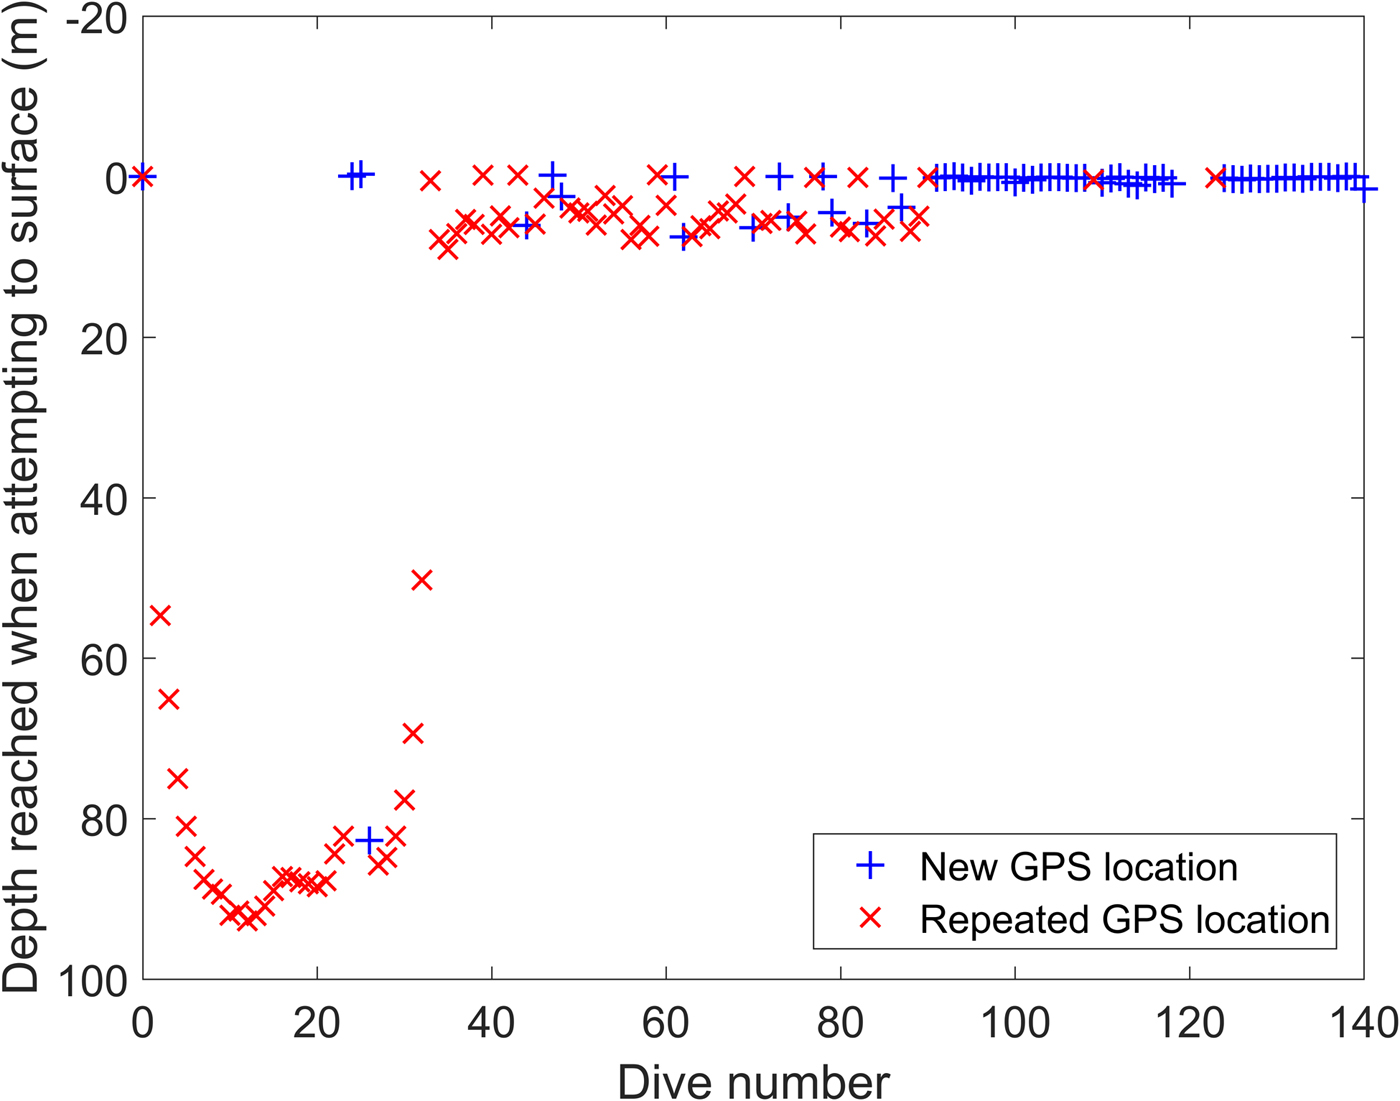
Of the first 100 dives carried out by SG503, only 25 ascended to within 1 m of the sea surface (Fig. 4). Note that the measurements from the first dive were not logged properly, so subsequent analysis is of profiles from dive 2 onwards. For most of the first 31 dives, the glider rose to a reasonably consistent depth, between 80 m and 95 m below the sea surface, which suggests it was under something obstructing its ascent. The only object nearby that was likely to have obstructed the glider's ascent is the Ross Ice Shelf which, near the location of the glider's deployment (Fig. 3), has an ice draft that is comparable with the minimum depth for these dives. The analysis of water properties in this paper is therefore divided into two groups: (i) dives that were definitely under the ice shelf and dives thought to be in open water near the ice shelf front and (ii) dives that occurred in open water away from the ice shelf front. Dives thought to be under sea ice are excluded from the analysis. A potential temperature versus salinity diagram for dives 2–31 of SG503 is shown in Figure 5, with SISW and DISW boundaries from Jacobs and others (Reference Jacobs, Fairbanks and Horibe1985) marked on the plot.
The shallowest depth reached by glider SG503 when attempting to surface for its first 140 dives. Dives 1–100 occurred in the period 29 November to 6 December 2010, with dive 140 occurring on 10 December 2010.
Potential temperature versus salinity plot for dives 2–31 of glider SG503 (blue crosses). Potential density contours (black lines) are referenced to 0 dbar. The thick red line is the surface freezing point temperature, while cyan error bars give error in surface freezing point temperature calculations (partly due to the errors in measuring salinity, and partly due to the error in the freezing point temperature equation itself – see the section Seaglider measurements). The ranges of potential temperature and salinity for SISW, SISWB (magenta boxes) and DISW (red box) are averages plus or minus 1σ for the Ross Sea from Jacobs and others (Reference Jacobs, Fairbanks and Horibe1985).
Note that in Figure 4, the blue cross near 80 m is from dive 26, which is a dive that started at the surface before becoming trapped under the ice shelf and therefore ending at depth. A unique GPS fix is therefore attributed to that dive from when it was at the surface, along with the depth where it finished the upward part of its dive cycle (also known as the ‘climb’). ‘New GPS location’ indicates that the glider transmitted a new GPS location for this dive, while ‘Repeated GPS location’ indicates that the glider had the previous transmitted GPS location recorded as its (erroneous) position. Dives 24 and 25 both end at the surface (although the start of Dive 24 is at depth), so those two dives have both a unique GPS fix and a surface depth associated with them.
At the end of each dive the glider must change its buoyancy in order to commence the next dive. There was a notable difference in the turning behaviour when comparing dives in open water near and away from the ice shelf with dives under the Ross Ice Shelf (Fig. 6). When the glider is functioning properly in open water, it rises to the surface and stops recording dive data while changing its buoyancy and carrying out communications, before diving again (Eriksen and others, Reference Eriksen2001). The data transmission process is automated (i.e., not controlled by the glider pilot): the glider has a number of call tries pre-programmed in. If it fails to connect that number of times, it dives again. If it connects but does not transfer everything, it resets the counter and tries again. It also tries to send whatever past data has not been sent. Figure 6a,b shows the pause in data collection while the glider was at the surface in open water away from the ice shelf; the time between dives was ~7.5 min, which is a standard call. When the glider appears to have exited the ice shelf cavity after having been trapped there for ~1.8 days (Fig. 6c), the time between dives was longer, 17–19 min, presumably due to having more data to transmit. When the glider appears to have been trapped under the ice shelf, it took much less time before the data collection ceased and its buoyancy changed (Fig. 6d); the time between dives was ~2 minutes, which is the time taken to try a few calls and fail.
Change in depth of SG503 in different locations. (a) and (b) Open water dives away from the ice shelf, where panel (a) shows full depth and panel (b) shows the top 120 m; (c) Dives both near the ice shelf and beneath the ice shelf; (d) Dives under the Ross Ice Shelf. The panels show: (a) and (b) dives 200–205; (c) the end of dive 22 to the start of dive 28, where the end of dive 24, dive 25 and the start of dive 26 are in open water near the ice shelf; (d) dives 2–4.

MODIS imagery (Fig. 2) was used to attempt to discern the nature of the sea surface during the period when SG503 was prevented from reaching the surface (see Fig. 4). Cloud-free images of this region were only available on 28 November and 6 December 2010. Although the glider's surface track appears to be seaward of the obvious pack ice to the west, there may have been some flooded thin ice remaining above the glider path that is not well resolved by the MODIS sensors.
The glider typically travelled between ~1 km and 2 km between dives when the GPS was functioning correctly (blue dots). The GPS data suggest that the glider travelled farther north than expected; see Figure 2, where the red dots to the north of the eastward blue trajectory are ~60 km north of their expected location. We interpret these position estimates as GPS malfunctions, which may have been due to sea-ice cover or, based on experience on the iSTAR Ocean2Ice campaign (Heywood and others, Reference Heywood2016), contamination of GPS signals from ice on the antenna or a few cm of water interfering with the signal transmission. The suspect coordinates are therefore very low accuracy positions, accurate to tens of km.
Results
Measurements under the ice shelf
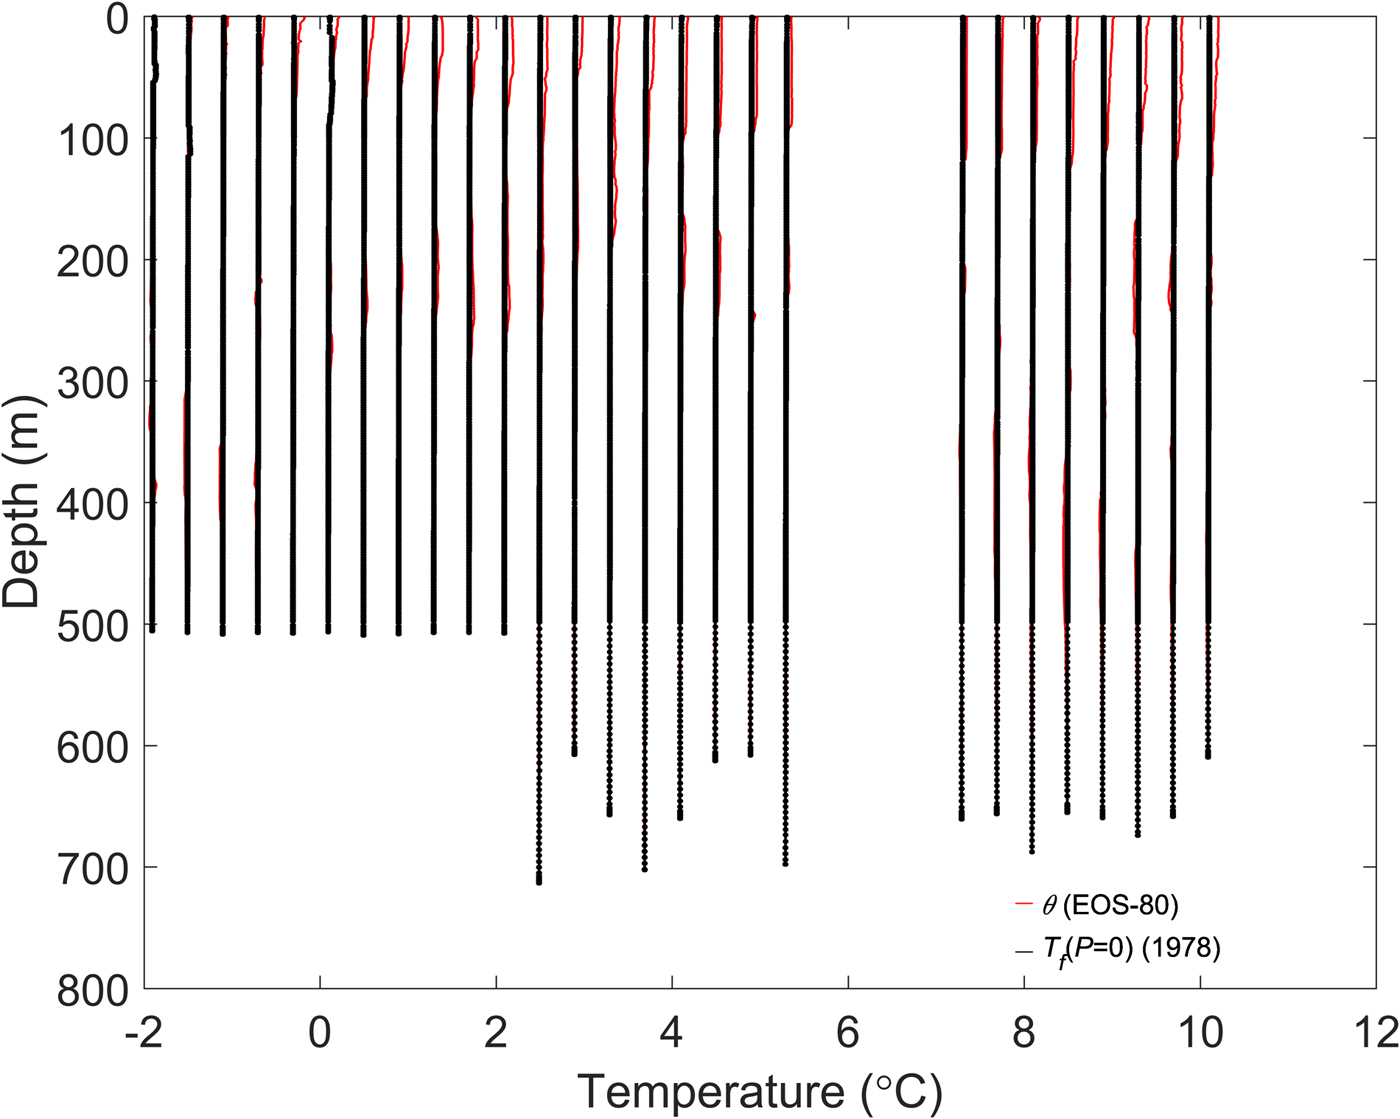
For the first 30 logged dives, when the glider appears to have been under the ice shelf, water was not in situ supercooled at any depth (Fig. 7a). However, water that exhibited potential supercooling (ISW), when allowing for the uncertainties, was found over various depth ranges for dives 4–23 (Fig. 7b), i.e., the dives under the ice shelf that were likely further from the ice shelf front. Analysis of the thickness of ISW layers (where present) for dives as shown in Figure 8 was by taking the difference between the depths at which the lower bound of the surface T f (P = 0) (surface freezing point temperature: black lines) and the upper bound of θ (potential temperature) intersected; for example for dive 12 this is 375.7 m−320.0 m = 55.7 m and 304.4 m-231.5 m = 72.9 m. These thicknesses were then rounded to the nearest metre. The stated thicknesses of ISW layers are, therefore, lower limits. Each dive record contains both the downward and upward portion of the dive, and since the glider is moving horizontally as well as vertically, the same water mass is not necessarily being sampled within one ‘dive’. For clarity, Figures 7a,b and 8 only show data from downwards dives. Upwards dives showed very similar characteristics. Note that the glider did reach the surface at the end of dives 24 and 25. This indicates that the glider exited the ice shelf cavity briefly for those dives, then re-entered the ice shelf cavity temporarily before finally exiting for the remainder of its deployment.
(a) In situ freezing point temperatures (T f : black lines, calculated from measured salinity and pressure) and in situ temperature (T: red lines, each of which always lie to the right of the corresponding black line) for dives 2–31 of glider SG503, where dive 2 has the correct temperature scale and subsequent dives are displaced 0.4°C to the right of each other to allow comparisons. Approximate uncertainties in T f and T are ±0.007°C and ±0.006°C, respectively. All in situ temperatures are higher than the in situ freezing point temperatures for these dives, indicating that no in situ supercooling was present for these dives. The data have been quality controlled, resulting in removal of data from the very top and bottom of most dives, as well as some central parts. (b) T f (P = 0) (surface freezing point temperature: black lines, calculated from measured salinity) and θ (potential temperature: red lines) for dives 2–31 of glider SG503, where dive 2 has the correct temperature scale and subsequent dives are displaced 0.4°C to the right of each other to allow comparisons. Approximate uncertainties in T f (P = 0) and θ are ±0.007°C and ±0.006°C, respectively. ISW is present where potential supercooling exists, i.e., where potential temperatures are lower than surface freezing point temperatures (see Fig. 8 for zoomed in examples). The data have been quality controlled, resulting in removal of data from the very top and bottom of most dives, as well as some central parts.

T f (P = 0) (surface freezing point temperature: black lines, calculated from measured salinity) and θ (potential temperature: red lines) for dives 6 (thin ISW layer present), 12 (more than one layer of ISW present), 15 (thick ISW layer present) and 24 (no ISW present) of glider SG503. Approximate uncertainties in T f(P = 0) and θ are ±0.007°C and ±0.006°C, respectively. ISW is present where potential supercooling exists, i.e., where potential temperatures are lower than surface freezing point temperatures. The data have been quality controlled, resulting in removal of data from the very top and bottom of most dives, as well as some central parts.
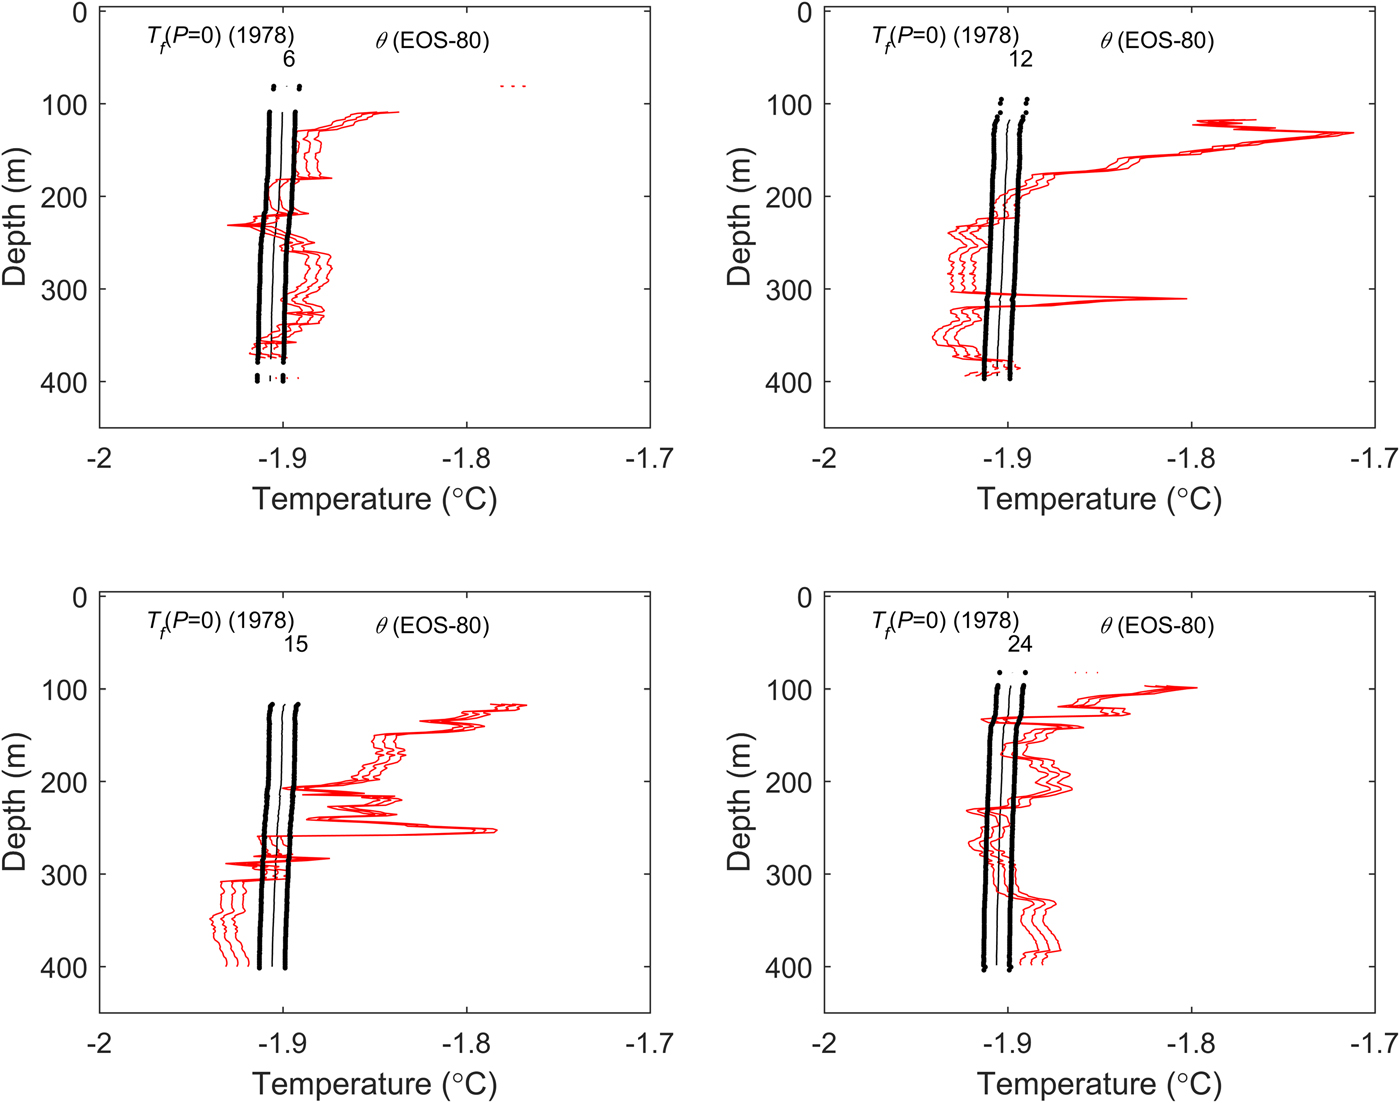
For this set of dives, ISW was identified in layers ranging from a thin, 2 m thick, single layer centred at 231 m depth for dive 6, (Fig. 8) to a layer that was >93 m thick centred at >360 m depth for dive 15 (Fig. 8; note that quality controlled data for this dive ceased at 402 m). There was sometimes more than one ISW layer identified within one downwards part of a dive, such as for dive 12 (Fig. 8). All ISW layers for dives 20–23 were between 13 m and 28 m thick and were centred at depths of between 115 m and 128 m. There was no discernible ISW observed for dives 24 (Fig. 8) to 31 (Fig. 7b).
Measurements in open water
Dives 100–130 are exemplar dives of when the glider was assumed to have been in open water (see Fig. 2 for locations), as the glider was no longer restricted in reaching the surface (Fig. 4), and the water temperatures near the sea surface were warmer (Fig. 9). Note that SG503 did not collect any data from the dives 119–122. No in situ supercooled water was encountered at all during dives 100–130. ISW was not discernible for dives 105–118 (Fig. 9). For dives 124–127, a single layer of ISW was observed, ranging from 134 m thick, centred at 455 m depth for dive 127, to 250 m thick centred at 421 m depth for dive 125. Dives 100 and 128–130 were characterised by the presence of multiple layers of ISW at various depths.
T f (P = 0) (surface freezing point temperature: black lines, calculated from measured salinity) and θ (potential temperature: red lines) for dives 100–130 of glider SG503, where dive 100 has the correct temperature scale and subsequent dives are displaced 0.4°C to the right of each other to allow comparisons. Approximate uncertainties in T f(P = 0) and θ are ±0.007°C and ±0.006°C, respectively. ISW is present where potential supercooling exists, i.e., where potential temperatures are lower than surface freezing point temperatures.
DISCUSSION AND CONCLUSIONS
The observations reported in this paper are from the austral summer when sea ice is melting in front of the shelf and solar irradiation is heating the surface water. Since the ISW exiting the ice shelf cavity is DISW and the water column is stratified, it will not directly influence the surface water.
Figure 5 is the potential temperature versus salinity diagram for dives 2–31 of SG503 with SISW and DISW boundaries from Jacobs and others (Reference Jacobs, Fairbanks and Horibe1985) marked on the plot. The ISW observed for dives 2–31 lies closest to (but not within) the one standard deviation DISW classification of Jacobs and others (Reference Jacobs, Fairbanks and Horibe1985), with none close to the SISW category. Within two standard deviations, most of the data lie within the DISW category of Jacobs and others, but none within SISW. All of the ISW observed for dives 2–31 therefore formed from interaction of HSSW with the Ross Ice Shelf at depth, rather than from melting processes at the ice shelf front associated with SISW.
For those dives under the ice shelf and farthest from the ice shelf front, ISW layers were observed that were from 2 m thick (centred at 231 m depth) to >93 m thick (centred at a depth >360 m). For dives under the ice shelf and close to the ice shelf front, either no ISW was observed or ISW layers were centred at shallower depths (116–127 m). Thicker ISW layers (e.g. up to 250 m thick centred at 421 m depth) were observed for some subsequent glider dives in open water in front of the Ross Ice Shelf in early December 2010.
The profiles of temperature from the glider revealed layers of ISW beneath the Ross Ice Shelf (Fig. 7b), which are extremely rare measurements. Combined with measurements of currents from under the ice shelf (Arzeno and others, Reference Arzeno2014; M. Williams, pers. comm) and our additional observations of ISW north of the ice front, we conclude that some ISW leaves the cavity under the Ross Ice Shelf between Ross Island and Coulman High (see locations on Fig. 3). In McMurdo Sound, west of Ross Island, ISW coming from underneath the McMurdo Ice Shelf is the precursor for growth of platelet ice (e.g. Gow and others, Reference Gow, Ackley, Weeks and Govoni1982; Crocker and Wadhams, Reference Crocker and Wadhams1989; Jeffries and others, Reference Jeffries, Weeks, Shaw and Morris1993; Smith and others, Reference Smith2001; Leonard and others, Reference Leonard2006; Mahoney and others, Reference Mahoney2011; Smith and others, Reference Smith, Langhorne, Frew, Vennell and Haskell2012). No one has measured (or at least reported any measurements) showing ISW immediately south of the McMurdo Ice Shelf front. Robinson and others (Reference Robinson, Williams, Barrett and Pyne2010) observed ISW beneath the McMurdo Ice Shelf, but to the east of the ice shelf front and they stated that the flow direction was away from the McMurdo Ice Shelf. Although the observations presented here are not south of the McMurdo Ice Shelf front, the indication that our measurements are of DISW means that they originated from further south under deeper ice. If so, then it is plausible that a branch of DISW could also head under McMurdo Ice Shelf and into McMurdo Sound. This supports the conclusions of the modelling work of Hughes and others (Reference Hughes, Langhorne, Leonard and Stevens2015) that the ISW plume observed reaching the sea surface in McMurdo Sound originates under the main part of the Ross Ice Shelf, where the ice base is much deeper than under McMurdo Ice Shelf. Since the Ross Ice Shelf is thicker than the McMurdo Ice Shelf at its ice front, this means that the ISW has to exit the ice shelf cavity at a deeper depth than in McMurdo Sound.
Although it was a foreseen possibility that the glider would be swept into the ice shelf cavity, due to deployment through towing with an ROV to near the ice shelf front then releasing the glider, it was not the intention of the original project to have this happen. However, this paper has shown that a glider can obtain very useful data on water mass properties under the ice shelf. Efforts to establish communications and positioning for gliders under ice shelves and sea ice (Webster and others, Reference Webster, Lee and Gobat2014, Reference Webster, Freitag, Lee and Gobat2015) in the future will increase the usefulness of such glider measurements. Future investigations of the evolution of ISW plumes as they exit the ice shelf would particularly benefit from such dedicated glider transects.
ACKNOWLEDGEMENTS
Monica Nelson was supported by an internally funded University of Otago summer scholarship. Bastien Queste was funded by a NERC CASE PhD studentship and an Antarctic Science International Bursary. Glider fieldwork was funded by the National Science Foundation's Office of Polar Programs (NSF-ANT-0838980). We are grateful to Karen Heywood for discussions with Inga Smith where Karen pointed out this interesting dataset and we thank her for putting Inga in touch with Ben Webber and Bastien Queste. Walker O. Smith and Mike Dinniman are thanked for providing glider data and information relating to their deployment. We acknowledge funding support from NERC grant GENTOO (Gliders: Excellent New Tools for Observing the Ocean, NE/H01439X/1). Craig Lee, Jason Gobat and Vernon Asper provided technical assistance and help with the gliders, and Craig Lee is also thanked for discussions relating to the data. Inga Smith was supported by the Aotearoa New Zealand Ross Ice Shelf Programme: Vulnerability of the Ross Ice Shelf in a Warming World (funded by the New Zealand Antarctic Research Institute, grant number: NZARI 2014-11, PI: Christina Hulbe). We are grateful to two anonymous reviewers and Laurie Padman for constructive comments and suggestions that helped improve this paper. The raw data analysed in this paper are available via: http://www.bco-dmo.org/dataset/532643, with processed data available from the authors on request.


 Open access