

Adolescent consumption of energy-dense foods and beverages has increased over time, contributing to the obesity epidemic(Reference Davis, Gance-Cleveland and Hassink1). Data from Project EAT (Eating Among Teens), a longitudinal, epidemiological study of a large youth cohort, found that eating fast food more than three times weekly increased significantly from 1999 to 2004 among adolescent males (from 24 % to 30 %) and females (19 % to 27 %)(Reference Bauer, Larson and Nelson2) and average sugar-sweetened beverage (SSB) consumption increased from 0·94 servings daily to 1·25 servings daily among males as they transitioned from middle to high school(Reference Nelson, Neumark-Sztainer and Hannan3). The consumption of fast food, SSB and convenience products which are frequently energy-dense, low-nutrient products, as well as away-from-home eating in general, has been identified as prime targets for reducing youth obesity(Reference Davis, Gance-Cleveland and Hassink1).
Neighbourhood food environments have been charged with contributing to poor dietary intake, with most of the focus in the literature being on the association between individuals’ dietary intake patterns and objectively measured proximity to area food sources using Geographical Information Systems (GIS). As such, a recent review reported that increased access to supermarkets is associated with healthier food intake among adults and adolescents(Reference Larson, Story and Nelson4, Reference Spence, Cutumisu and Edwards5). Among youth, several studies have also linked proximity to convenience stores with reduced intake of fruits and vegetables, poor overall dietary intake patterns and risk for obesity(Reference Larson, Story and Nelson4, Reference Timperio, Ball and Roberts6–Reference Ho, Wong and Lo8). However, the literature on associations between diet quality and proximity to fast-food restaurants has been mixed. Some evidence suggests proximity to fast-food retailers is associated with lower fruit and vegetable consumption(Reference Timperio, Ball and Roberts6), more high-fat food(Reference Ho, Wong and Lo8) and SSB consumption among adolescents(Reference Ho, Wong and Lo8–Reference Laska, Hearst and Forsyth10), yet others show few or no associations between proximity or access to fast-food outlets and overall dietary intake(Reference Laska, Hearst and Forsyth10) or weight status(Reference Powell, Han and Chaloupka11, Reference Crawford, Timperio and Salmon12).
An individual's perception of time required to travel to food retail is important when considering neighbourhood ‘accessibility’ among adolescents. Although the actual distance to a food retail outlet measured by GIS may be relatively close, GIS ‘distance to’ does not necessarily include features such as crossing busy streets or navigating multiple traffic lights as noted in physical activity resources literature(Reference Maddison, Jiang and Vander Hoorn13). An adolescent's perceptions of time required may be more reflective of his or her likelihood of accessing the local food retail. In addition, perceptions of personal safety and pedestrian infrastructure will also play a role in the perceived ‘accessibility’ of food retail, particularly for adolescents(Reference Giles-Corti, Kelty and Zubrick14, Reference Carlson, Brooks and Brown15).
No known research to date has examined youth food purchasing behaviour from community sources. This is an important gap in the literature. We hypothesize that as youth may be able to more accurately recall how frequently they purchased something (rather than consumed), this may be more closely linked with the neighbourhood food retail environment, and youth food purchasing may be an important point of intervention despite the fact that no known previous scientific research has explored these issues specifically(Reference Gittelsohn, Song and Suratkar16). The association between consumption and proximity of neighbourhood food stores may be more closely tied to purchases that are made at food retail, and exclude home, school and vending sources.
Therefore, the purpose of the present study was to explore the relationship between adolescent perceptions of proximity (i.e. walking time) to neighbourhood food retailers and adolescent SSB, fast food and convenience store purchasing behaviour. Our hypothesis was that frequency of fast food and SSB purchases would increase as the perceived walking time to food outlets decreases, after taking into account demographic characteristics and perceptions of personal safety and pedestrian infrastructure. Secondarily, we believed that this relationship may be different among youth living in urban areas (i.e. where population density is generally high, mixed land use is prevalent, and street networks are highly connected) v. suburban areas (i.e. where commercial retailers may be more in residential areas, and proximity may play less of a role in youth food purchases). We hypothesized that because of the traditional design of suburban neighbourhoods being car-centric v. pedestrian-centric, there would be little association between perceived time to neighbourhood food retailers and purchasing behaviour in suburban areas but an inverse association in urban areas.
Methods
Data for the current analysis came from two aetiological studies of adolescent obesity conducted in Minneapolis and St. Paul, Minnesota, USA, and surrounding suburbs. The first sample was from the Identifying Determinants of Eating and Activity (IDEA) study, a 3-year longitudinal study aimed at understanding the social and environmental influences on unhealthy weight gain in adolescents(Reference Lytle17). Youth were recruited from a pre-existing cohort (The Minnesota Adolescent Community Cohort (MACC) Tobacco Study)(Reference Widome, Forster and Hannan18), by contacting adolescents listed on a permit application listing from the Minnesota Department of Motor Vehicles (DMV) and a convenience sample from the St. Paul–Minneapolis metropolitan area. The MACC cohort was recruited from a random sample of sixty geographical and political units (out of 129) developed to provide a sample of the local tobacco control environments in the state of Minnesota. The MACC study initially recruited a total of 3637 teens divided up into five cohorts based on initial age (i.e. 12, 13, 14, 15, 16 years) with each cohort having approximately 725 youth. Additional information can be found in elsewhere(Reference Widome, Forster and Hannan18). The convenience sample was recruited by asking enrolled participants to notify friends, classmates and other family to contact study staff to determine eligibility. Twenty-six per cent of the adolescents were recruited from the MACC cohort, 49 % were recruited from the DMV sample, and 25 % were recruited from the convenience sample. Participants in the present study (n 332) were adolescents (ages 10·8–17·7 years at baseline) and one parent/guardian living in the catchment area. Data for the analysis were collected in 2007–2008.
The second sample was from the Etiology of Childhood Obesity (ECHO) study (n 374). Baseline data were collected on adolescents (aged 11·0–17·6 years) and one parent/guardian in 2007–2008. The participants were recruited from the membership of the MACC health plan within the seven-county metropolitan area of Minneapolis–St. Paul, Minnesota. The recruitment plan was designed to increase racial/ethnic diversity and to sample youth and parents who represented both healthy weight and overweight individuals. The IDEA and ECHO studies collected the same measures on all participants from the same target population. Appending the data from the two studies provided a larger and more diverse sample. Both studies were approved by the University of Minnesota Institutional Review Board.
Measures
Adolescents and one adult caregiver (typically a parent) independently completed written surveys under the direction of trained study staff. The survey asked questions related to demographics and perceptions, attitudes and behaviours related to energy balance.
Food and beverage purchasing behaviour
Food and beverage purchasing behaviour was measured using three items. Adolescents were asked how many times in the past month they purchased: (i) SSB (regular soda, sports drinks, sweetened teas, juice drinks, punch or lemonade) at a convenience store, gas station, hardware store or vending machine outside school; (ii) food at a convenience store, gas station, hardware store or a vending machine outside school; and (iii) food at a restaurant where food is ordered at a counter or at a drive-through window (where there is no waiter/waitress). Nine response categories ranged from ‘never or rarely’ to ‘3 or more times per day’. Response categories were recoded to reflect the number of times per day such purchases was made. Test–retest reliability was conducted during pilot testing with thirty-three participants for the following psychosocial measures. Test–retest reliability was ρ = 0·67 for all three purchasing items.
Perceived distance to neighbourhood food retailers
Perceived distance to neighbourhood food retailers was adapted from the Neighborhood Environment Walkability Survey (NEWS) survey(Reference Saelens, Sallis and Black19). Perceived walking time to features was approximated using a series of questions asking the adolescent to estimate how long it would take to get from his/her home to the nearest business or facility (convenience store, supermarket, fast-food restaurant, coffee place, non-fast-food restaurant or store (video, clothes, pharmacy and drug store)) if he or she walked. Test–retest value for the NEWS subscale among youth was 0·78(Reference Saelens, Sallis and Black19). The response categories were 1–5 min, 6–10 min, 11–20 min, 21–30 min, 31+ min; they were treated as an ordinal variable in the analysis using 31+ min as the referent category. An index score to represent variety of food features was calculated by summing the number of neighbourhood food features the adolescent could walk to in under 10 min.
The concern for safety
The concern for safety scale(Reference Saelens, Sallis and Black19) comprised five items (α = 0·76) with four response categories (strongly disagree to strongly agree) and was used as a covariate. Questions include too much traffic, fumes when I walk, lots of crime, safe to walk or play during the day and night. A higher value in the concern for safety scale reflects perceptions of more safety concerns and was added as a covariate to the regression models as a potential confounder.
The ease of mobility
The ease of mobility scale(Reference Saelens, Sallis and Black19) comprised five items (α = 0·68) with four response categories (strongly disagree to strongly agree) and was also used as a covariate. Questions include presence of sidewalks, trails, crosswalks and signals, well lit, walkers can be easily seen. A higher value in the ease of mobility scale indicates better ease of mobility and was added as a covariate to the regression models as a potential confounder.
Demographics
Demographic data related to adolescent gender, age and race were reported by the adolescent and the parent/guardian participating in the study responded to whether or not the adolescent received free or reduced-cost lunch at school.
Suburban v. urban
Suburban v. urban classification of neighbourhoods was determined by the adolescents’ residential zip code. Adolescents who resided in zip codes that were located within US Census Bureau-defined urban area (densely settled population inside boundaries of a large incorporated municipality(20)) were classified as urban. Suburb designation was those zip codes surrounding the urban area. There were no rural residential households in the data as all participants resided within the seven-county metropolitan area.
Analysis
Sample characteristics and distribution of analytic variables were summarized and tested for differences by urban v. suburban environment using the χ 2 test for categorical variables and the t test for continuous variables. Spearman correlation coefficients tested the bivariate associations between purchasing behaviour and perceptions of time to walk to neighbourhood food retailers and concerns for safety and ease of mobility. As youth who were recruited were nested in schools, multilevel crude and adjusted linear regression models, accounting for possible clustering at the school level, examined the cross-sectional relationship between purchasing behaviour and perception of walking time to neighbourhood food features.
A variable distinguishing study sample was included in both crude and adjusted models to account for potential unmeasured confounding by study sample. Adjusted models also included adolescent gender, age, receiving free or reduced-cost lunch, race (white v. other), perceptions of safety and ease of mobility. Crude models were tested for two-way interaction between urban/suburban environment and each retail location with P < 0·05 considered a statistically significant interaction. If there was no significant interaction, an indicator variable for urban/suburban was added to the adjusted models. If the interaction was significant, urban v. suburban strata-specific crude and adjusted models were calculated. All data processing and statistical models were conducted using the SAS for Windows statistical software package version 9·1 (SAS Institute Inc., Cary, NC, USA).
Results
The combined sample yielded 706 participants. The urban/suburban designation was collected at the home level and seventy-two students were missing data or were missing the urban/suburban designation, resulting in a final analytic sample size of n 634. Descriptive results are shown in Table 1. There were no significant differences in the sample composition of gender by urban/suburban environment, but in suburban areas there was a higher percentage of adolescents who were white (90·0 % v. 65·4 %, χ 2 = 53·7, P < 0.001) and a lower percentage of adolescents receiving free or reduced-cost lunch (7·0 % v. 24·1 %, χ 2 = 35·0, P < 0·0 0 1) compared with urban areas. Those living in urban environments were also younger than those in the suburbs (mean age: 14·5 v. 15·3 years, t = 4·1, P < 0.001).
Descriptive characteristics of the neighbourhood food environment by urban and suburban environment: Transdisciplinary Research on Energetics and Cancer: Identifying Determinants of Eating and Activity (TREC-IDEA) and Etiology of Adolescent Obesity (ECHO), 2007
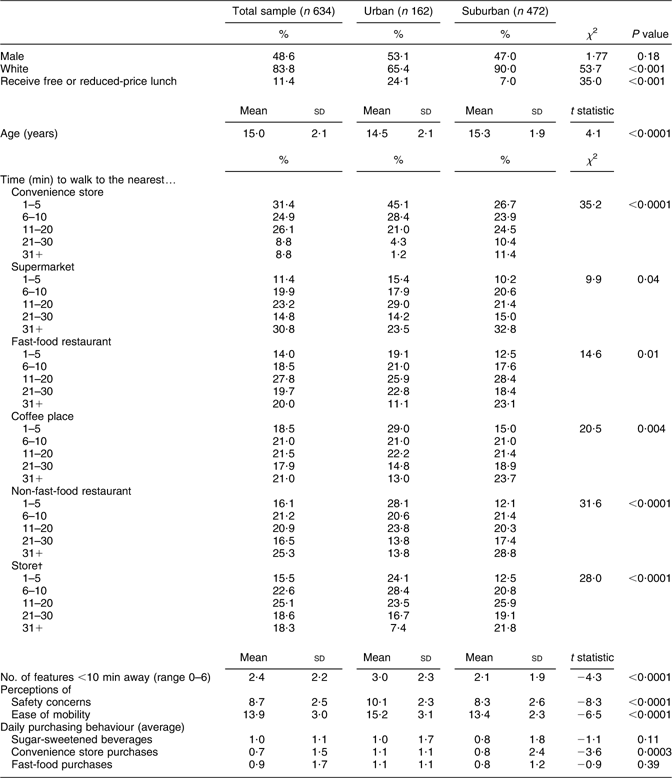
†Store category includes video, clothes, pharmacy and drug store.
Thirty-one per cent of the sample reported they could walk to a convenience store in 5 min or less, as compared with 11 % to a supermarket, 14 % to a fast-food restaurant, 18 % to a coffee place, 16 % to a non-fast-food restaurant and 15 % to another type of store. Adolescents reported an average of 2·4 types of neighbourhood food retailers within a 10 min walk from their home. There were several statistically significant differences in perceived walking time between urban and suburban adolescents, see Table 1. Adolescents in urban areas reported generally lower walking times to convenience stores (χ 2 = 31·3, P ≤ 0·001), fast-food restaurants (χ 2 = 9·3, P = 0·05), coffee places (χ 2 = 15·1, P = 0.005), non-fast-food restaurants (χ 2 = 21·5, P < 0.001) and stores (χ 2 = 25·8, P < 0·001). However, there were no significant differences in walking times to a supermarket between urban and suburban environments.
Spearman correlations (Table 2) showed daily purchasing of SSB was significantly correlated with proximity to all neighbourhood food features. As the length of time to walk to each type of retailer decreased (e.g. supermarket being 21–30 min away v. 31+ min away), the number of daily SSB purchases increased. As the variety of neighbourhood food retailers within a 10 min walk increased, adolescents’ daily SSB and convenience store food purchases also increased. Daily purchasing of food at a convenience store was also significantly correlated with the distance to convenience stores, non-fast-food restaurants and stores. Thus, as the perceived walking time increased (e.g. 1–5 min to 6–10 min), daily purchasing of food from convenience stores decreased. As perceived walking time increased to the nearest convenience store, supermarket and fast-food restaurant, daily purchases of fast food decreased.
Correlations between purchasing behaviour and features of the neighbourhood food environment: Transdisciplinary Research on Energetics and Cancer: Identifying Determinants of Eating and Activity (TREC-IDEA) and Etiology of Adolescent Obesity (ECHO), 2007
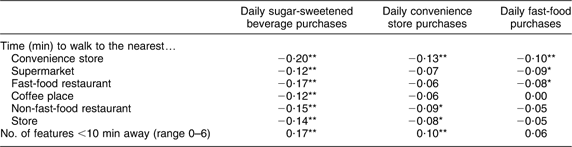
*P < 0·05, **P < 0·01.
Table 3 presents the results from the crude and adjusted multilevel models examining associations between food purchasing behaviour and perceived time to walk to the nearest neighbourhood food retailer. There were no significant interactions by suburban/urban environment in the association between time to walk to neighbourhood food retailers and purchasing behaviour. Crude models show a stepped decrease in SSB purchasing by shorter v. longer walking time to convenience stores, supermarkets, fast-food restaurants, coffee places, non-fast-food restaurants and stores. Results were consistent in adjusted models, although slightly attenuated. For example, participants who reported a convenience store was 1–5 min, compared with 31+ min away by walking, reported purchasing more SSB daily (β = 0·84, P < 0·01). There was only a minimal association between fast-food purchases and proximity to a supermarket; participants reported more fast-food purchases if the walking distance to a supermarket was 1–5 min away compared with 31+ min (β = 0·32, P < 0·05). No other associations were significant for convenience store or fast-food purchases in adjusted models.
Crude and adjustedFootnote † multivariate linear regression results of purchasing behaviour and neighborhood food environment: Transdisciplinary Research on Energetics and Cancer: Identifying Determinants of Eating and Activity (TREC-IDEA) and Etiology of Adolescent Obesity (ECHO), 2007
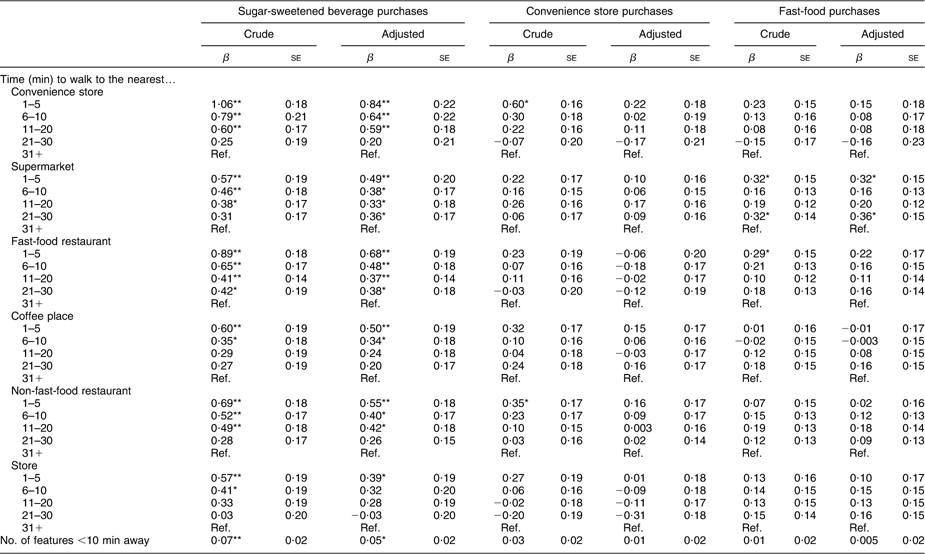
Ref., referent category.
* P < 0·05, **P < 0·01.
† Crude model includes adjustment for study and clustering at school. Adjusted includes cluster at school, study, gender, age, receiving free or reduced-cost lunch, race (white v. other), perceptions of safety, ease of mobility, and urban v. suburban.
Discussion
The present cross-sectional analyses support our hypothesis that closer perceived proximity (or travel time on foot) to food retail is related to increased SSB purchasing among adolescents. However, convenience store and fast-food restaurant purchasing was minimally associated with perceived walking time to food retail after adjusting for covariates, such as pedestrian infrastructure, perceptions of safety and sociodemographic factors. Contrary to our hypothesis, there were no significant differences in these relationships in suburban v. urban environments. It is possible that there is a linear relationship between perceptions of proximity to food retailers and purchasing behaviours that does not differ (in magnitude or direction) between suburban v. urban areas. The differences observed in the sample description stratified by suburban v. urban environment (Table 1) may in fact simply reflect perception of walking distance, e.g. further distance to convenience stores leads to less purchasing, rather than differential effects related to suburban v. urban environment.
Our findings were consistent with a recent study by Laska et al. that explored the relationship between objective measures of neighbourhood food environment using GIS-generated buffers and dietary intake in the (removed for review) Study(Reference Laska, Hearst and Forsyth10). The authors found few associations between fast-food purchasing, dietary intake and body composition and objectively measured neighbourhood food environments, with the exception of a relatively stable association between density and distance to food retail and SSB intake. The current study adds another layer of understanding to this work. Our findings indicate that youth purchasing of SSB in community settings was more frequent when the perceived walking distance was closer compared with further. In fact, more food retail stores available within a 10 min walk from home was associated with more SSB purchasing behaviour.
The consistency of the relationship between SSB and perceived walking distance to food retail may be related to widespread access. Energy-dense foods are widely available in communities, not only restricted to food stores and restaurants. Farley et al. assessed 1082 retail stores that were not primarily food venues, such as pharmacies, gas stations or furniture stores, and found snack foods were available at 41 % of non-food stores, with the most common items being candy (33 %), sweetened beverages (20 %) and salty snacks (17 %)(Reference Farley, Baker and Futrell21). The universal availability of energy-dense foods contributes to impulse purchasing and consumption(Reference Farley, Baker and Futrell21), in particular SSB, as supported here and in previous research(Reference Laska, Hearst and Forsyth10).
The current study highlighted not only neighbourhood exposure to food retail, but also youth food purchasing. Because our youth food purchasing survey questions were designed to intentionally exclude food obtained from home and items purchased from school, these findings offer a clearer link to community-level food retail as an exposure and potential for intervention. Secondarily, the focus on adolescent perceptions of walking distances to food retail is relatively new to the field as most of the published literature that has focused on perceptions of distances has been related to physical activity outcomes(Reference Mota, Santos and Pereira22, Reference Santos, Page and Cooper23).
Many recent neighbourhood food environment studies have made the point that supermarkets provide healthy options for food purchasing and should be encouraged in neighbourhoods(Reference Larson, Story and Nelson4). However, in the present study, we also observed a positive relationship between perceived proximity to supermarkets and consumption of less healthy options, such as SSB and fast food, among our adolescent sample. Supermarkets and grocery stores sell many healthy foods; however, they sell many unhealthy foods as well. This point is often overlooked in the current literature on food environment. In addition, supermarkets may be located in close proximity to other food venues, such as fast-food restaurants.
While the present study added to the current literature, there were several limitations. The data were cross-sectional, restricting causal inference, and the data on purchasing were not linked to an actual food retail location. It is possible that youth food purchases were made at convenience stores and other food retail locations away from the neighbourhoods, including near their schools, in which these youths lived. In a recent study, Laska et al. found that among the young adult population (18–23 years of age), most food purchasing behaviour occurs outside traditionally defined GIS-defined buffers of 2 miles or less(Reference Laska, Graham and Moe24).
Conclusions
Research has shown that youth who shop at convenience stores frequently purchase energy-dense, low-nutrient foods and beverages that contain approximately 1465 kJ (350 kcal) per purchase, on average(Reference Borradaile, Sherman and Vander Veur25). Furthermore, children and adolescents today derive 10–15 % of their daily energy from SSB, and do not appear to adjust their total dietary intake to compensate for the energy in these beverages(Reference Wang, Ludwig and Sonneville26, Reference Wang, Bleich and Gortmaker27). Given these issues and the findings from our study, a reduction in consumption of SSB and other energy-dense snacks is an important dietary intervention to help stem the obesity epidemic. This suggests that an approach focused on education of adolescents of the energy content of SSB and an environmental intervention, such as reducing the ubiquity of SSB in the environment, enhancing product placement strategies of healthy food at food retail locations or improving nutrition labelling as a means to reduce exposure and alter purchasing habits, may assist in improving dietary patterns and subsequently reducing the obesity epidemic.
Acknowledgements
The study was funded by the National Cancer Institute's Transdisciplinary Research in Energetics and Cancer Initiative (NCI Grant 1 U54 CA116849-01, Examining the Obesity Epidemic Through Youth, Family, and Young Adults; Principal Investigator: Robert Jeffery, PhD) and the ECHO study, funded by the National Heart, Lung, and Blood Institute (R01 HL085978). The authors have no conflict of interest to report. M.O.H. conceived of the study idea, conducted the analysis and drafted the manuscript. K.E.P. assisted in interpreting the findings, providing methodological recommendations and editing. M.N.L. assisted in developing survey items for the IDEA and ECHO studies, interpreting the findings, providing methodological recommendations and editing.


