


1 Introduction
Among the different stages of the design and development process of large technical systems such as cars, aircrafts or jet engines, the early design stage, normally referred to as preliminary design, is known to be characterized by particularly complex dynamics. Previous research performed to aircraft jet engine design, for instance, reported that it is typical that early design phases involve regular interactions between the customer of the complex system and the supplier organization(s) capable of providing a design proposal (Fernandes et al. Reference Fernandes, Henriques, Silva and Moss2015). Once a design proposal is requested, the potential supplier’s designer teams work together to synthesize a design solution that can meet the customer’s requirements and expectations, going along a process characterized by rapid design iterations of exploration, convergence and solution refinement with concurrent design activities, which involve system, sub-system and component designers (Fernandes et al. Reference Fernandes, Henriques, Silva and Moss2014). Furthermore, large amounts of collaborative work takes place through interactions between design teams and/or different domain experts intending to resolve conflicting goals and perform solution trade-offs (Hoegl & Weinkauf Reference Hoegl and Weinkauf2005). In addition, previous empirical studies also revealed that early jet engine design typically involves large uncertainty levels. Changes in high-level requirements are typical causes of uncertainty. These changes, subsequently flown down to sub-system and component levels, affect activity realization and trigger new collaborative design iterations (Fernandes et al. Reference Fernandes, Henriques, Silva and Moss2015) together with adaptive behaviours in design actors which often need to balance technical risk and the time available (schedule risk) to deliver the design proposal of the complex system under development to the customer (Unger & Eppinger Reference Unger and Eppinger2011; Fernandes et al. Reference Fernandes, Henriques, Silva and Moss2014).
1.1 Challenges in complex early design
Understanding and predicting the outcome of early stages of complex design processes – such as duration, cost or design solution quality of preliminary jet engine design – in order to support planning is a difficult task both for academia and industry. This difficulty arises from the complex dynamics of early design, which can be characterized by four interconnected dimensions:
-
∙ Uncertainty. Design processes are viewed as a ‘system of interrelated activities’ (Wynn, Grebici & Clarkson Reference Wynn, Grebici and Clarkson2011) performed with the purpose of reducing uncertainties surrounding the design solution. There are many sources of uncertainty that need to be resolved through the interrelation of design activities during early design phases. de Weck, Eckert & Clarkson (Reference de Weck, Eckert and Clarkson2007) mentioned both exogenous uncertainties, such as changes in the operational environment or in the customer requirements, and endogenous uncertainties resulting from the maturation of new product technologies and imprecise corporate strategies. In addition, (Earl, Clarkson & Eckert Reference Earl, Clarkson, Eckert, Clarkson and Eckert2005) identified lack of completeness and quality in data used by engineers in activities and also ambiguity and lack of clarity in design descriptions as sources of uncertainties known to be higher during early phases of design. Other authors emphasize the uncertainty in the product requirements (Liker & Morgan Reference Liker and Morgan2006) or in the design process (Huberman & Wilkinson Reference Huberman and Wilkinson2005).
-
∙ Iteration. Design processes are often organized around different repetitive patterns, commonly known as iterations. A comprehensive view reported by some authors (Wynn, Eckert & Clarkson Reference Wynn, Eckert and Clarkson2007; Wynn & Eckert Reference Wynn and Eckert2017) proposed six forms of iteration that can be found in early phases of complex design: exploration, which consists in a repetitive but rough analysis of a wide range of candidate solutions; convergence, iteration used to converge upon one or a few satisfactory solutions; refinement, iteration aiming to perform optimization and trade-offs; negotiation, which results from changes in goals during system integration; rework, iteration arising from changes in requirements or to correct design problems discovered; and repetition, viewed as iteration based on the recurrence of the same activities to address different aspects of the design solution. In another perspective, iterations can be classified into two main dimensions: repetitive versus evolutionary (depending on the output of the design iteration preserving the same design criteria or not) and intentional versus unintentional (essentially related to the iteration planning condition) (Isaksson, Keski-Seppala & Eppinger Reference Isaksson, Keski-Seppala and Eppinger2000). In a very recent and extensive work on iteration in design processes, Wynn & Eckert (Reference Wynn and Eckert2017) propose a taxonomy to organize iterations stereotypes according to the pursued purpose of an iteration cycles. Three stereotypes are proposed. Tasks can be revisited to Progress, and create knowledge and value, towards completion; to Correct errors introduced earlier or to implement a changes that could have been avoided at their source; and to help Coordinate actors, decisions, and work flows, adding value by enabling secondary effects, such as enhanced control of schedule, cost and risk. (Unger & Eppinger Reference Unger and Eppinger2011) highlighted the association between different forms of risk and design iterations. In fact, the design process is essentially a risk reduction process in the sense that it starts with partial knowledge of the problem and requires decision-making which impact can only be fully assessed further downstream. As the process progresses, knowledge accumulates, but degrees of freedom for making choices diminish and the need to iterate arises (Karniel & Reich Reference Karniel and Reich2013).
-
∙ Collaboration. Early design can also be viewed as a ‘social and collaborative process’ (Shai & Reich Reference Shai and Reich2004) where several aspects of collaborative behaviour can be found. Movahed-Khah, Ostrosi & Garro (Reference Movahed-Khah, Ostrosi and Garro2010) reported that interactions between design agents occur initially to achieve an ‘organized comprehension’ of the design problem and a mutually accepted ‘lexicology or language’ in which to communicate during early activities. When the problem has become clear, design progresses through concurrent synthesis and problem-solving activities performed by distributed design teams (Shai & Reich Reference Shai and Reich2004). During early design, collaboration takes place through interactions intending to resolve conflicting goals and perform trade-offs in the design solution (Veeke, Lodewijks & Ottjes Reference Veeke, Lodewijks and Ottjes2006).
-
∙ Adaptive behaviour. In addition, adaptive decision-making is also observed during complex early design phases, because unforeseen events and results inhibit its full planning in advance. Wynn et al. (Reference Wynn, Eckert and Clarkson2007) underline that design is not a repeatable processes which can be defined a priori, since uncertainty and complexity forces engineers to accommodate evolving requirements, explore opportunities, master continuous changes, deal with intricate trade-offs and solve design problems that always integrate a certain level of uniqueness and novelty. Lévárdy & Browning (2006) and Maier et al. (Reference Maier, Wynn, Biedermann, Lindemann and Clarkson2014) stress also that the development of a complex engineering system is essentially driven by continuous measurement and control of process activities and frequent decision points, where teams evaluate the actual state of the design and the project’s key performance variables, such as time available, level of risk and cost, to make informed decisions about the prioritization of activities and assignment of resources throughout the design process. Adjusting resources, negotiating milestones and re-organizing activities are examples of practical interventions of design actors to adapt to dynamic environments and mitigate project delays as reported in literature (Wynn et al. Reference Wynn, Eckert and Clarkson2007; Wynn & Eckert Reference Wynn and Eckert2017).
1.2 Research motivation
Due to the interrelation between uncertainty, collaborative iteration and adaptive organizational behaviour, this paper argues that capturing the dynamics of complex early design processes constitutes a major challenge for design research. Our past research experience with industrial organizations developing complex systems has shown, for instance, that understanding and quantifying the effects of uncertainty and change in projects during early phases is difficult and, because of that, early project planning is very challenging in practice. There is thus the need for support in understanding early design dynamics and capturing its effects in project performance measures, such as development time, cost or process output quality.
When aiming to investigate the effects of uncertainty, iteration, collaboration or adaptation in early design performance, there are various difficulties in application of ethnographic or empirical data-driven research approaches. For instance, early development phases of complex systems occur seldom, spread over several years and project data is normally limited and problematic to collect or its disclosure must be controlled due to confidentiality.
Alternatively, and despite of inherent limitations, model-based approaches provide ways to perform virtual experimentation from which quantitative and qualitative insights can be gained about the behaviour of complex systems design processes in a cost-effective manner. These insights include support to decision-makers analysing various scenarios and making more informed decisions through simulation of the processes. Deeper understanding gained from analysing the design process helps in developing insights into the particular process that is best suited for a specific product, with the least impact in time, cost and lead time (Isaksson et al. Reference Isaksson, Keski-Seppala and Eppinger2000).
The purpose of this paper is thus to explore novel model-based approaches to capture the dynamics of early phases of complex design and develop new models and tools that can support early project planning. Moreover, we specifically aim to research models capable of integrating representations of uncertainty, collaborative iteration and adaptive behaviour under a single framework. The authors argue that such integration constitutes an opportunity for providing an original contribution to engineering design research. The model was specifically developed to accommodate the dynamics of the early design phases of complex systems like jet engines. Although this is the intended application for the model, the authors believe that it can be used in other contexts with other types of products.
Section 2 begins by discussing various modelling approaches to capture the dynamics of early stages of complex design and identifies current limitations. Aiming to address these limitations, Section 3 presents an agent-based approach that integrates models of uncertainty, collaborative iterations and adaptive behaviour. In addition to an overview on previous experiences of agent-based modelling in design environments, this section includes also the rational of the preliminary design process found in a major jet engines manufacturer that supports the subsequent description of the proposed agent-based approach to model complex systems design processes. Section 4 subsequently presents results from exploratory simulations investigating the effects of high-level requirements change in global early design project performance with the purpose of demonstrating potential support to planning. Section 5 concludes with a summary of our research findings.
2 Modelling the early phases of complex design
The central purpose of complex design modelling and simulation is to provide planning support to organizations (Browning & Ramasesh Reference Browning and Ramasesh2007; Karniel & Reich Reference Karniel and Reich2013). Extensive reviews by Wynn (Reference Wynn2007) and Browning & Ramasesh (Reference Browning and Ramasesh2007) showed that, among the existing model-based approaches, activity-based models have been the most widely explored ones both by academia and in industrial practice.
Activity-based models view the design process as an ‘information processing system’ (Wynn Reference Wynn2007) and are based on a network representation of the design process. A set of activity-based models rely on precedence relationships between the design tasks, such as PERT (Wiest Reference Wiest1977), GERT (Pritsker Reference Pritsker1966), Petri Nets (Murata Reference Murata1989), Signal Flow Graphs (Eppinger, Nukala & Whitney Reference Eppinger, Nukala and Whitney1997) and Applied Signposting (Wynn, Eckert & Clarkson Reference Wynn, Eckert and Clarkson2006). These models typically represent the design process as a pre-determined network of activities using a node-arc type of representation and the process flow is captured according to the chronological order observed in practice. Due to the strength of the precedence relationship, an activity planned to occur at a later point in the process flow is typically only allowed to begin after it has received all inputs from prior activities it relates to.
Other activity-based models are based on dependency relationships between tasks, which incorporate the coupling of information but do not encode from the start how the sequence of activities should be executed. Dependency-based models include the Design Structure Matrix (Steward Reference Steward1965) and the Domain Mapping Matrix (Danilovic & Sandkull Reference Danilovic and Sandkull2005). These models rely on storing the interdependencies in a matrix-like form and using algorithms to identify structural patterns, such as blocks of activities that are tightly coupled and feedback loops (Browning Reference Browning2001), in order to search for improvements such as reducing rework of upstream activities (Dong Reference Dong2002) or perform process simulation (Cho & Eppinger Reference Cho and Eppinger2001).
In addition, a few activity-based models relying on adaptive task selection principles have also been proposed, such as Signposting (Clarkson & Hamilton Reference Clarkson and Hamilton2000), the Adaptive Test Process (Lévardy & Browning Reference Lévardy and Browning2005) and multi-level models that integrate DSM and Petri nets to dynamically consider the perspectives of the process planning and of the process execution communities (Karniel & Reich Reference Karniel and Reich2013). These models encode task selection upon the status of state variables, normally related to design process conditions or decision-making properties of the design process. Signposting, for instance, uses an activity selection scheme that attempts to optimize the level of confidence in the design parameters used as inputs in the next activity at each time step of the simulation (Clarkson & Hamilton Reference Clarkson and Hamilton2000). However, such models have not been extensively explored when compared with the previous types of activity-based models.
The strength of activity-based models relying in precedence or dependency relationships is their cost-effectiveness in capturing moderate size and well-structured processes, due to the use of intuitive graphical notations based on the node-arc or matrix representation of the process network. Because of that, they have been widely explored for design process visualization, planning and execution control (Browning & Ramasesh Reference Browning and Ramasesh2007), particularly during design stages where the sequence of tasks and patterns of iteration are well defined, such as in the detailed design phases.
Nevertheless, there are several limitations in these activity-based models when the goal is capturing the dynamics of early stages of complex design:
-
∙ Difficult to capture early iteration. Activity-based models rely on relatively rigid structural representations of the process which are suitable for well-defined iteration patterns. However, the early design process flow is loosely defined around cycles of exploration, convergence and refinement involving multiple stakeholders, teams and design disciplines where task selection is dynamic.
-
∙ Difficult to account for collaboration. Modelling collaboration requires a representation of the social network found in design organizations and the ability to allow frequent and concurrent information exchange across that social structure of relationships. Both are absent or difficult to incorporate in activity-based models.
-
∙ Difficult to capture adaptation. Since the process flow is normally rigid, activity-based models cannot capture in situ decision-making typical of early design where design actors evaluate the actual state of the design solution against the time available and the perceived project risk/cost before defining the next activities.
-
∙ Difficult to incorporate concurrency and decentralized control. Early design is characterized by concurrent and frequent interactions between design teams, which can involve asynchronous information exchange. Modelling interactions between teams in activity-based models normally results in the addition of a large number of decision nodes spanning different process ‘lanes’ and process flows quickly become intractable, both to use and to communicate.
System dynamics is another approach to model design processes. System dynamics models decompose complex systems into a set of key stock and flow elements (Sterman Reference Sterman2002). Stocks are elements which accumulate or consume some system quantity over time while flow elements define the rate of change of stocks. Causal diagrams defining the system’s elements, their interactions and the main reinforcing and balancing feedback loops are typically used to represent the dynamics that the model intends to study. Models require also the prescription of mathematical equations governing the flow of quantities through stocks. The overall dynamic behaviour of the system arises from simulations solving these equations. A couple of implementations of system dynamics models are known in product development literature. Cooper (Reference Cooper1993) presented a revised model of the ‘rework cycle’ based on a system dynamics. The model captured the amount of undiscovered rework – design work reported as done but containing errors that are discovered later – as a function of the work to be done, the resources available, their productivity and the quality of outputs. Results from simulation led Cooper to argue that undiscovered rework is the ‘single most important source of project cost and schedule risk’, since rework discovered by downstream design effort requires additional staff for a time longer than initially expected. In another research contribution, Ford & Sterman (Reference Ford and Sterman1998) described a multi-phase design project of semiconductor chip development accounting for processes and resources also based on a system dynamics model. Each project phase contained a stock model including the tasks to be iterated, completed, approved and released. Although system dynamics has the potential to deal with some aspects of iteration and concurrency, it will probably fail to tackle adaptation and collaboration due to its very nature. These characteristics were found in both publications referenced above: none was able to model adaptation or collaboration. Table 1 summarizes the previous paragraphs and helps the reader grasp all the perceived strengths and weaknesses of the various methods.
Summary of strengths and limitations of product development process modelling approaches
Based on the previous analysis of strengths and limitations of activity-based and system dynamics approaches, this paper explores the potential of another class of modelling approaches: agent-based models. Agent-based models view complex systems as an aggregation of autonomous agents, each with individual behaviours and decision-making rules, capable of sensing the status of a surrounding environment and interacting with other agents contained in the system (Macal & North Reference Macal and North2010). A bottom-up approach is thus used, where the overall system behaviour emerges from the individual agent behaviours and interactions prescribed. The requirements for such an approach will then become: to enable capturing the dynamics of early design through the integration of models of uncertainty, iteration, collaboration and adaptation under a single framework.
We advocate that these models have inherent strengths which make them appealing for capturing the dynamics of early design processes. Firstly, they are built upon entities which can represent individuals or teams: this enables the replication of social structures observed in product development. Secondly, agent models are based on social interaction and communication through message exchange. Capturing organizational structures and social interactions thus facilitates the representation of collaborative processes found in complex early design. Thirdly, agent models are naturally distributed and have concurrent decentralized control: individual agents have their own internal decision-making functions working simultaneously and can continuously ‘sense’ the state of the environment before deciding on the next action. Agent-based models thus allow capturing distributed, concurrent and in situ decision-making. They hold the potential for a more comprehensive representation of early design iteration involving concurrent iterations between multiple design teams and adaptation.
3 An agent model of early design
The comparative analysis of the different approaches for design process modelling done in the previous section led to the exploration of an agent-based approach for modelling the dynamics of complex early design processes. This section presents previous attempts at using agent-based modelling for early design and also the seminal work on developing the tools with which the A gent M odel for P lanning and r E search of ea R ly d E sign (AMPERE) developed by the authors was built. The AMPERE is specifically developed to integrate models of uncertainty, iteration, collaboration and adaptation.
3.1 Previous agent-based models of design
A considerable body of knowledge has been developed over time on modelling with agents. This paper will cover some of the work made on agent models specifically directed at the design process. Design is a process by which knowledge is transferred and synthesized. However, the constant evolution of standards, technologies, and a dynamic marketplace demands a high degree of adaptability in both design expertise and in the process of applying that expertise (Lander Reference Lander1997). As researchers apply multi-agent technologies to design domains, challenges include supporting interoperability among heterogeneous agents on diverse platforms, coordinating the design process, and managing conflict.
McGuire et al. (Reference McGuire, Kuokka, Weber, Tenenbaum, Gruber and Olsen1993) developed a system to enable effective information sharing and decision coordination in collaborative product development and integrated manufacturing. To that end, the SHADE (SHAred Dependency Engineering) project strikes a balance between two undesirable extremes – typical special-purpose CAE systems tend to isolate information at tool boundaries, and typical integrated CAE systems tend to limit flexibility and process innovation – by streamlining communication exchange among special-purpose CAE systems. SHADE’s approach has three main components: a shared knowledge representation (language and domain-specific vocabulary), protocols supporting information exchange for change notification and subscription, and facilitation services for content-directed routing and intelligent matching of information on consumers and producers. With this system, they hoped to support coordination among numerous heterogeneous agents. The work focused mainly on communication and translation across several platforms, and it was not aimed at the early design phase, nor at the particular problems of iteration and adaptation, although it can be argued that the problems of uncertainty and collaboration are dealt with.
Dai & Drogemuller (Reference Dai and Drogemuller1999) developed a collaborative framework specification where agent technologies can be effectively incorporated. The framework encourages modular software components interaction, accommodating various software technologies tailored to users’ requirements. They used the domain activities of compliance checking and cost analysis to demonstrate how collaborative building design may be achieved with software agents as autonomous decision-making systems. Although the system was developed specifically for building design and targets the communication across different software platforms, the aspect of collaboration is highlighted. Perhaps due to the particular setting of the problem (building design) the problems of iteration and adaptation have not been tackled.
In the area of product design there is a constant need for integration of design, manufacturability and process planning, often performed by dispersed teams in a concurrent way. Sun, Zhang & Nee (Reference Sun, Zhang and Nee2001) proposed a model considering constraints and requirements from the different product development cycles in the early development phases in order to support the concept of design for manufacturability. This model uses conflict resolution techniques and design-improvement suggestions to refine the initial product design, comprising a facilitator agent, a console agent and six service agents. Each service agent is used to model different product development phases, and the console agent acts as an interacting interface between designers and the system, while the facilitator is responsible for the decomposition and dispatch of tasks, and resolving conflicts. A prototype system was implemented and the authors concluded that it could be extended to include other service agents to become a comprehensive distributed concurrent engineering system for geographically dispersed customers and suppliers. This system tackles iteration, uncertainty and collaboration but adaptation is dealt with through a console agent. In a sense, the system is trying to mimic a context in which there is an agent that resolves conflict and distributes tasks, which means that the system cannot do it on its own just through the definition of the other agents’ behaviour.
Cao et al. (Reference Cao, Zhu, Cui and Tan2008) used an agent-based approach to guide the conceptual design phase of a mechanical product, with the aim of reducing lifecycle costs. The framework uses functional parameters and design variables extracted from the mechanical product design requirements. An agent-based framework is subsequently established with multiple agents for solving the functional requirements and proposing a design solution. The proposed model seems to handle collaboration in a sequential way, neglecting iteration, adaptation and uncertainty as a consequence.
Complex design involves trade-offs and teamwork, which implies social interaction of some kind (Crowder et al. Reference Crowder, Bracewell, Hughes, Kerr, Knott, Moss, Clegg, Hall, Wallace and Waterson2003). To make collaborative design decisions, designers must negotiate with each other by exploring the design space, generating new ideas and compromising for agreement. Jin & Lu (Reference Jin and Lu2004) built on contemporary advances in negotiation research in the area of social psychology, distributed artificial intelligence, and decision theory and applied that to design via an agent-based negotiation framework to support collaborative design decision-making. The system is particularly concerned with negotiation, which in the context of the present work translates into collaboration and adaptation. As a consequence, iteration and uncertainty are neglected in this agent model.
Multidisciplinary team working is becoming increasingly important in modern organizations, and it is characterized by complex interactions between its individual members, related to communication and dynamics between members, the working environment, and the team’s work tasks. Crowder et al. (Reference Crowder, Robinson, Hughes and Sim2012) proposed an agent-based modelling approach for simulating team work within an engineering environment. The model includes a number of variables at an individual level (competency, motivation, availability, response rate), team level (communication, shared mental models, trust), and task level (difficulty, workflow), which jointly determine team performance (quality, time to complete the task, time spent working on the task). Crowder et al. (Reference Crowder, Robinson, Hughes and Sim2012) further report the results of various simulation runs that were conducted in response to realistic team working scenarios, together with its validation, and discuss the model’s practical applications as a tool for facilitating organizational decision-making with respect to optimizing team working. The model seems to deal well with collaboration and adaptation, but not with uncertainty and iteration.
Multiple and concurrent iterations during the design phase of aircraft structural parts significantly increase the lead time and cost of new aircraft products’ development. Effective communication, collaboration and coordination of designers and software tools used by them are key mechanisms to address this challenge. Wang et al. (Reference Wang, Li, Li and Liu2012) presented an agent-based collaborative design framework to facilitate the collaboration of feature-based aircraft structural parts design and analysis tools, including detailed design, machining feature recognition, feature-based manufacturability evaluation and cost estimation. A prototype system has been implemented using JADE (Java Agent Development system) and demonstrated through a case study in collaboration with a major aircraft manufacturer in China. This work is the closest to the present work, in the sense that it tackles the four main characteristics of the early design phase. It was, however, specifically developed to solve the problem of feature-based design for aircraft structures, rendering its generalization to other problems difficult.
This section presented some previous attempts at using agents in the design process. It can be seen that these have been few and far between. They have either failed to address the common problems in the design process, especially in early design phases or lack the ability to deal with problems other than those to which they were specifically applied to. The current work will aim to address these gaps. Section 3.2 will establish a system architecture to support the model, explaining how the available tools can cater for the particularities of the early design process. Section 3.3 will define the agents’ behaviour and how they interact in the model. Section 3.4 will present how the model deals with design uncertainty and design iteration, Finally, Section 3.5 will shed some light into the modelling of collaboration and adaptation.
3.2 Architecture of the design process model
As mentioned above the motivation for developing the early design process of complex engineering systems arose from limitations of the modelling approaches reported in the literature in capturing its dynamics together with the findings of the empirical work performed at Rolls-Royce plc, a major manufacturer of jet engines, related with the lack of understanding on how change on high-level requirements, which are subject to change, impact project performance measures. This section provides an overview on the observed design organization, followed by a description of the architectural design of the agent-based model of early phase of design processes.
3.2.1 Early phases dynamics of complex design processes
The architecture of the proposed agent-based model and agents behaviour were inspired by the empirical studies of complex early design processes done by Fernandes et al. (Reference Fernandes, Henriques, Silva and Moss2014, Reference Fernandes, Henriques, Silva and Moss2015) in a jet engines large manufacturer. In their study a simplified, high-level representation of a gas turbine design process was outlined to understand and quantify the typical levels of imprecision in design variables to be expected during the preliminary design phase (Fernandes et al. Reference Fernandes, Henriques, Silva and Moss2014). They found that the engine’s preliminary design process is particularly dynamic and is typically triggered by a request for a proposal or by a request for information from a client interested in a new engine for a particular market application (Figure 1). High-level client requirements such as thrust, specific fuel consumption, weight, unit cost or reliability are captured from these requests and, together with market research surveys of the needs of final users (the airlines) and competitors’ strategies, trigger the start of system design activities to respond to the client’s request. The set of requirements for design and development emerges as a result of these interactions both with the customer and the market. A team responsible for the early design of the whole system then performs the design of the thermodynamic cycle at different operational points of the aircraft’s mission (takeoff, climb, cruise, etc.). The engine must be capable of generating the required thrust within the allowable fuel consumption, weight and cost targets. The turbomachinery’s preliminary mechanical arrangement is also selected.
High-level view of a gas turbine design process.
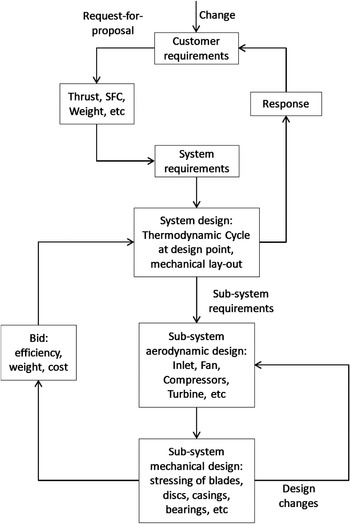
When the system design team is satisfied with a design solution, the thermodynamic cycle and the turbomachinery lay-out are sent as sub-system functional requirements, under the form of a request for a bid, to all the sub-system teams responsible for designing the fan, the compressors, the combustor, the turbines and the remaining sub-systems. Design interactions are then established involving both system and sub-system design teams.
When a satisfactory solution at sub-system level is achieved, each of the sub-system teams engages in inner design loops encompassing the aerodynamic and mechanical design of the sub-system and its key components, such as blades, discs and casings. After the successful integration of component designs into a sub-system solution that fulfils the functional requirements received, teams bid the outcome of their design activities back to system design. Such bids contain the design solution obtained and relevant parameters, such as component efficiencies that have been estimated by the team designing the engine’s thermodynamic cycle to meet customer requirements.
This process then restarts until reaching a solution that satisfies all the participants involved and the needs of the customer and final users expressed in the system requirements. Due to the time available, which is frequently constrained by strict due dates imposed by the costumer, and depending on the level of risk involved, some activities such as off-design performance or component rig testing may be postponed for subsequent development stages.
It was observed that values assigned to design variables change along the way to reflect updates in the preferences of the designers and engineers involved. Moreover, participants meet regularly to collaborate, solve design challenges and to agree upon what is the best solution that can be technically achieved within the time available and the level of risk that can be tolerated.
The final Proposal sent to the customer reflects the outcome of this collaborative and iterative design process. Moreover, as customer and market needs are uncertain and may change during the process, triggering adjustments in high-level requirements, and trade-offs may be needed due to conflicted requirements, designers are exposed to exogenous and endogenous uncertainties and have to accommodate an adaptive decision-making behaviour to deal with evolving requirements, master continuous changes, perform complicated trade-offs and solve design problems which always exhibit, to some extent, a certain degree of novelty. For instance, it was observed that designers involved in the preliminary design phase often needed to choose and negotiate with project lead an appropriate level of activity fidelity, which was dependent upon the level of perceived technical risk and the time available to deliver a solution to the customer (following the arrival of a Request for Information or a Request for Proposal). The level of confidence about the accuracy of the results characterizing the behaviour of the design solution can be increased with more complete design analysis and tools used in aerodynamic or structural design activities. However, this is done at the expense of different activity durations and cost. Adaptive behaviour could also be observed on the optional realization of some activities according to evaluations of risk and time available and subject to negotiation between designers and project lead.
3.2.2 Structuring the design process model based on agents
AMPERE was designed taking advantage of the capabilities embedded in the Smart Phython multi-Agent Development Environment (SPADE) created by Gregori, Cámara & Bada (Reference Gregori, Cámara and Bada2006). SPADE provides an agent management system and an agent communication channel which allows the agents to communicate using FIPA-ACL performatives (Gregori et al. Reference Gregori, Cámara and Bada2006). The SPADE agent class incorporates the fundamental attributes and methods supporting the modeller to set up the agent, add behaviours, register into the platform, and to run and shut down the agent, among others. Moreover, the SPADE behaviour class supports the creation of agent behaviours, including cyclic and periodic behaviours for repetitive actions, one-shot and time-out behaviours for casual actions, the finite state machine behaviour for internal state transitions, and the event behaviour for actions in response to some event that the agent has perceived.
SPADE supports the development of any kind of agents based on several key classes: (1) the SPADE agent class, which has fundamental methods supporting the modeller to set up the agent, add behaviours, register into the platform and to run and shut down the agent, among others; (2) the SPADE ACL Message class, which allows the creation and dispatch of different types of agent communication messages (according to the FIPA-ACL performatives) and the specification of the messages’ content, sender and receiver information; (3) and the SPADE behaviour class, which allows the specification of actions that an agent can perform. Subclasses of the main behaviour class support the creation of different kind of agent behaviours (inheriting all attributes and methods from the parent class to implement variations of the same methods), namely cyclic and periodic behaviours for repetitive actions, one-shot and time-out behaviours for casual actions, the finite state machine behaviour for capabilities based on internal state transitions, and the event behaviour for actions in response to some event that the agent has perceived from the environment at a particular time.
High-level simplified view of the architectural design of AMPERE. Static view based on UML containing some of the main classes and some of the key relationships between them. Legend: $\unicode[STIX]{x1D6E5}$
– relationship of inheritance;
$\unicode[STIX]{x1D6E5}$
– relationship of inheritance; $\blacklozenge$
– relationship of composition.
$\blacklozenge$
– relationship of composition.
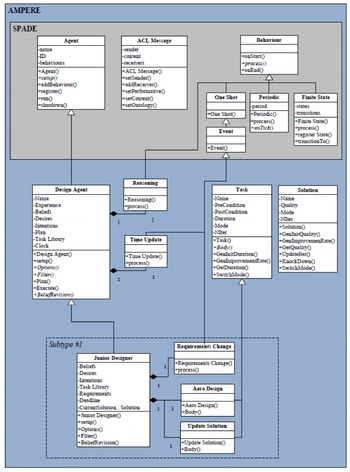
Building upon the SPADE framework, AMPERE includes specialized agents inheriting from the general-purpose SPADE ‘parent’ agent, as illustrated in the high-level simplified architectural representation based on Unified Modelling Language (UML), shown in Figure 2. Each white box in Figure 2 represents a class: the top part of the box contains the name, the middle part displays the class attributes and the bottom part communicates the class methods (Rumbaugh, Jacobson & Booch Reference Rumbaugh, Jacobson and Booch1999).
The high-level architecture of the model shows that the model includes specialized agents derived from the general-purpose SPADE ‘parent’ agent. One of the child agents is the Design Agent, which was designed to construct further specialized agents with a common internal practical reasoning structure. Practical reasoning class uses the Belief–Desire–Intention (BDI) model of agency proposed by Bratman, Israel & Pollack (Reference Bratman, Israel and Pollack1998), who defined beliefs, desires and intentions as the three mental components used during rational reasoning directed towards performing actions. Thus, a practical Reasoning class has internal data structures representing and storing the status of beliefs, desires and intentions and deliberates what action to do using a cyclic algorithm (Wooldridge & Jennings Reference Wooldridge and Jennings1995; Wooldridge Reference Wooldridge2009) where the agent: (1) Observes the environment and updates his beliefs (the information considered to be true); (2) Selects its desires based on an options generation process; (3) Filters them to select the most appropriate option to commit to; (4) Finds a plan among possible candidates to implement the option selected; (5) and Executes the plan. In other words, the Design Agent class was architected with attributes for storing the agent’s beliefs, desires and intentions and incorporates a cyclic reasoning class, which is supported on the class methods for observing, generating options, filtering, planning, executing and revising beliefs to define the agent’s main behaviour. Furthermore, the Design Agent does planning through searching into an internal library for a Task object, which has an execution precondition that holds true and a post-condition that matches the goal the agent desires to accomplish. This planning process is similar to the one proposed by Georgeff & Lansky (Reference Georgeff and Lansky1987).
The Task class has thus been designed to support the planning process and encode something that a Design Agent is able to do on the environment. Once a Task object is selected from the agent’s library as a result of the planning process, its body method is executed, resulting in an action performed on the environment, and the agent remains busy during the time assigned to the duration attribute. The minimum and maximum duration of a Task class are defined at its construction but the Task class contains method’s supporting a dynamic specification of the duration according to the status of other attributes, such as the number of times it has been iterated.
Another key class in AMPERE is the Solution class which represents and tracks the status of the design solution. The execution of Task objects representing actual design activities, such as doing aerodynamic design or mechanical design activities of a system, sub-system or component, enables a Design Agent to operate and change the status of a design Solution object it has generated and continuously improve the solution’s quality. This solution’s quality is one of the key attributes of the Solution class, enabling a parametrization of the optimization level achieved to its requirements through the Design Agent’s efforts.
The bottom of Figure 2 illustrates also the development of further specialized child agents, having customized versions of the parent attributes and methods. For instance, Figure 2 shows a simple Junior Designer Agent with a Task library to generate an aerodynamic component design and update the solution status into the environment, so that other agents may become aware of it. The Junior Designer is also made aware of requirement changes arising from the environment, through an event behaviour. Creating additional and more sophisticated agents in AMPERE can thus be realized following similar customization steps.
3.3 Agent definition, behaviours and interactions
Based on the observed behaviour and work structured of designers and design teams during the preliminary design of jet engines and using the modelling process flow sketched in Figure 2, four agent sub-types were realized in AMPERE inheriting attributes and behaviours from the generic Design Agent architecture. Replicating what was found in the design environment at the jet engines manufacturer, these four sub-types have been incorporated in the model as: a Customer agent; a project Lead agent; a Senior Designer agent; and a Junior Designer agent (Figure 3).
Overview of the agent definition and behaviours (agent optional tasks, interactions and communications) in AMPERE.
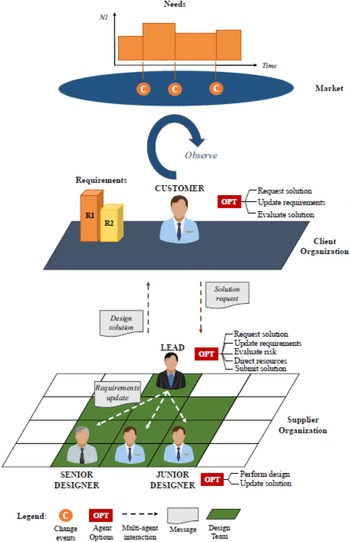
The Customer Agent incorporates a client entity with privileged access to the market environment: it observes how needs evolve over time, reacts to events of change and is motivated to send requests for a design proposal to a supplier organization (Figure 3). As observed during early design stages, the Customer is also prone to trigger an update of requirements when market needs have changed.
Conversely, market information is inaccessible to agents belonging to the supplier organization, but the Lead, Senior Designer and Junior Designer agents are keen to respond to requests and updates arriving from the Customer. Replicating the type of hierarchical unit found in large organizations and, particularly, observed in the jet engine manufacturer, the Lead, Senior Designer and Junior Designer agents are the basic building blocks of a design team (Figure 3). The Lead agent has the ability to dispatch directions to designer agents in the team, which are normally predisposed to accept them. The supplier organization can be composed of one or more design teams working together.
The distinction between Senior and Junior Designers captures the distinct levels of experience found in the early design projects, which results in different impact of actions performed. Senior Designers represent elements that have completed many projects and normally work during early design across multiple projects in a collaborative manner during short periods, but with the ability to strongly influence and direct the course of the design solution. Conversely, the Junior Designer represents elements far less experienced, fully committed to one or a few projects and of much lower resource cost.
Each agent was modelled in AMPERE with the ability to observe its environment and update its beliefs, and perform a finite number of actions on the environment, including interactions with other agents. Actions appear as the outcome of the practical reasoning Beliefs–Desire–Intention algorithm, which consists of updating beliefs, generating options and filtering them to identify the desired one, finding a plan that can implement the option selected and intentionally executing it.
The structured mapping of the agents’ status of beliefs to desires selected for implementation, summarized in Table 2, supports the specification of the overall behaviour of the different sub-types of agents in the model. In practice, a desire that has been selected among available options becomes an intention, i.e., an action that the agent has committed to and is expected to have some desired effect in the environment. For instance, the Customer according to its beliefs may request a design proposal from the supplier, update requirements when it is aware that the market has changed or evaluate the solution received. Depending on its awareness on the arriving of new customer requirements, project Lead is able to request a solution from the team, update arriving requirements, evaluate project risks, direct resources according to the perceived risk level and submit a solution to the Customer.
Summary of desire selection according to the status of the agent’s beliefs, which supports the specification of agent behaviours in the model
Designer Agents can either perform design activities or update the design solution to its team (Figure 3). The realization and repetition of the design tasks allows designer agents to generate or improve the status of the design solution’s quality until requirements are met, similarly to what is observed in practice during early design phases. Furthermore, Senior Designers may collaborate with Junior Designers belonging to the team, allowing a faster convergence or a better design solution, or support other projects, since they are not dedicated to a single project.
As observed during the empirical studies some of the actions that can be executed include multi-agent interactions. Multi-agent interactions were modelled relying in the exchange of communication message instances, derived from the SPADE message class indicated in Figure 2, which allow agents to find each other and pass information through the environment. Table 3 summarizes the type of messages exchanged between agents in the model using the FIPA-ACL communication language and outlines its content. For instance, communication messages are used by the Customer Agent to request a design solution to the supplier organization and simultaneously specify two key variables: the deadline for solution submission and the expected quality.
Summary of communication messages exchanged between agents in the model
The previous definition of agents, behaviours and interactions are the fundamentals of the agent-based model of early design developed by the author with the purpose of investigating the effects of requirements change in project performance. As previously stated, the model is inspired in empirical research about the preliminary gas turbine design and aims to capture key dynamics of early design. The subsequent sections present models of the effects of uncertainty, iteration, collaboration and adaptation introduced in AMPERE to capture such dynamics.
3.4 Modelling uncertainty and iteration
Each subtype of Design Agent was built in AMPERE with a library of specialized tasks that it can select to perform. For Junior and Senior Designer Agents, planning and execution of tasks representing actual design activities enables the agents to generate a design Solution instance or operate on its status after creation. This allows designer agents to gradually improve their knowledge and thus the quality attribute of the design solution object. While the solution’s quality is lower than the required target, meaning that requirements have not yet been achieved, the agents may choose to iterate the activities. The effect of the iteration on the agent’s design Solution instance quality attribute was modelled in AMPERE according to Equation (1):
 $$\begin{eqnarray}Q_{n}=Q_{s}-(Q_{s}-Q_{i})e^{-\unicode[STIX]{x1D6FC}n}\end{eqnarray}$$
where $Q$
is the solution instance quality attribute at iteration
$Q$
is the solution instance quality attribute at iteration $n$
;
$n$
; $Q_{s}$
is the standard quality level the agent is able to achieve;
$Q_{s}$
is the standard quality level the agent is able to achieve; $Q_{i}$
is the initial quality level; and
$Q_{i}$
is the initial quality level; and $\unicode[STIX]{x1D6FC}$
is the quality progress rate coefficient. During simulation,
$\unicode[STIX]{x1D6FC}$
is the quality progress rate coefficient. During simulation, $Q$
,
$Q$
, $Q_{s}$
,
$Q_{s}$
, $Q_{i}$
and
$Q_{i}$
and $\unicode[STIX]{x1D6FC}$
take real values between [0, 1] while
$\unicode[STIX]{x1D6FC}$
take real values between [0, 1] while $n$
stores integers within the interval
$n$
stores integers within the interval $[0,+\infty ]$
. When
$[0,+\infty ]$
. When $Q$
reaches a unitary value, this represents a fully optimized design solution. Similarly, the effect of iteration on the agent’s design Task instance duration is modelled according to Equation (2):
$Q$
reaches a unitary value, this represents a fully optimized design solution. Similarly, the effect of iteration on the agent’s design Task instance duration is modelled according to Equation (2):
 $$\begin{eqnarray}D_{n}=D_{s}+(D_{i}-D_{s})e^{-\unicode[STIX]{x1D6FD}n}\end{eqnarray}$$
where $D_{n}$
is the design task instance duration attribute at iteration
$D_{n}$
is the design task instance duration attribute at iteration $n$
;
$n$
; $D_{s}$
is the standard duration the designer agent is capable;
$D_{s}$
is the standard duration the designer agent is capable; $D_{i}$
is the initial duration of the task; and
$D_{i}$
is the initial duration of the task; and $\unicode[STIX]{x1D6FD}$
is the duration progress rate coefficient. During simulation,
$\unicode[STIX]{x1D6FD}$
is the duration progress rate coefficient. During simulation, $D$
,
$D$
, $D_{s}$
and
$D_{s}$
and $D_{i}$
are defined as real numbers corresponding to time units,
$D_{i}$
are defined as real numbers corresponding to time units, $n$
as integers between
$n$
as integers between $[0,+\infty ]$
and
$[0,+\infty ]$
and $\unicode[STIX]{x1D6FD}$
takes real values within
$\unicode[STIX]{x1D6FD}$
takes real values within $[0,1]$
.
$[0,1]$
.
Equations (1) and (2) thus model the effect of iteration in the solution’s quality and task’s duration through exponential learning curves (Leibowitz et al. Reference Leibowitz, Baum, Enden and Karniel2010), which is a standard way of describing that, for a given level of fidelityFootnote 1 , further iteration improves the performance achieved by the agent, but yields increasingly lower gains (Hamade, Artail & Jaber Reference Hamade, Artail and Jaber2005).
This allows AMPERE to incorporate two empirical notions of early design iteration dynamics. The first is that design solution improves quickly in the first iterations, normally corresponding to early stages of design exploration and convergence. Then, as early design progresses to stages of refinement and repetition, an increasingly higher iteration effort is required to continue design optimization. This modelled effect of iteration is represented in Figure 4 (left). Secondly, it incorporates also the empirical notion that designers learn from experience accumulation, meaning that subsequent repetitions of activities are performed faster than initial ones. AMPERE allows also Junior and Senior Designers to have different improvement rates, according to their level of expertise.
The previous behaviours have been incorporated in AMPERE through the methods created for the Task and Solution classes. Moreover, in order to account for the effect of day-to-day variability in individual performance of agents, Equations (1) and (2) have been implemented with probability density functions associated to the standard and the initial values and to the improvement rate coefficient. Simple probability density functions, such as triangular functions, were used to capture the effects of variability during simulation.
Modelled effects in AMPERE of iteration according to design experience (left) and uncertainty on solution quality in the presence of a change arrival (right). Subscript $i$
denotes initial quality level and subscript
$i$
denotes initial quality level and subscript $s$
denotes standard achievable quality level.
$s$
denotes standard achievable quality level.

In addition to task variability, the effects of uncertainties typical of early design phases, such as events of change arising from the external environment, have also been captured in AMPERE. Figure 4 (right) illustrates that the arrival of change has been modelled through a loss of design solution quality and work efficiency that has been achieved by the agent until the event occurred. This deterioration captures the concept that change events transport designers to a state of lower knowledge, since goals have been modified and thus design space has been repositioned relative to the current solution status. The deterioration in quality and work efficiency has been modelled in AMPERE proportionally to the magnitude of change perceived by the agent.
3.5 Modelling collaboration and adaption
In addition, facets of collaborative behaviour often observed during complex early design phases have been also incorporated. One fundamental dimension of collaboration is accounting for the traditional breakdown of large pieces of work into separate and smaller parts, which are delivered by different actors. Through the agents’ Task library, AMPERE allows the definition of specific responsibilities to individual Senior or Junior Designers, such as component or discipline-related design responsibilities. For instance, one agent may be made responsible for the aerodynamic design of one component and to pass information to another agent part of the team which may be responsible for the mechanical design of the same component. Both work until they are satisfied with their individual solutions, reacting to changes that are communicated from the external environment during that process.
Since this facet of collaboration requires partial solutions to be integrated into a more global solution, the quality of this global solution (the delivered design solution for the whole system) is expected to reflect the relative importance of its parts or sub-systems. In fact, as reported by Case & Lu (Reference Case and Lu1996), the collaborative behaviour during complex design was observed at the jet engine manufacturer, including key aspects of conflict resolution, where designers work together to achieve a better overall design, i.e., towards a globally ‘optimized’ solution which is not necessarily the sum of locally optimized sub-solutions. AMPERE includes thus the Collaborative Solution class which allows agents to track and store the results from collaborative and distributed design processes. The quality of a Collaborative Solution instance is defined according to Equation (3):
 $$\begin{eqnarray}CSQ=\mathop{\sum }_{j=1}^{n}w_{j}Q_{j}\end{eqnarray}$$
where C SQ is the collaborative solution instance quality attribute; $w_{j}$
is the contribution weight of each part or discipline aspect for the global design solution quality and
$w_{j}$
is the contribution weight of each part or discipline aspect for the global design solution quality and $Q_{j}$
is the design solution instance quality attribute of each part or aspect, being
$Q_{j}$
is the design solution instance quality attribute of each part or aspect, being $w_{j}$
subject to the constraint:
$w_{j}$
subject to the constraint:
 $$\begin{eqnarray}\mathop{\sum }_{j=1}^{n}w_{j}=1.\end{eqnarray}$$
During simulation, C SQ, $Q_{j}$
and
$Q_{j}$
and $w_{j}$
take real values between [0, 1] and Equations (3) and (4) capture the effects of early design collaboration based in work decomposition.
$w_{j}$
take real values between [0, 1] and Equations (3) and (4) capture the effects of early design collaboration based in work decomposition.
Furthermore, taking advantage of the ease of implementation of concurrency in agent-based models, AMPERE allows different Designer agents to be working on alternative solutions for the same component or disciplinary aspect. This aims to capture further aspects of early design collaborative iteration, where designers typically work concurrently on several candidates for the solution in cycles of exploration and convergence (Wynn et al. Reference Wynn, Eckert and Clarkson2007; Wynn & Eckert Reference Wynn and Eckert2017). The Collaborative Solution class has been developed with methods allowing agents to screen among alternative solutions developed for the same goal and select the one that achieved the most promising quality level.
Several facets of adaptive decision-making behaviour encountered during complex early design have been also captured in AMPERE. The practical reasoning behaviour used by agents to plan their actions state is, in essence, a way of capturing in situ adaptive decision-making. This adaptation is in essence the capacity of the Lead to evaluate risks and adapt its behaviour, deciding to either direct the resources available in the design team to work on project activities or allow them to remain available to work in other projects. Risk evaluation made by the Lead Agent includes in situ estimation of the probability and impact of not meeting the Customer’s expectations.
Probability and impact are estimated real numbers between $[0,1]$
and risk is computed by the agent using the standard approach of Risk
$[0,1]$
and risk is computed by the agent using the standard approach of Risk $=$
Probability
$=$
Probability $\times$
Impact. The probability; Prob, of not meeting the Customer’s expectations has been modelled in AMPERE as a function of the time available until the deadline for design proposal submission and the gap in the status of the solution quality relative to the Customer’s expected level:
$\times$
Impact. The probability; Prob, of not meeting the Customer’s expectations has been modelled in AMPERE as a function of the time available until the deadline for design proposal submission and the gap in the status of the solution quality relative to the Customer’s expected level:
 $$\begin{eqnarray}Prob\left(t\right)=1-e^{((c2(T_{deadline}-t)/T_{deadline})-c1)\times Q_{gap}}\end{eqnarray}$$
where $T_{deadline}$
is the time corresponding to the deadline defined by the Customer agent and
$T_{deadline}$
is the time corresponding to the deadline defined by the Customer agent and $t$
is the present time, both defined as real numbers corresponding to time units.
$t$
is the present time, both defined as real numbers corresponding to time units. $Q_{gap}$
, expressed as a real value between [0; 1], is the difference between the current level of solution quality achieved by the team and the level expected by the Customer agent, c1 and c2 are real constants adjusting the rate of change in the probability function.
$Q_{gap}$
, expressed as a real value between [0; 1], is the difference between the current level of solution quality achieved by the team and the level expected by the Customer agent, c1 and c2 are real constants adjusting the rate of change in the probability function.
The impact of failing to deliver has been modelled as a linear function of the gap in quality relative to the Customer’s expectations according to Equation (6):
 $$\begin{eqnarray}Impact=\left\{\begin{array}{@{}ll@{}}m\times Q_{gap}\quad & ifQ_{gap}\leqslant Tol\\ 1\quad & ifQ_{gap}>Tol\end{array}\right.\end{eqnarray}$$
where $m$
is a real constant adjusting the rate of change in the impact function; and Tol is a real number between [0, 1] defining a tolerance level below which the agent is no longer sensitive to the quality gap and the impact is minimum.
$m$
is a real constant adjusting the rate of change in the impact function; and Tol is a real number between [0, 1] defining a tolerance level below which the agent is no longer sensitive to the quality gap and the impact is minimum.
Based on this risk of failing to deliver on time and with the expected level of quality, the Lead Agent continuously adjusts his design team’s resources. Resources are adjusted by the Lead in a linear manner, based on the level of risk perceived at that time. This behaviour essentially models adaptive planning to the environment’s changes observed in the design organization during early design phases.
4 Exploratory simulations
This section presents and evaluates results arising from simulation of an initial AMPERE model conceptualizing a simple scenario: a single Customer agent that regularly sends a request for a solution proposal to a single supplier comprising a design team responsible for delivering a design proposal before a specified deadline. Exploratory simulations from this simple model allow an evaluation of the model’s potential for capturing key dynamics of early design phases. For instance, the cause–effect relationship between the level of change arising in the environment and early design project performance has been evaluated. Moreover, it reflects the authors’ empirical observations of complex product development projects related with the dynamics at early design stages triggered by customers’ requests: the lack of understanding on the effects of requirements change in project performance results in difficulties in planning taking into account expectable levels of requirements change. The section begins by describing the setup of this simple model and subsequently presents and discusses the results from exploratory simulations.
4.1 Simulation setup
The setup of this simple model for simulation was made intending to conceptualize a simple scenario: a single customer which engages with a single supplier organization comprising one design team responsible for delivering a solution to the customer Input data and results from these simulations are illustrative and provide essentially an exploratory evaluation of the potential of the agent model to capture key dynamics of early design stages, investigate the effects of expectable levels of change in project performance and support planning.
The setup essentially includes the definition of specific internal parameters adjusting the behaviour of the environment and of the design agents previously described. The environment was set up with a stochastic generation of market changes perceived by the Customer Agent with a period uniformly distributed between 10 and 20 working days, which generates events of requirements updates from the Customer to the supplier organization.
The additional setup for agents is introduced in Table 4. It shows that the Customer Agent was set up with an internal policy defining the desire to request a new solution proposal every 4 working weeks. When a request is sent, the Customer expects a response from the supplier one working day before the time to request a new proposal has arrived. Table 4 shows also that the Customer aims to get a certain number of solution proposals. After this number is reached, the Customer Agent has achieved his goal and the simulation stops. This aims to represent early design dynamics observed in Fernandes et al. (Reference Fernandes, Henriques, Silva and Moss2014), where the Customer drives the suppliers’ design process through regular requests for proposals until it makes a decision about which solution is most promising.
Summary of the specific setup of the agent model for exploratory simulations
Within the supplier organization, a single design team composed of a Lead Agent and several Senior and Junior Designer Agents was set up for generating a design solution proposal that meets the Customer’s expectations and respond to the Customer before the specified deadline. In this simple model, the Lead Agent has an available design team composed of five designer agents: two aerodynamic Designers, one Junior and one Senior; and three mechanical Designers, where two are Junior and one is Senior. The team is capable of adapting resources and execute actions, including design activities, tackle the arrival of changes and deliver a solution proposal to the Customer.
Table 4 shows that aerodynamic designers have the ability to assess the requirements, generate a concept, compute the efficiency of the concept and evaluate the solution created. Mechanical designers are also capable of assessing new requirements and, in addition, assess updates of the aerodynamic solution generated by fellow designers in order to compute loads acting on the system. After computation, mechanical designers generate a model and compute the stress, weight and cost of their solution. Each design task was set up with specific duration parameters and an associated variability. Activity durations reported in Table 4 refer to hours of working timeFootnote 2 . In addition, each design task was set up with a probability of rework equal to 10%. Triangular probability density functions were assigned to the solution quality and duration progress rate coefficients according to the agent’s level of experience (Table 4). The initial solution quality achieved by agents after the first iteration was sampled from a triangular distribution.
Simulation begins with agents registering into the SPADE platform, which allows them to be reachable and exchange messages through the platform’s communication channel. Simulation is driven by an initial request for a solution sent by the Customer to the supplier, which occurs at the simulation’s initial time step. A time-stepped approach has been implemented and the internal clock advances at constant time intervals. This clock was included in the architectural design of AMPERE and ensures time-stepping synchronization to all agents during simulation. Exploratory simulations required approximately 2500 lines of code to run, including the classes and methods previously described as the heart of AMPERE, and each simulation took 25–35 seconds to run on an Intel Core i7-3517 CPU@1.9 GHz using a 64-bit operating system.
4.2 Visualization and performance evaluation
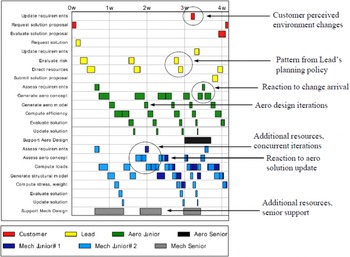
Process visualization is a key purpose of product development process modelling since it provides support for group discussions within design organizations (Browning & Ramasesh Reference Browning and Ramasesh2007). Because of that, exploratory simulations investigated ways to picture the process output resulting from agent-based simulation to provide the generation of a design process chart as a standard post-processing feature. Figure 5 presents an annotated and detailed view over part of a complete design process chart resulting from one simulation run with the simple setup described in Table 3. The run resulted in a design process duration of 12 weeks comprising three main interaction cycles between the Customer and the supplier organization.
Several changes occurred in the market environment during the simulation, which are visible through the requirements updates sent from the Customer agent to the supplier organization. Directions arising from the Lead motivate Designers to start their design work. Figure 5 shows also the patterns of risk evaluation and adjustments in the number of resources allocated to the design process resulting from the Lead agent’s planning activities. The request for additional resources arising from the Lead’s risk evaluation triggers various Designers to engage in concurrent design iterations.
Design activity repetition patterns appear as a result of the need for iteration to improve the solution’s quality. For instance, Figure 5 reveals aerodynamic design iterations, consisting of concept generation, calculations, solution evaluation and update to other team members. Interruptions of the natural activity cycle are also depicted, as a result of agent reaction to changes arriving from the environment. Figure 5 shows in situ reassessment of requirements upon the perception of a requirements change event and the repetition of previous activities as a result of design updates arriving from other design disciplines. The design process visualized thus emerges from concurrent streams of design activities shaped by frequent social interactions and adaptive behaviours. The ability of capturing these dynamics typical of early design phases is a major strength of the agent-based modelling approach explored.
View of 4 weeks of the design process chart arising from a single simulation.
4.3 Evolution of internal variables
In addition to process visualization, post-processing of AMPERE simulations provides also the visualization of the evolution of internal agent variables which have an important influence in the outcome of the simulation.
The evolution of the solution quality generated by Designer Agents and perceived by the Lead during the course of one particular simulation run is presented in Figure 6. The reader should recall that solution quality is calculated using Equations (1) and (3). This evolution shows how the work performed by aerodynamic and mechanical designer agents contributes to the overall development of a collaborative solution for the system aiming to reach the level of quality expected by the Customer Agent. The collaborative solution quality level is perceived by the Lead Agent according to the weight assigned to each solution component. In this particular setup, equal importance was given to both disciplinary aspects of the design solution. Figure 6 makes also visible the effects of uncertainty in the agent’s design efforts, showing how the quality level suffered a deterioration – the ‘knock-downs’ visible around weeks 3, 6 and 9, for instance – when events of requirements change arrived from the environment.

Risk perception level evolution during the course of a single simulation run.
Figure 7 presents the evolution of the level of risk perceived by the Lead agent during the course of the same simulation. The reader should recall that perception of risk, as explained in Section 3.4 is computed in terms of probability of not meeting the required solution quality times the impact of not meeting it. Probability is a function of the time available until the deadline, whereas impact is a linear function of the gap in quality relative to the expected level of quality (Equations (5) and (6)). This is an important internal decision-making variable used for resource adjustments and arises from an in situ evaluation of time left until the deadline and the current gap in quality relative to the Customer’s expectation. Analysis shows that the level of risk perceived by the Lead Agent decreases according to the rise in the solution’s quality. It is also relevant how the perceived risk rises again around week 6 following an update of requirements arriving from the Customer. The re-evaluation of risk at week 6 ultimately led the Lead to request additional resources to perform design work.
4.4 Performance evaluation
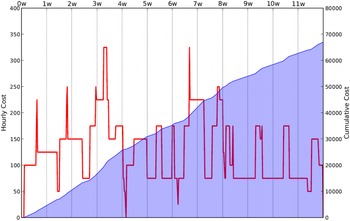
As a result of the design team resources utilization, the cost evolution during the course of the simulation time can be determined. Figure 8 shows how both the hourly and cumulative cost evolve. Peak values of hourly cost consumed by the project occurred between weeks 3 and 4 and also between weeks 6 and 7, as a consequence of time periods where all resources available in the supplier organization were performing design work in a concurrent manner (visible in Figure 5). The accumulated cost incurred by the organization during the course of 12 weeks to execute the project reached approximately 67 thousand cost units. These exploratory simulations refer to arbitrary project cost units that the reader can relate to its own monetary units.
Cost evolution during the course of a single simulation run. Cost values are presented in generic project cost units.
Considering a simulation run as an individual experiment with the system, performing a significant number of simulations is a standard approach to understand and characterize in a statistical manner the effects of variability in the system’s performance. Due to its importance, multi-run post-processing of AMPERE simulations were also explored.
Figure 9 depicts two measures of project performance related to the solution quality achieved by the design team and submitted to the Customer: (1) the average quality level of proposals submitted during each project; and (2) the quality level of the last proposal submitted. The cumulative frequency of the average and last proposal arise from 50 simulation runs (50 independent experiments) with the setup described in Table 4. Figure 9 compares both measures with the expected quality level that was set up for the Customer Agent and shows that expectations were exceeded in approximately 10% of the cases. Adopting a frequentist view, this enables an estimation of the probability of satisfying the Customer with the last proposal issued for a particular model setup. Based on this sample of 50 simulation runs the last proposal quality has a median of 0.824, meaning that a confidence interval can be calculated as a measure of how precisely the median based on this sample approximates the population value. The 95% confidence interval, [0.812; 0.849], shows that the median result can be trusted even for a small number of simulation runs.
Moreover, the frequency distribution of cumulative costs incurred by the projects during multi-runs provides a second dimension for project performance evaluation. Considering that organizations normally have budget constraints, this analysis allows understanding the probability of meeting or exceeding the budget available to realize early design phases. In this case, statistical treatment of 50 simulation runs resulted in a median project cost of respectively 76 thousand cost units.
Histogram of solution quality from 50 simulation runs.
4.5 Effects of change in performance
One of the strengths of agent-based simulation is the possibility of investigating complex cause–effect relationships in a cost-effective manner. Because of that, exploratory simulations have also addressed an investigation to the relationship between requirements change and its effects in the global project performance. The study consisted essentially in varying the external environment’s time between changes probability distribution – keeping all other setup variables constant – and observe the response behaviour. The uniform distribution defining the environment’s time between changes was varied in steps of one working week. Fifty simulation runs of the model were performed with each modified setup. The project’s performance was measured in terms of two key metrics: the solution quality achieved in the last proposal delivered by the design team within the due date; and the cumulative cost incurred by the project. Both were characterized statistically for each set of 50 simulation runs using the median of quality and cost values.
Results are presented in Figure 10. The design solution quality response behaviour reveals that there is an interval or plateau – a change in requirements triggered each 3 to 5 weeks – where variations in the time between changes in the environment have little effect in the solution quality delivered to the Customer. In addition, Figure 10 shows that further reductions in the change frequency beyond 3 weeks produces a reduction of the last proposal’s solution quality with increasing rates. On the other hand, project cost appears to behave rather linearly and inversely to the increase in the time between changes in requirements arriving from the environment. This behaviour arises from the fact that Designer Agents spent less time looking for a new design solution due to updated requirements and thus progress faster as the rate of arrival of changes decreases.
Effects of change in project performance. Each performance data point arises from 50 simulation runs of a particular environment setup and refers to computed median values.
Looking to the design process as a system, Figure 10 suggests that there is a stability region relative to the arrival rate of changes and an instability point, which determines the transition to a state where changes arrive faster than what the system can cope with. Such state should naturally be avoided since project performance is significantly affected. The development of more complex models of early design with a higher number of hierarchically organized design teams, each responsible for sub-system and component design and capable of communicating changes independently at different frequencies, is however required for further investigating this hypothesis.
Considering that these results arise from a very simple model, this paper argues that agent-based models such as AMPERE are a promising approach to investigate the behaviour of complex design systems and can support industrial decision-makers planning projects during early stages. One example of such planning support is the estimation of the most likely performance of projects during early design, for an expected level of arriving changes from the environment.
5 Conclusions
Based on a general-purpose agent development platform, we have synthesized an Agent Model for Planning and rEsearch of eaRly dEsign (AMPERE) aiming to capture key dynamics of early design phases of complex system development. This agent model conceptualized key actors of early design stages, such as an external Customer, a design Lead and Junior and Senior Designer agents belonging to a design team. Agents were realized based on a practical reasoning algorithm constructed with internal Belief–Desire–Intention data structures and with a possible set of agent actions on the environment. During simulation, the design agent’s actions are influenced by changes arising from the environment. Results from AMPERE simulations include the level of solution quality achieved by the design team and the project cost associated with the use of work resources.
This paper argues that exploratory simulations using a simple AMPERE model have demonstrated the potential of the agent-based approach in two different dimensions. The first is that agent-based models offer significant advantages to capture the dynamics of early design relatively to other modelling approaches, such as activity-based models. Looking back to the results from a simple model, this research demonstrated that agent models allow capturing under a single modelling framework the effects of uncertainty and change, various facets of iteration, concurrency of activity streams, frequent social interactions and information exchange between teams, collaborative design efforts, and distributed and adaptive decision-making in response both to organizational commitments and to the occurrence of unforeseen events.
The second dimension is the potential of agent-based approaches such as AMPERE to support industrial organizations understanding and evaluating complex cause–effect relationships that affect the performance of complex projects during early design. Results showed how the analysis of a considerable number of agent simulations provides an estimate of the likely level of solution quality achieved or cost that will be consumed by the project, in relation to a certain expectation or budget available. Agent-based simulations can thus support project planning activities during early design and allow more informed decisions about the resources or budget to be made available by the organization. For instance, this paper showed how the agent model may support early design planning for an expectable level of change arising from the environment.
The authors’ belief is also that the development of AMPERE has opened additional avenues for future research. The first involves its validation and a deeper analysis of its efficiency and usefulness in an industrial environment based on real data. The second relates to further development and application of agent models to create more complete models of early design phases. For instance, the introduction in agents of reconsideration capabilities during the planning process in conjunction with more complex organizational models including various design teams in different hierarchical levels interacting during simulation are aspects for further research and development. The third – and most ambitious – research avenue foreseen is the development of novel software platforms for design process modelling using agent technology which can be made available for the broader use of the academic and industrial product development community.
Acknowledgments
The work leading to this publication has been funded partially by the Portuguese Science Foundation under the grant SFRH/BD/51107/2010 and the project MITP-TB/PFM/0005/2013, ‘Introduction of Advanced Materials and Technologies into New Product Development for the Mobility Industries’ on the Workpackage ‘Management of Uncertainty’.


 Open access