


1. Introduction
This paper considers the statistics and asymptotic behavior of subgraph counts in a multidimensional random-connection model based on a Poisson point process, which can be used to model physical systems in, for example, statistical mechanics [Reference Giles, Georgiou and Carl9], wireless networks [Reference Georgiou, Bocus, Rahman, Dettmann and Coon8, Reference Mao, Zhang and Anderson19, Reference Ta, Mao and Anderson28], or cosmology [Reference Cunningham, Zuev and Krioukov5, Reference Fountoulakis and Yukich7].
The random-connection model, in which vertices are randomly located and connected with location-dependent probabilities, is a natural generalization of, for example, the Erdős–Rényi randomgraph or the stochastic block model [Reference Snijders and Nowicki27]. Namely, given µ a diffuse Radon measure on  $\mathbb{R}^d$, the random-connection model $G_H (\eta )$ consists of an underlying Poisson point process η on $\mathbb{R}^d$ with intensity of the form $\lambda \mu(\mathrm{d}x)$, λ > 0, in which any two vertices $x,y$ in η are connected with the probability $H(x,y)$, where $H:{\mathord{\mathbb R}}^d \times {\mathord{\mathbb R}}^d \to [0,1]$ is a symmetric connection function.
In addition to modeling the random locations of network nodes, many applications of wireless networks require the use of endpoints which are physical devices placed at given fixed locations, such as for example roadside units in vehicular networks such as VANETs, see, for example, [Reference Ng, Zhang, Zhang, Yang and Mao20] and [Reference Zhang, Chen, Yang, Wang, Zhang, Hong and Mao29]. The count of subgraphs that connect any single point x in the Poisson process η to m fixed endpoints  $y_1,\ldots , y_m\in {\mathord{\mathbb R}}^d$ is known to have a Poisson distribution with mean $ \lambda \int_{{\mathord{\mathbb R}}^d} H(x,y_1)\cdots H(x,y_m) \ \! \mu (\mathrm{d}x)$, see, for example, Section 4 in [Reference Privault23]. This Poisson property has been used in [Reference Kartun-Giles, Koufos, Lu and Niyato13] to derive closed-form estimates of two-hop connectivity in the random-connection model when m = 2, see Proposition III.2 therein.
In this paper, we consider the count of general connected subgraphs with a general configuration of fixed endpoints at fixed locations  $y_1 , \ldots,y_m \in \mathbb{R}^d$ in the random-connection model $G_H (\eta \cup \{y_1, \ldots ,y_m\})$ constructed on the union of the Poisson point process η and $\{y_1, \ldots ,y_m\}$. In particular, we extend the subgraph count cumulant formulas obtained on $G_H (\eta )$ in [Reference Liu and Privault16] by taking into account the presence of endpoints in $G_H (\eta \cup \{y_1, \ldots ,y_m\})$, and we provide SageMath coding implementations for joint cumulant expressions of any order.
In Proposition 3.4, we derive general expressions for the moments and cumulants of the count  $N^G_{y_1,\ldots , y_m}$ of subgraphs with fixed endpoints $y_1, \ldots ,y_m$ in $G_H (\eta\cup \{y_1, \ldots ,y_m\})$. Such expressions allow us to determine the dominant terms in the growth of cumulants as the intensity λ of the underlying point process tends to infinity, by estimating the counts of vertices and edges in connected partition diagrams as in, for example, [Reference Khorunzhiy14]. As a consequence, in Theorem 4.2, we obtain growth estimates for the cumulants of the subgraph count $N^G_{y_1,\ldots , y_m}$.
This allows us to show the convergence of renormalized subgraph counts to the normal distribution in Proposition 4.4 as the intensity λ of the underlying Poisson point process on  $\mathbb{R}^d$ tends to infinity. Convergence rates under the Kolmogorov distance are then obtained in Proposition 4.5 for the normal approximation of subgraph counts from the combinatorics of cumulants and the Statulevičius condition, see [Reference Döring, Jansen and Schubert6, Reference Rudzkis, Saulis and Statulevičius25] and Lemma B.1, extending the results obtained in [Reference Liu and Privault16] for subgraphs without endpoints, see also [Reference Grote and Thäle10] for other applications of this condition to concentration inequalities, normal approximation, and moderate deviations for random polytopes. In Proposition 4.6, connectivity probability estimates and bounds are derived using the second moment method and the factorial moment expansions in Proposition B.2.
In Section 5, we consider several examples of subgraphs with endpoints such as k-hop paths, triangles, and trees, for which exact cumulant computations are matched to their Monte Carlo estimates using the Rayleigh connection function  $H(x,y) = e^{- \beta \Vert x - y\Vert^2}$, β > 0. In those examples, we obtain graph connectivity estimates, and correlation estimates for joint graph counting, which are matched to the outputs of Monte Carlo simulations. In addition, using third order cumulant expressions, we also provide improved fits of probability density functions of renormalized subgraph counts when the Gaussian approximation is not valid, see Figure 9.
Computations are done in closed form using symbolic calculus in the SageMath coding implementations presented in Appendices D–E, and available for download at https://github.com/nprivaul/random-connection. We note that although intensive computations may be required, the types of connected subgraphs and associated configurations of endpoints considered are only limited by the available computing power.
This paper is organized as follows. Section 2 introduces some preliminaries on subgraph counting and the computation of moments using summations over partitions in the random-connection model. In Section 3, we use partition diagrams to compute the cumulants of the counts of subgraphs with endpoints in the random-connection model. Subgraph count asymptotics and the associated central limit theorem are given in Section 4, and numerical examples are presented in Section 5. A general derivation of joint cumulant identities is given in Appendix A, extending the construction of [Reference Liu and Privault16] from the univariate to the multivariate case, for use in Section 5.5. Basic results on Gram–Charlier expansions and probability approximation using cumulant and moment methods are recalled in Appendices B and C. The SageMath codes for the computation of cumulants and joint cumulants are listed in Appendices D and E, and available for download at https://github.com/nprivaul/random-connection.
2. Subgraph counts in the random-connection model
In what follows we consider a Radon measure µ on  ${\mathord{\mathbb R}}^d$, and we let $\mathbb{P}_\lambda$, λ > 0, denote the distribution of the Poisson point process η with intensity $\lambda \mu (\mathrm{d}x)$ on the space
 \begin{align*}
\mathcal{C}:=\left\{\eta \subset \mathbb{R}^d \ : \ |\eta \cap A| \lt \infty \,\text{for any bounded set } A\subset \mathbb{R}^d\right\}
\end{align*}
\begin{align*}
\mathcal{C}:=\left\{\eta \subset \mathbb{R}^d \ : \ |\eta \cap A| \lt \infty \,\text{for any bounded set } A\subset \mathbb{R}^d\right\}
\end{align*} of locally finite configurations on  $\mathbb{R}^d$, whose elements $\eta \in \Omega$ are identified with the Radon point measures $\displaystyle \eta = \sum_{x\in \eta } \epsilon_x$, so that $\eta (B)$ represents the random number of points contained in a Borel set in $\mathbb{R}^d$. In other words,
(1) for any relatively compact Borel set $B\subset \mathbb{R}^d$, the distribution of $\eta(B)$ under $\mathbb{P}_\lambda$ is Poisson with parameter $\lambda \mu (B)$;
(2) for any
$n{\geq} 2$ and pairwise disjoint relatively compact Borel sets $B_1, \ldots ,B_n\subset \mathbb{R}^d$, the random variables $\eta(B_1), \ldots ,\eta(B_n)$ are independent under $\mathbb{P}_\lambda$.


For  $n{\geq} 1$ we let $[n]:=\{1, \ldots ,n\}$, where n will later on denote the order of the considered moments and cumulants of subgraph counts, and for any set A we denote by $\Pi (A)$ the collection of all set partitions of A. We also let $|A|$ denote the number of elements of any finite set A, and, in particular, $|\sigma|$ represents the number of blocks in a partition $\sigma\in\Pi ([n]\times[r])$. Our approach to the computation of moments relies on moment identities on the following form, see Proposition 3.1 in [Reference Privault22] and Proposition A.5 for its multivariate generalization.
Proposition 2.1. Let  $n\ge1$ and $r \ge1$, and let $f :(\mathbb{R}^d)^r \to\mathbb{R}$ be a sufficiently integrable measurable function. We have
 \begin{align*}
\mathbb{E}\left[\left( \sum_{(x_1, \ldots ,x_r)\in\eta^r } f (x_1,\dots,x_r) \right)^n \right] = \hskip-0.3cm \sum_{\rho\in\Pi([n]\times[r])} \hskip-0.3cm \lambda^{|\rho|} \hskip-0.1cm \int_{(\mathbb{R}^d)^{|\rho|}} \prod_{k=1}^n f\big( x_{\zeta_\rho (k,1)}, \ldots , x_{\zeta_\rho (k,r)} \big) \ \! \mu(\mathrm{d}x_1) \cdots \mu(\mathrm{d}x_{|\rho|}),
\end{align*}
\begin{align*}
\mathbb{E}\left[\left( \sum_{(x_1, \ldots ,x_r)\in\eta^r } f (x_1,\dots,x_r) \right)^n \right] = \hskip-0.3cm \sum_{\rho\in\Pi([n]\times[r])} \hskip-0.3cm \lambda^{|\rho|} \hskip-0.1cm \int_{(\mathbb{R}^d)^{|\rho|}} \prod_{k=1}^n f\big( x_{\zeta_\rho (k,1)}, \ldots , x_{\zeta_\rho (k,r)} \big) \ \! \mu(\mathrm{d}x_1) \cdots \mu(\mathrm{d}x_{|\rho|}),
\end{align*} where, for  $\rho = \{\rho_1,\ldots , \rho_{|\rho |} \}$ a partition of $[n]\times[r]$, we let $\zeta_\rho (k,l)$ denote the index p of the block ρp of ρ to which (k, l) belongs.
In particular, Proposition 2.1 will yield cumulant expressions from Möbius inversion and combinatorial arguments based on [Reference Malyshev and Minlos18], [Reference Khorunzhiy14], and [Reference Liu and Privault16], see Propositions 3.5 and A.8.
Definition 2.2. Given  $H:\mathbb{R}^d\times \mathbb{R}^d\to[0,1]$ a symmetric connection function and $y_1 , \ldots,y_m$ fixed points in $\mathbb{R}^d$, the random-connection model $G_H (\eta \cup \{y_1, \ldots ,y_m\})$ is the random graph built on the union of $\{y_1 , \ldots,y_m \}$ and a Poisson point process sample η, in which any two distinct points $x,y\in \eta \cup \{y_1, \ldots ,y_m\}$ are independently connected by an edge with the probability $H(x,y)$.
In the sequel, we will consider a family of connected graphs with endpoints which are described in the following assumption.
Assume 2.3.
Given  $r {\geq} 2$ and
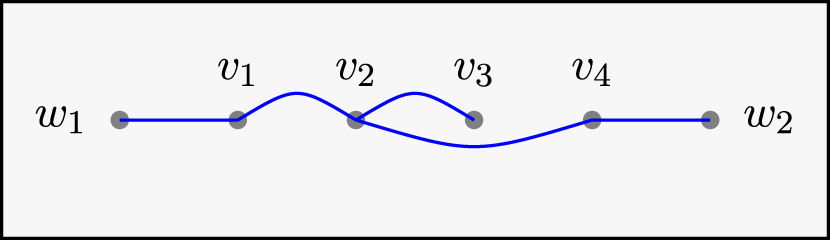
  $m{\geq} 0$, we consider a connected graph $G=(V_G,E_G)$ with edge set EG and vertex set $V_G=(v_1, \ldots ,v_r; {w_1,\ldots , w_m})$, such that
(i) the subgraph
$\mathsf{G}$ induced by G on $\{v_1, \ldots ,v_r\}$ is connected, and(ii) the endpoint vertices
$w_1, \ldots ,w_m$ are not adjacent to each other in G.


In case m = 0, Condition (ii) is void and  $V_G=(v_1, \ldots ,v_r)$.
In Figure 1, an example of a graph satisfying Assume 2.3 is described with r = 4 and m = 2.
Graph  $G=(V_G,E_G)$ with $V_G=(v_1, v_2,v_3,v_4;w_1,w_2)$, n = 3, r = 4, m = 2.
As a convention, in the next definition the sets  $\{w_1,\ldots , w_m\}$ and $\{y_1 , \ldots,y_m \} \subset \mathbb{R}^d$ are empty when m = 0.
Definition 2.4. Let G be a graph satisfying Assumption 2.3. Given  $m {\geq} 0$ fixed points $y_1 , \ldots,y_m \in \mathbb{R}^d$, for almost surely η we let $N_{y_1,\ldots , y_m}^G$ denote the count of subgraphs in $G_H (\eta \cup \{y_1,\ldots , y_m \} )$ that are isomorphic to $G=(V_G,E_G)$ in the sense that there exists a (random) injection from VG into $\eta \cup \{y_1,\ldots , y_m \}$ which is one-to-one from $\{{w_1,\ldots , w_m}\}$ to $\{y_1,\ldots , y_m\}$, and preserves the graph structure of G.
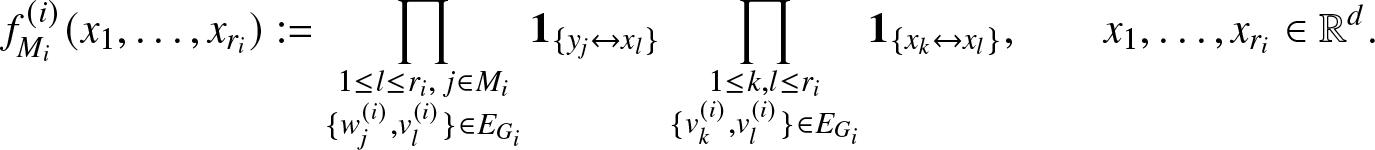
According to Definition 2.4, we express the subgraph count  $N^G_{y_1,\ldots , y_m}$ as
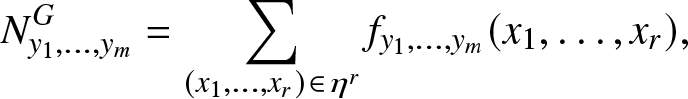 \begin{equation*}
N_{y_1,\ldots , y_m}^G=\sum_{(x_1, \ldots ,x_r)\in\eta^r }f_{y_1,\ldots , y_m} (x_1, \ldots ,x_r),
\end{equation*}
\begin{equation*}
N_{y_1,\ldots , y_m}^G=\sum_{(x_1, \ldots ,x_r)\in\eta^r }f_{y_1,\ldots , y_m} (x_1, \ldots ,x_r),
\end{equation*} where the random function  $f:({\mathord{\mathbb R}}^d)^r \to \{0,1\}$ defined as
 \begin{equation*}
f_{y_1,\ldots , y_m} (x_1, \ldots ,x_r):=
\prod_{
\substack{
1 \leq i \leq r
\\
1 \leq j \leq m
\\ \{v_i,w_j\}\in E_G }
}
\textbf{1}_{\{y_j\leftrightarrow x_i\}}
\prod_{\substack{1 \leq k,l \leq r
\\ \{v_k,v_l\}\in E_G}}\textbf{1}_{\{x_k \leftrightarrow x_l \}},
\qquad
x_1,\ldots , x_r \in \mathbb{R}^d,
\end{equation*}
\begin{equation*}
f_{y_1,\ldots , y_m} (x_1, \ldots ,x_r):=
\prod_{
\substack{
1 \leq i \leq r
\\
1 \leq j \leq m
\\ \{v_i,w_j\}\in E_G }
}
\textbf{1}_{\{y_j\leftrightarrow x_i\}}
\prod_{\substack{1 \leq k,l \leq r
\\ \{v_k,v_l\}\in E_G}}\textbf{1}_{\{x_k \leftrightarrow x_l \}},
\qquad
x_1,\ldots , x_r \in \mathbb{R}^d,
\end{equation*} is independent of the Poisson point process η, and  $\textbf{1}_{\{x\leftrightarrow y\}}=1$ if and only if x ≠ y and $x,y\in {\mathord{\mathbb R}}^d$ are connected in the random-connection model $G_H (\eta \cup \{y_1, \ldots ,y_m\})$.
3. Partition diagrams
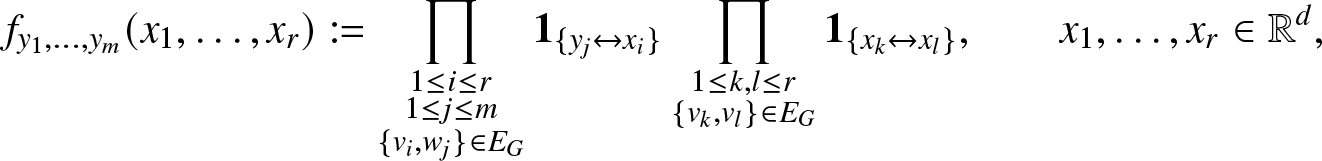
This section introduces the combinatorial background needed for the derivation of moment and cumulant expressions of subgraph counts. The next definition introduces a notion of connectedness over the rows of partitions of  $[n]\times [r]$, and a flatness property which is satisfied when two indices on a same row belong to a given block, see Chapter 4 of [Reference Peccati and Taqqu21] and Figure 2.
Definition 3.1. Given  $n,r{\geq} 1$, let $\pi:=\{\pi_1, \ldots ,\pi_n\}$ be the partition in $\Pi ([n]\times[r])$ given by
 \begin{align*}
\pi_i:=\left\{(i,1), \ldots ,(i,r)\right\},
\quad
i=1, \ldots , n.
\end{align*}
\begin{align*}
\pi_i:=\left\{(i,1), \ldots ,(i,r)\right\},
\quad
i=1, \ldots , n.
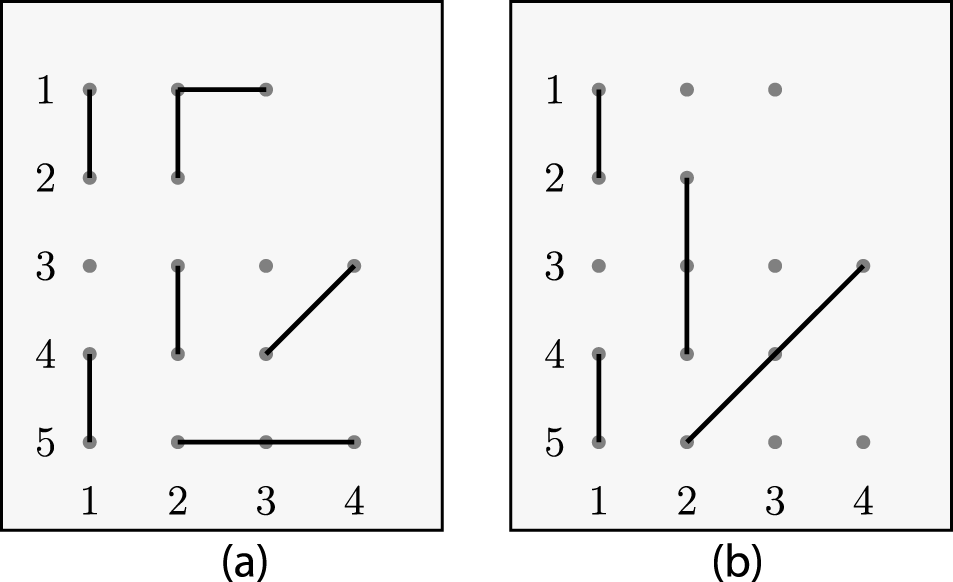
\end{align*}Two examples of partition diagrams with n = 5 and r = 4. (a) Flat non-connected diagram  ${\Gamma}(\rho, \pi)$. (b) Connected non-flat diagram ${\Gamma}(\rho, \pi)$.
(i) A set partition
$\sigma\in\Pi ([n]\times[r])$ is connected if $\sigma\vee\pi=\widehat{1}$, where $\sigma \vee\pi$ is the finest set partition which is coarser than both σ and π, and $\widehat{1} = \{[n]\times [r] \}$ is the coarsest partition of $[n]\times [r]$.(ii) A set partition
$\sigma\in\Pi ([n]\times[r])$ is non-flat if $\sigma\wedge\pi=\widehat{0}$, where $\sigma \wedge\pi$ is the coarsest set partition which is finer than both σ and π, and $\widehat{0}$ is the finest partition of $[n]\times [r]$.


We let  $\Pi_{\widehat{1}} ([n]\times[r])$ denote the collection of all connected partitions of $[n] \times [r]$.
In the sequel, every partition  $\rho \in \Pi(\pi_1\cup \cdots \cup \pi_n )$ will be arranged into a diagram denoted by $\Gamma(\rho ,\pi)$, by arranging $\pi_1,\dots,\pi_n$ into n rows and connecting together the elements of every block of ρ. Figure 2 presents two illustrations of flat non-connected and connected non-flat partition diagrams with n = 5 and r = 4, in which the partition ρ is represented using line segments.
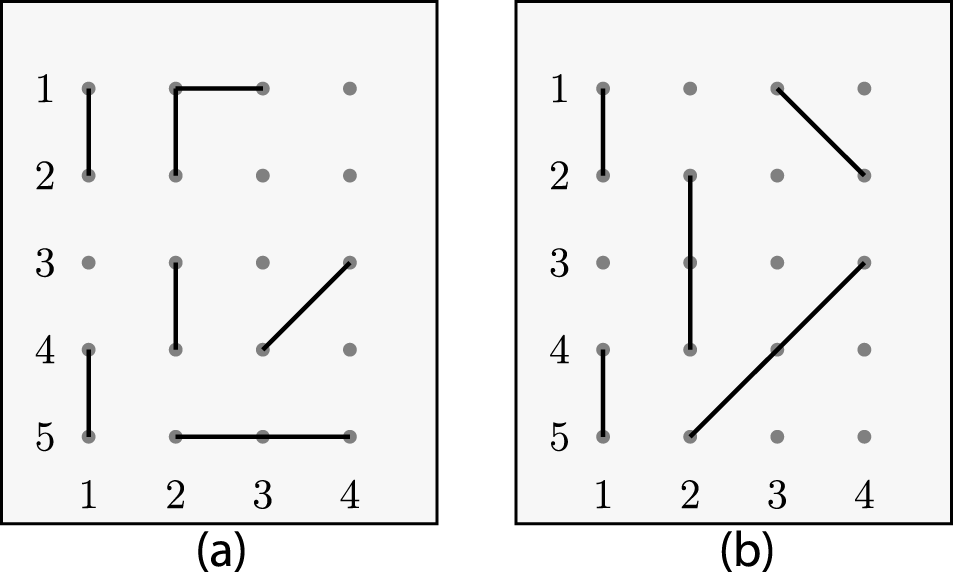
In Definition 3.2, to any graph G and set partition  $\rho\in\Pi ([n]\times[r])$, we associate a graph ρG whose vertices are the blocks of ρ. For this, we use n copies of the graphs induced by the vi’s with addition of the end-points $w_1,\ldots , w_m$, and we merge the nodes obtained in this way on $[n]\times [r]$ according to the partition ρ.
Definition 3.2. Given ρ a partition of  $[n]\times[r]$ and $G=(V_G,E_G)$ a connected graph on $V_G=(v_1, \ldots ,v_r; {w_1,\ldots , w_m})$, we let ρG denote the graph constructed as follows on $[m] \cup [n]\times [r]$:
(i) for all
$j_1, j_2\in [r]$, $j_1\not= j_2$, and $i\in [n]$, an edge links $(i,j_1)$ to $(i,j_2)$ iff $\{v_{j_1},v_{j_2}\}\in E_G$;(ii) for all
$(j,k)\in [r]\times [m]$ and $i\in [n]$, an edge links (k) to (i, j) iff $\{v_j,w_k\}\in E_G$;(iii) for all
$i_1,i_2\in [n]$ and $j_1,j_2\in [r]$, merge any two nodes $(i_1,j_1)$ and $(i_2,j_2)$ if they belong to a same block in ρ;(iv) eliminating any redundant edges created by the above construction.


If  $\rho\in\Pi ([n]\times[r])$ takes the form $\rho = \{b_1,\ldots , b_{|\rho |}\}$, the graph ρG forms a connected graph with $|\rho | + m$ vertices, and we reindex the set of vertices $V_{\rho_G}$ of ρG as $V_{\rho_G}=[|\rho | + m ]$ according to the lexicographic order on $\mathbb{N} \times \mathbb{N}$, followed by the remaining m vertices, indexed as $\{|\rho |+1,\ldots , |\rho | +m\}$, see Figure 3(b) in which we have $|\rho | =9$, m = 2, and $V_{\rho_G}=(1,\dots ,9;10, 11)$.
Example. Take r = 4, m = 2, and  $V_G=(v_1, v_2,v_3,v_4;w_1,w_2)$. Figure 3(b) shows the graph ρG defined from $G=(V_G,E_G)$ of Figure 1 and the 9-block partition $\rho \in \Pi ([3]\times[4])$ given by
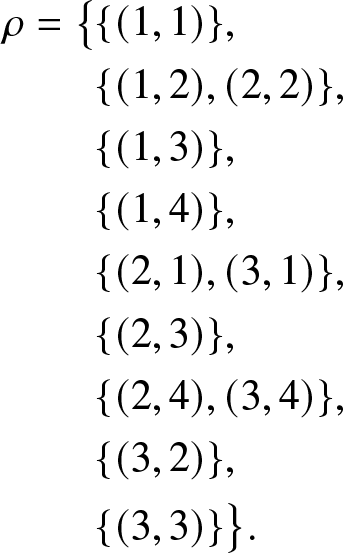 \begin{align*}
\rho = \big\{& \{(1,1)\},
\\
& \{(1,2),(2,2)\},
\\
& \{(1,3)\},
\\
& \{(1,4)\},
\\
& \{(2,1),(3,1)\},
\\
& \{(2,3)\},
\\
& \{(2,4),(3,4)\},
\\
& \{(3,2)\},
\\
& \{(3,3)\}\big\}.
\end{align*}
\begin{align*}
\rho = \big\{& \{(1,1)\},
\\
& \{(1,2),(2,2)\},
\\
& \{(1,3)\},
\\
& \{(1,4)\},
\\
& \{(2,1),(3,1)\},
\\
& \{(2,3)\},
\\
& \{(2,4),(3,4)\},
\\
& \{(3,2)\},
\\
& \{(3,3)\}\big\}.
\end{align*}Example of graph ρG with n = 3, r = 4, and m = 2. (a) Diagram before merging edges and vertices. (b) Graph  $\rho_{g}$ after merging edges and vertices.
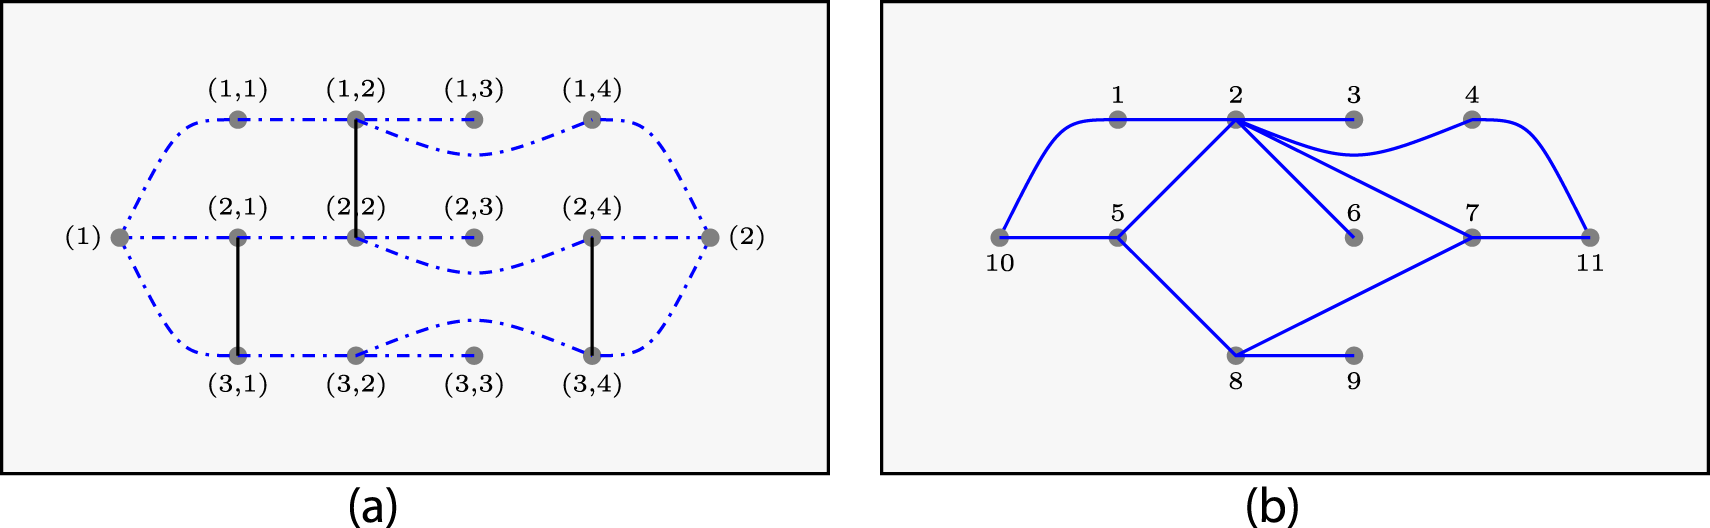
In Figure 3(a), the partition ρ is represented using line segments.
Definition 3.3. For  $\rho\in\Pi ([n]\times[r])$ of the form $\rho = \{b_1,\ldots , b_{|\rho |}\}$ and $j \in [m]$, we let
 \begin{equation*}
{\cal A}^\rho_j:=\{k \in [ |\rho | ] \ : \ \exists (s,i)\in b_k \mathrm{s.t.}
(v_i,w_j) \in E_G
\}
\end{equation*}
\begin{equation*}
{\cal A}^\rho_j:=\{k \in [ |\rho | ] \ : \ \exists (s,i)\in b_k \mathrm{s.t.}
(v_i,w_j) \in E_G
\}
\end{equation*} denote the neighborhood of the vertex  $(|\rho | + j)$ in ρG, $j=1,\ldots , m$.
For example, in the graph ρG of Figure 3 we have  ${\cal A}^\rho_1=\{1,5\}$ and ${\cal A}^\rho_2=\{4,7\}$. The following partition summation formulas extend [Reference Liu and Privault16, Prop. 5.1] to the counting of subgraphs with endpoints, and they are a special case of Proposition A.8 in appendix, which deals with joint subgraph counting.
Proposition 3.4. Let  $m{\geq} 0$. The moments and cumulants of $N_{y_1,\ldots , y_m}^G$ admit the following expressions:
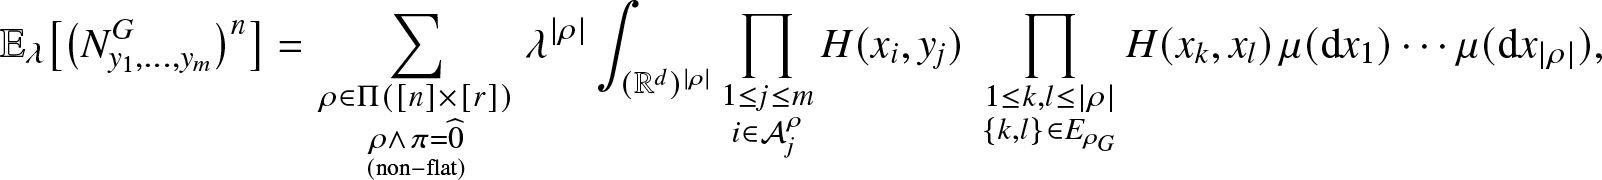 \begin{align*}
\mathbb{E}_\lambda \big[\big(N_{y_1,\ldots , y_m}^G\big)^n\big]=
\sum_{\substack{\rho\in\Pi ([n]\times[r])
\\\rho\wedge\pi=\widehat{0}} \atop {\mathrm{(non-flat)}}}
\lambda^{|\rho |}
\int_{(\mathbb{R}^d)^{|\rho|}}\prod_{\substack{
1 \leq j \leq m
\\ i\in {\cal A}^\rho_j}}
H(x_i,y_j)
\ \prod_{
\substack{1 \leq k , l \le|\rho|
\\
\{k , l \}\in E_{\rho_G}
}}H(x_k,x_l) \ \! \mu ( \mathrm{d}x_1 ) \cdots \mu ( \mathrm{d}x_{|\rho|}),
\end{align*}
\begin{align*}
\mathbb{E}_\lambda \big[\big(N_{y_1,\ldots , y_m}^G\big)^n\big]=
\sum_{\substack{\rho\in\Pi ([n]\times[r])
\\\rho\wedge\pi=\widehat{0}} \atop {\mathrm{(non-flat)}}}
\lambda^{|\rho |}
\int_{(\mathbb{R}^d)^{|\rho|}}\prod_{\substack{
1 \leq j \leq m
\\ i\in {\cal A}^\rho_j}}
H(x_i,y_j)
\ \prod_{
\substack{1 \leq k , l \le|\rho|
\\
\{k , l \}\in E_{\rho_G}
}}H(x_k,x_l) \ \! \mu ( \mathrm{d}x_1 ) \cdots \mu ( \mathrm{d}x_{|\rho|}),
\end{align*}and
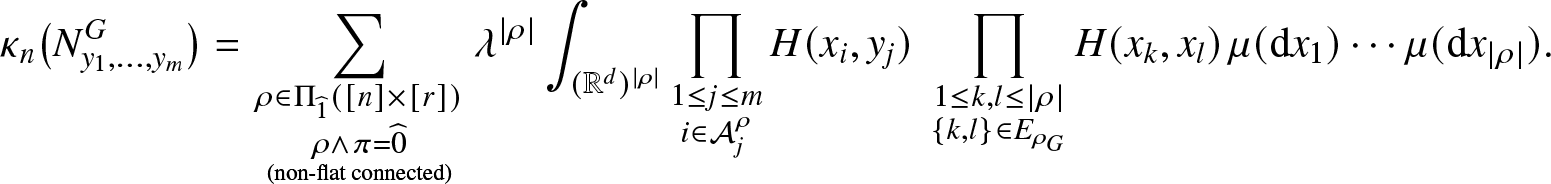 \begin{equation}
\kappa_n\big(N_{y_1,\ldots , y_m}^G\big)=
\sum_{\substack{\rho\in\Pi_{\widehat{1}} ([n]\times[r])
\\\rho\wedge\pi=\widehat{0}} \atop {\textrm{(non-flat connected)}}}
\lambda^{|\rho |}
\int_{(\mathbb{R}^d)^{|\rho|}}\prod_{
\substack{
1 \leq j \leq m
\\
i\in {\cal A}^\rho_j}} H(x_i,y_j)
\ \prod_{\substack{
1\leq k , l \le|\rho|
\\
\{k , l \}\in E_{\rho_G} }}H(x_k,x_l) \ \! \mu ( \mathrm{d}x_1)
\cdots \mu ( \mathrm{d}x_{|\rho|} ).
\end{equation}
\begin{equation}
\kappa_n\big(N_{y_1,\ldots , y_m}^G\big)=
\sum_{\substack{\rho\in\Pi_{\widehat{1}} ([n]\times[r])
\\\rho\wedge\pi=\widehat{0}} \atop {\textrm{(non-flat connected)}}}
\lambda^{|\rho |}
\int_{(\mathbb{R}^d)^{|\rho|}}\prod_{
\substack{
1 \leq j \leq m
\\
i\in {\cal A}^\rho_j}} H(x_i,y_j)
\ \prod_{\substack{
1\leq k , l \le|\rho|
\\
\{k , l \}\in E_{\rho_G} }}H(x_k,x_l) \ \! \mu ( \mathrm{d}x_1)
\cdots \mu ( \mathrm{d}x_{|\rho|} ).
\end{equation} We note in particular that  $N_{y_1,\ldots , y_m}^G$ has positive cumulants, and when n = 1 the first moment of $N_{y_1,\ldots , y_m}^G$ is given by
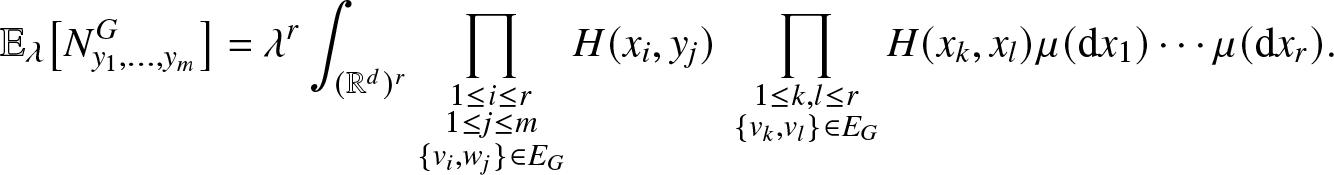 \begin{align*}
\mathbb{E}_\lambda \big[ N_{y_1,\ldots , y_m}^G \big]
= \lambda^r
\int_{(\mathbb{R}^d)^r}
\prod_{
\substack{
1 \leq i \leq r \\
1 \leq j \leq m
\\
\{v_i,w_j\} \in E_G
}} H(x_i,y_j)
\ \prod_{\substack{
1\leq k , l \leq r
\\
\{v_k , v_l \}\in E_G}}H(x_k,x_l)
\mu ( \mathrm{d}x_1)
\cdots
\mu ( \mathrm{d}x_r).
\end{align*}
\begin{align*}
\mathbb{E}_\lambda \big[ N_{y_1,\ldots , y_m}^G \big]
= \lambda^r
\int_{(\mathbb{R}^d)^r}
\prod_{
\substack{
1 \leq i \leq r \\
1 \leq j \leq m
\\
\{v_i,w_j\} \in E_G
}} H(x_i,y_j)
\ \prod_{\substack{
1\leq k , l \leq r
\\
\{v_k , v_l \}\in E_G}}H(x_k,x_l)
\mu ( \mathrm{d}x_1)
\cdots
\mu ( \mathrm{d}x_r).
\end{align*}The cumulant formula of Proposition 3.4 is implemented in the code listed in Appendix D. We also recall the following lemma, see [Reference Liu and Privault16, Lem. 2.8], in which maximality of connected non-flat partitions refers to maximizing the number of blocks.
(i) The cardinality of the set
$\mathcal{C} (n,r)$ of connected non-flat partitions of $[n]\times[r]$ satisfies
(3.2)\begin{equation}
|\mathcal{C} (n,r) | \leq n!^r r!^{n-1},
\qquad n,r {\geq} 1.
\end{equation}(ii) The cardinality of the set
$ \mathcal{M}(n,r)$ of maximal connected non-flat partition of $[n]\times[r]$ satisfies
\begin{equation*}
|\mathcal{M}(n,r)|=r^{n-1}\prod_{i=1}^{n-1}(1+(r-1)i),
\qquad n,r{\geq} 1,
\end{equation*}with the bounds
(3.3)\begin{equation}
( (r-1)r )^{n-1}(n-1)!\leq
|\mathcal{M}(n,r)|
\leq ( (r-1)r )^{n-1}n!, \quad n{\geq} 1, \ r{\geq} 2.
\end{equation}


4. Subgraph count asymptotics
In this section, we let  $m{\geq} 1$ and investigate the asymptotic behavior of the cumulants $\kappa_n\big(N_{y_1,\ldots , y_m}^G\big)$ in (3.1) as the intensity λ tends to infinity, which extends the treatment of [Reference Liu and Privault16] from m = 0 to $m{\geq} 1$.
Assume 4.1.
We assume that
(i) µ is the Lebesgue measure on
${\mathord{\mathbb R}}^d$, and(ii) the connection function
$H:\mathbb{R}^d\times \mathbb{R}^d\to[0,1]$ is translation invariant, that is $H(x,y) = H(0,y-x)$, $x,y \in {\mathord{\mathbb R}}^d$, and
\begin{align*}
\int_{{\mathord{\mathbb R}}^d} H(0,y) \mathrm{d}y \lt \infty.
\end{align*}


The following result provides growth estimates for the cumulants of  $N^G_{y_1,\ldots , y_m}$.
Theorem 4.2 Let  $m{\geq} 1$, $n{\geq} 1$ and $r{\geq} 2$, and suppose that Assume 4.1 is satisfied. We have
 \begin{equation}
0 \lt \kappa_n\big( N_{y_1,\ldots , y_m}^G \big)\leq
n!^r r!^{n-1}
(C \lambda )^{1+(r-1)n}
,
\end{equation}
\begin{equation}
0 \lt \kappa_n\big( N_{y_1,\ldots , y_m}^G \big)\leq
n!^r r!^{n-1}
(C \lambda )^{1+(r-1)n}
,
\end{equation}and, for n = 2,
 \begin{equation}
(r-1)r
c^{2r}
\lambda^{2r-1}
\leq \kappa_2\big(N_{y_1,\ldots , y_m}^G\big)
\leq
r!
( C \lambda )^{2r-1},
\end{equation}
\begin{equation}
(r-1)r
c^{2r}
\lambda^{2r-1}
\leq \kappa_2\big(N_{y_1,\ldots , y_m}^G\big)
\leq
r!
( C \lambda )^{2r-1},
\end{equation} where  $c, C \gt 0$ are constants independent of $r{\geq} 2$ and $n {\geq} 2$.
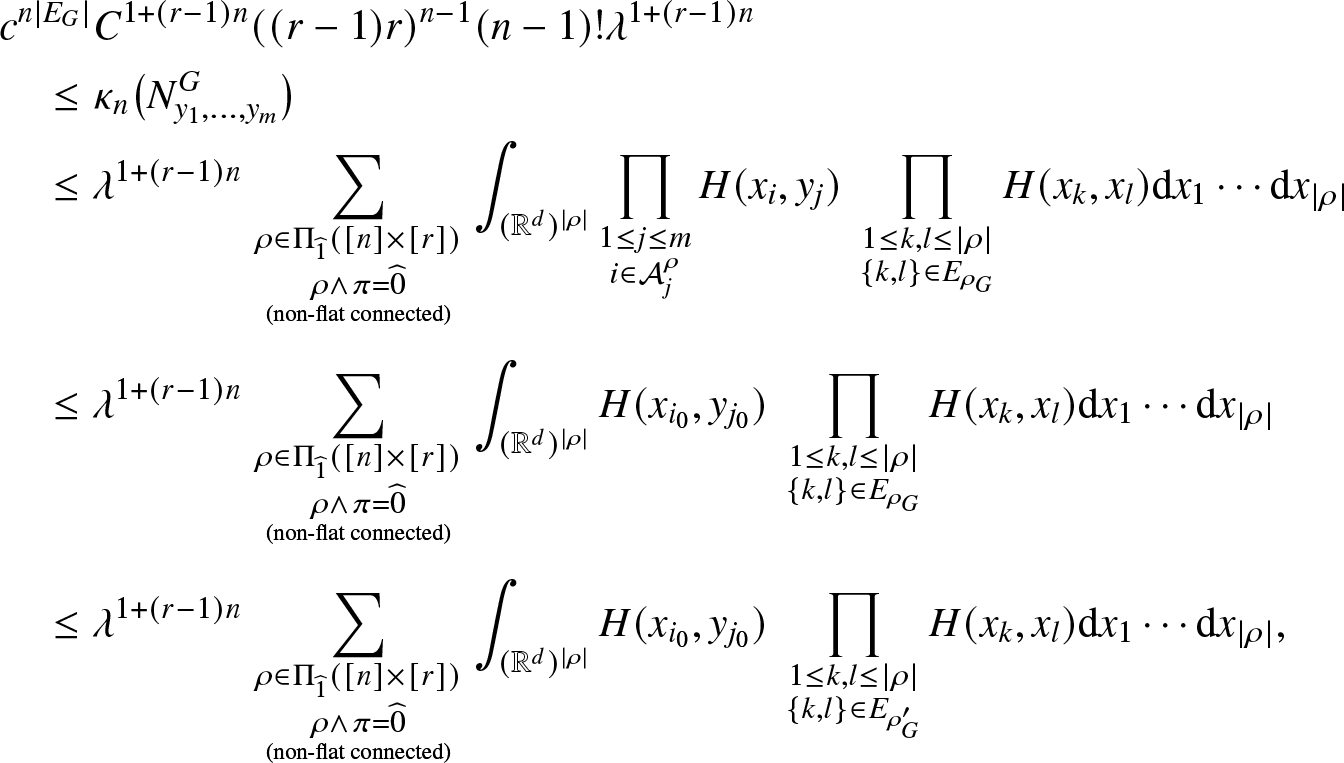
Proof. According to Proposition 3.4, every non-flat connected partition  $\rho\in\Pi ([n]\times[r])$ corresponds to a summand of order $O(\lambda^{|\rho| })$. As the cardinality of maximal non-flat connected partitions is $1+(r-1)n$, the dominating asymptotic order is $O(\lambda^{1+(r-1)n })$. Precisely, by (3.2)–(3.3) and (3.1), letting $j_0\in \{1,\ldots , m\}$ such that ${\cal A}^\rho_{j_0} \not= \emptyset$, for some $i_0 \in {\cal A}^\rho_{j_0}$ we have
 \begin{align*}
&
c^{n|E_G|}
C^{1+(r-1)n}
( (r-1)r )^{n-1}(n-1)!
\lambda^{1+(r-1)n}
\\
& \quad \leq \kappa_n\big(N_{y_1,\dots,y_m}^G\big)
\\
& \quad
\leq
\lambda^{1+(r-1)n}
\sum_{\substack{\rho\in\Pi_{\widehat{1}} ([n]\times[r])
\\\rho\wedge\pi=\widehat{0}} \atop {\textrm{(non-flat connected)} \atop
}}
\int_{(\mathbb{R}^d)^{|\rho|}}\prod_{
\substack{
1 \leq j \leq m
\\
i\in {\cal A}^\rho_j}} H (x_i,y_j)
\ \prod_{\substack{
1\leq k , l \le|\rho|
\\
\{k , l \}\in E_{\rho_G} }}H (x_k,x_l)\mathrm{d}x_1
\cdots \mathrm{d}x_{|\rho|}
\\
& \quad
\leq
\lambda^{1+(r-1)n}
\sum_{\substack{\rho\in\Pi_{\widehat{1}} ([n]\times[r])
\\\rho\wedge\pi=\widehat{0}} \atop {\textrm{(non-flat connected)} \atop
}}
\int_{(\mathbb{R}^d)^{|\rho|}}
H (x_{i_0},y_{j_0})
\ \prod_{\substack{
1\leq k , l \le|\rho|
\\
\{k , l \}\in E_{\rho'_G} }}H (x_k,x_l)\mathrm{d}x_1
\cdots \mathrm{d}x_{|\rho|},
\end{align*}
\begin{align*}
&
c^{n|E_G|}
C^{1+(r-1)n}
( (r-1)r )^{n-1}(n-1)!
\lambda^{1+(r-1)n}
\\
& \quad \leq \kappa_n\big(N_{y_1,\dots,y_m}^G\big)
\\
& \quad
\leq
\lambda^{1+(r-1)n}
\sum_{\substack{\rho\in\Pi_{\widehat{1}} ([n]\times[r])
\\\rho\wedge\pi=\widehat{0}} \atop {\textrm{(non-flat connected)} \atop
}}
\int_{(\mathbb{R}^d)^{|\rho|}}\prod_{
\substack{
1 \leq j \leq m
\\
i\in {\cal A}^\rho_j}} H (x_i,y_j)
\ \prod_{\substack{
1\leq k , l \le|\rho|
\\
\{k , l \}\in E_{\rho_G} }}H (x_k,x_l)\mathrm{d}x_1
\cdots \mathrm{d}x_{|\rho|}
\\
& \quad
\leq
\lambda^{1+(r-1)n}
\sum_{\substack{\rho\in\Pi_{\widehat{1}} ([n]\times[r])
\\\rho\wedge\pi=\widehat{0}} \atop {\textrm{(non-flat connected)} \atop
}}
\int_{(\mathbb{R}^d)^{|\rho|}}
H (x_{i_0},y_{j_0})
\ \prod_{\substack{
1\leq k , l \le|\rho|
\\
\{k , l \}\in E_{\rho_G} }}H (x_k,x_l)\mathrm{d}x_1
\cdots \mathrm{d}x_{|\rho|}
\\
& \quad
\leq
\lambda^{1+(r-1)n}
\sum_{\substack{\rho\in\Pi_{\widehat{1}} ([n]\times[r])
\\\rho\wedge\pi=\widehat{0}} \atop {\textrm{(non-flat connected)} \atop
}}
\int_{(\mathbb{R}^d)^{|\rho|}}
H (x_{i_0},y_{j_0})
\ \prod_{\substack{
1\leq k , l \le|\rho|
\\
\{k , l \}\in E_{\rho'_G} }}H (x_k,x_l)\mathrm{d}x_1
\cdots \mathrm{d}x_{|\rho|},
\end{align*} where for every  $\rho \in \Pi_{\widehat{1}} ([n]\times[r])$, $\rho'_G$ is a spanning tree contained in ρG, with vertices $\{1,\dots,|\rho|,|\rho|+j\}$ and such that $|\rho|+j_0$ is a leaf. By integrating successively on the variables which correspond to leaves of $\rho'_G$ as in the proofs of, for example, Theorem 7.1 of [Reference Last, Nestmann and Schulte15] or Lemma 3.1 of [Reference Can and Trinh3] and using (3.2), we obtain
 \begin{align*}
\kappa_n\big(N_{y_1,\dots,y_m}^G\big)\leq (C\lambda)^{1+(r-1)n}n!^rr!^{n-1},
\end{align*}
\begin{align*}
\kappa_n\big(N_{y_1,\dots,y_m}^G\big)\leq (C\lambda)^{1+(r-1)n}n!^rr!^{n-1},
\end{align*} due to Assume 4.1-(ii), where  $C:= \max \big( 1 , \int_{{\mathord{\mathbb R}}^d} H(0,y) dy \big)$, which yields the right-hand side (4.1). In addition, Proposition 3.4 shows that all cumulants are positive, which completes the proof of (4.1). On the other hand, when $r{\geq} 2$, by (3.3) we have
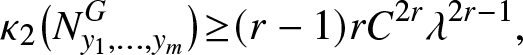 \begin{equation*}
\nonumber
\kappa_2\big(N^G_{y_1,\ldots , y_m}\big){\geq} (r-1)rC^{2r} \lambda^{2r-1},
\end{equation*}
\begin{equation*}
\nonumber
\kappa_2\big(N^G_{y_1,\ldots , y_m}\big){\geq} (r-1)rC^{2r} \lambda^{2r-1},
\end{equation*} where C > 0 is a constant independent of  $r {\geq} 2$ and $n {\geq} 2$, which shows (4.2).
In what follows, we consider the centered and normalized subgraph count cumulants defined as
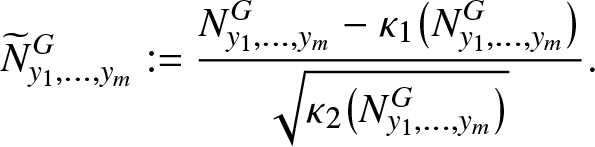 \begin{align*}
\widetilde{N}_{y_1,\ldots , y_m}^G
:= \frac{N_{y_1,\ldots , y_m}^G - \kappa_1 \big(N_{y_1,\ldots , y_m}^G \big)}{\sqrt{\kappa_2\big( N_{y_1,\ldots , y_m}^G \big)}}.
\end{align*}
\begin{align*}
\widetilde{N}_{y_1,\ldots , y_m}^G
:= \frac{N_{y_1,\ldots , y_m}^G - \kappa_1 \big(N_{y_1,\ldots , y_m}^G \big)}{\sqrt{\kappa_2\big( N_{y_1,\ldots , y_m}^G \big)}}.
\end{align*}Corollary 4.3. Let  $m{\geq} 1$, $n{\geq} 2$ and $r{\geq} 2$. We have
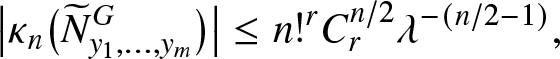 \begin{equation*}
\big|\kappa_n\big(\widetilde{N}_{y_1,\ldots , y_m}^G\big)\big|\leq n!^r
C_r^{n/2}
\lambda^{-(n/2-1)},
\end{equation*}
\begin{equation*}
\big|\kappa_n\big(\widetilde{N}_{y_1,\ldots , y_m}^G\big)\big|\leq n!^r
C_r^{n/2}
\lambda^{-(n/2-1)},
\end{equation*} where  $C_r \gt 0$ is a constant depending only on $r {\geq} 2$.
As a consequence of Corollary 4.3, the skewness of  $\widetilde{N}_{y_1,\ldots , y_m}^G$ satisfies
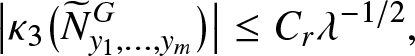 \begin{equation}
\big| \kappa_3 \big( \widetilde{N}_{y_1,\ldots , y_m}^G \big)\big|
\leq
C_r \lambda^{-1/2},
\end{equation}
\begin{equation}
\big| \kappa_3 \big( \widetilde{N}_{y_1,\ldots , y_m}^G \big)\big|
\leq
C_r \lambda^{-1/2},
\end{equation} where  $C_r \gt 0$ is a constant depending only on $r {\geq} 2$.
Proposition 4.4. Let  $m{\geq} 1$. The renormalized subgraph count $\widetilde{N}_{y_1,\ldots , y_m}^G$ converges in distribution to the standard normal distribution ${\cal N}(0,1)$ as λ tends to infinity.
Proof. From Corollary 4.3 and (4.3), we have  $\kappa_1 \big( \widetilde{N}_{y_1,\ldots , y_m}^G \big) = 0$, $\kappa_2 \big( \widetilde{N}_{y_1,\ldots , y_m}^G \big) = 1$, and
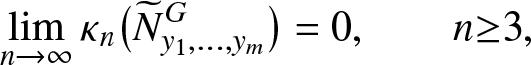 \begin{align*}
\lim_{n\to \infty}
\kappa_n \big( \widetilde{N}_{y_1,\ldots , y_m}^G \big) = 0, \qquad n{\geq} 3,
\end{align*}
\begin{align*}
\lim_{n\to \infty}
\kappa_n \big( \widetilde{N}_{y_1,\ldots , y_m}^G \big) = 0, \qquad n{\geq} 3,
\end{align*}hence the conclusion follows from Theorem 1 in [Reference Janson11].
In addition, from Corollary 4.3 and Lemma B.1, the convergence result of Proposition 4.4 can be made more precise via the following convergence bound in the Kolmogorov distance, which extends Corollary 7.1 in [Reference Liu and Privault16] from m = 0 to  $m{\geq} 1$.
Proposition 4.5. Let  $m{\geq} 1$. We have
 \begin{equation*}
\sup_{x\in\mathbb{R}}\big|\mathbb{P}_\lambda \big(\widetilde{N}_{y_1,\ldots , y_m}^G \leq x\big)-\Phi(x)\big|\leq C_r \lambda^{- 1 / ( 4r-2 )},
\qquad r{\geq} 2,
\end{equation*}
\begin{equation*}
\sup_{x\in\mathbb{R}}\big|\mathbb{P}_\lambda \big(\widetilde{N}_{y_1,\ldots , y_m}^G \leq x\big)-\Phi(x)\big|\leq C_r \lambda^{- 1 / ( 4r-2 )},
\qquad r{\geq} 2,
\end{equation*} where  $C_r \gt 0$ is a constant depending only on $r{\geq} 2$ and Φ is the cumulative distribution function of the standard normal distribution.
By the second moment method, see, for example, (3.4) page 54 of [Reference Janson, Łuczak and Rucinski12] or Theorem 2.3 in [Reference Roch24], we also obtain the following lower bound for endpoint connectivity and subgraph existence.
Proposition 4.6. Let  $m{\geq} 1$. We have
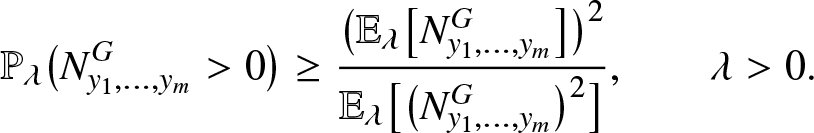 \begin{equation}
\mathbb{P}_\lambda \big(
{N}_{y_1,\ldots , y_m}^G \gt 0 \big) \geq
\frac{\big( \mathbb{E}_\lambda \big[
N_{y_1,\ldots , y_m}^G
\big]\big)^2}{
\mathbb{E}_\lambda \big[ \big( N_{y_1,\ldots , y_m}^G \big)^2\big]},
\qquad \lambda \gt 0.
\end{equation}
\begin{equation}
\mathbb{P}_\lambda \big(
{N}_{y_1,\ldots , y_m}^G \gt 0 \big) \geq
\frac{\big( \mathbb{E}_\lambda \big[
N_{y_1,\ldots , y_m}^G
\big]\big)^2}{
\mathbb{E}_\lambda \big[ \big( N_{y_1,\ldots , y_m}^G \big)^2\big]},
\qquad \lambda \gt 0.
\end{equation}Theorem 4.2 also shows the bounds
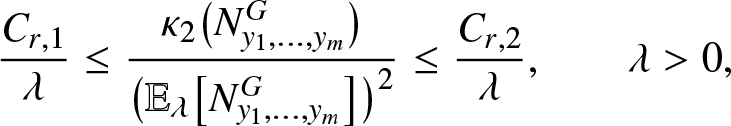 \begin{equation}
\frac{C_{r,1}}{\lambda}
\leq
\frac{\kappa_2 \big(N_{y_1,\dots,y_m}^G\big)}{
\big( \mathbb{E}_\lambda \big[ {N}_{y_1,\ldots , y_m}^G \big] \big)^2
}
\leq
\frac{C_{r,2}}{\lambda},
\qquad \lambda \gt 0,
\end{equation}
\begin{equation}
\frac{C_{r,1}}{\lambda}
\leq
\frac{\kappa_2 \big(N_{y_1,\dots,y_m}^G\big)}{
\big( \mathbb{E}_\lambda \big[ {N}_{y_1,\ldots , y_m}^G \big] \big)^2
}
\leq
\frac{C_{r,2}}{\lambda},
\qquad \lambda \gt 0,
\end{equation} for some constants  $C_{r,1},C_{r,2} \gt 0$ depending only on $r{\geq} 2$, from which it follows that the lower bound (4.4) converges to 1 as λ tends to infinity.
5. Numerical examples
In this section, we assume that H is the Rayleigh connection function
 \begin{align*}
H_\beta (x,y):=e^{-\beta\|x-y\|^2}, \qquad x,y\in {\mathord{\mathbb R}}^d,
\end{align*}
\begin{align*}
H_\beta (x,y):=e^{-\beta\|x-y\|^2}, \qquad x,y\in {\mathord{\mathbb R}}^d,
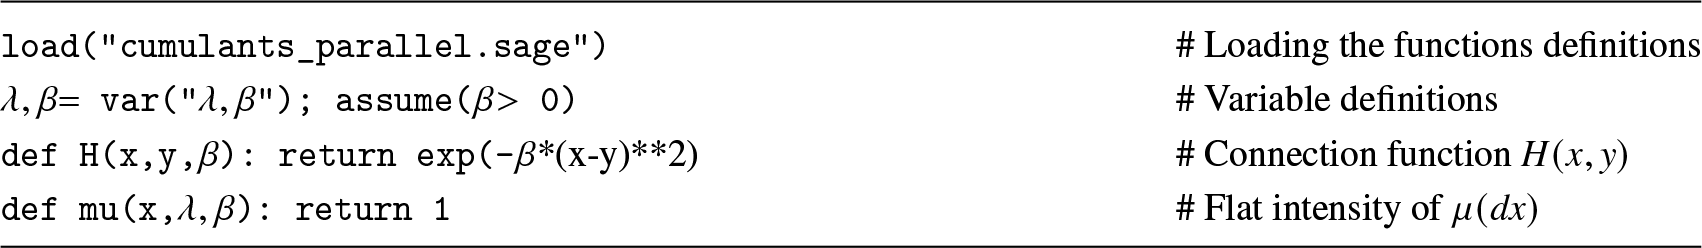
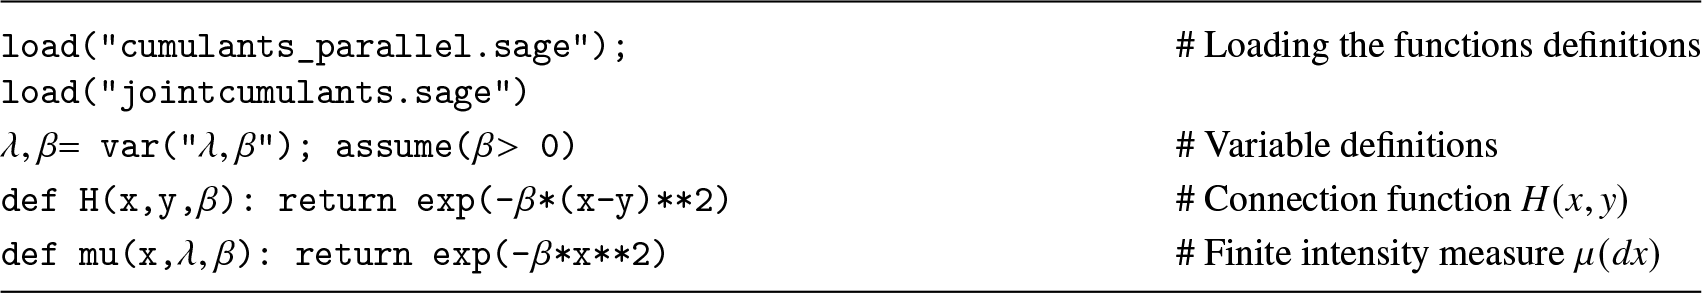
\end{align*} where β > 0, and µ is the Lebesgue measure on  ${\mathord{\mathbb R}}^d$. In this case, Assume 4.1 is satisfied. In the following examples, the SageMath code listed in Appendix D is run after loading the definitions of Table 1.
Functions definitions.
Computations in this and the following examples are run on a standard desktop computer with an 8-core CPU at 4.10 GHz. The limitations imposed by this hardware configuration constrain the product  $n\times r \times d$ to be below 15 approximately, in order to maintain computation times at a reasonable level. The illustrations of Figures 4, 6, 8, and 10 are provided in dimension d = 2 for ease of visualization only. Actual computations may be provided in lower dimension d, due to hardware performance constraints when the cumulant order n is beyond 4. Computations in dimension d = 2 are presented in Section 5.3 for triangles with endpoints and in Section 5.4 for trees with one endpoint cumulants of orders 2 and 3, while in Section 5.1 for three-hop paths with two endpoint and in Section 5.2 for four-hop paths with two endpoints we take d = 1 in order to reach the cumulant orders n = 6 and n = 4. In subsequent code inputs, graphs are coded by their edge set EG, and the set of endpoints is given by the sequence $\mathsf{EP} = [\mathsf{EP}_1,\ldots , \mathsf{EP}_m]$, where $\mathsf{EP}_i$ denotes the set of vertices of the subgraph $\mathsf{G}$ on $\{v_1, \ldots ,v_r\}$ which are attached to the ith endpoint, $i=1,\ldots , m$, with $\mathsf{EP} :=[ \ ]$ the empty sequence when G has no endpoint (m = 0).
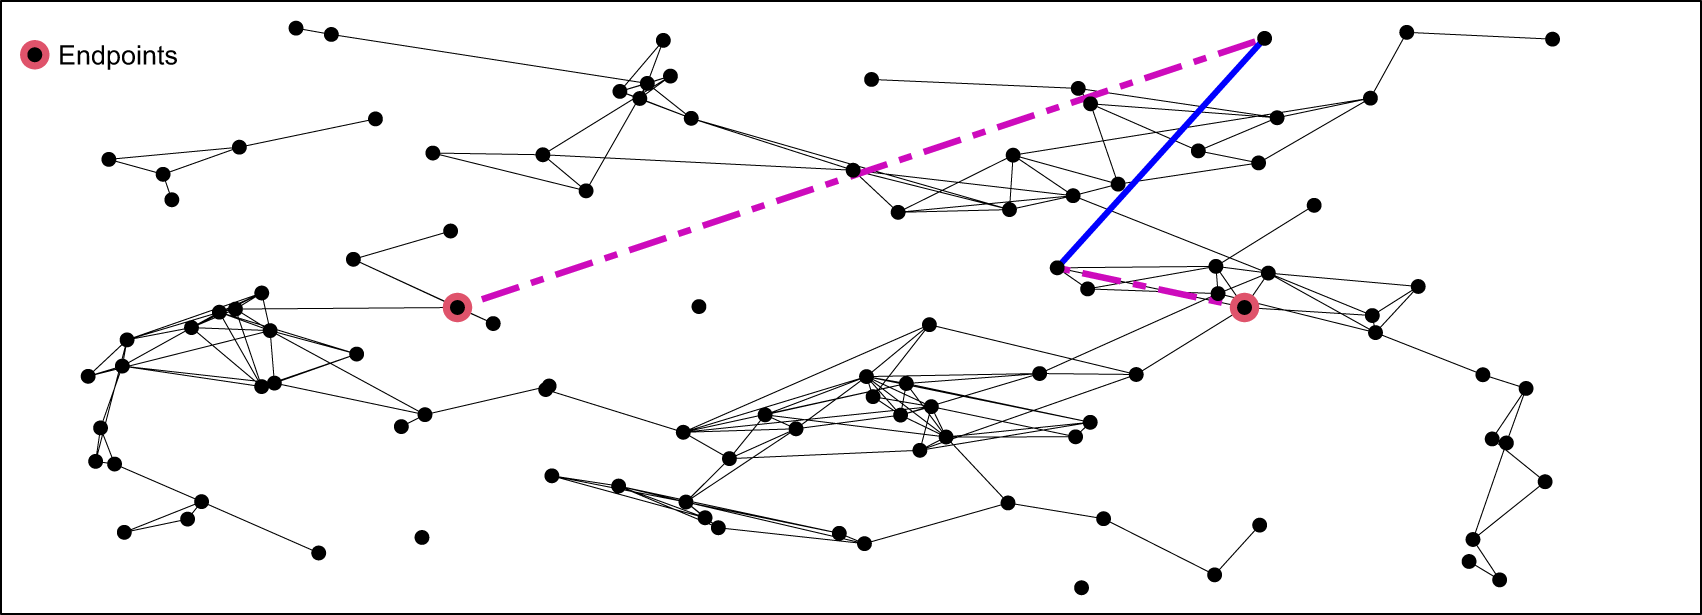
5.1. Three-hop paths with two endpoints
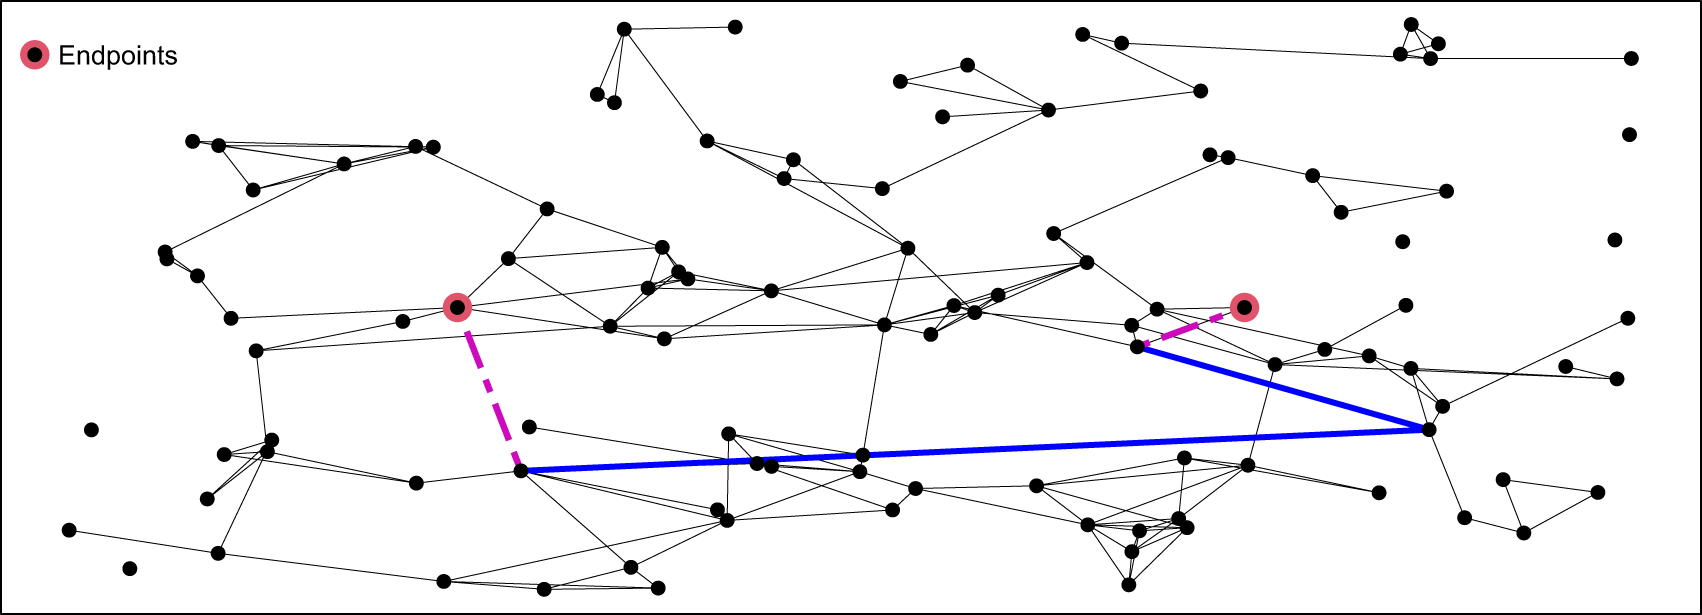
By a k-hop path, we mean a non-self intersecting path having k edges. We take m = 2, r = 2, and in Table 2 we compute the first three cumulants of  $N^G_{y_1,y_2}$ when G is a three-hop path with two endpoints in dimension d = 1, see Figure 4 for an illustration in dimension d = 2. Unlike in the two-hop with two endpoints case, this three-hop count does not have a Poisson distribution. In the following Figures 4, 6, 8, and
To make cumulant expressions more compact, the exact formulas in Table 2 are expressed with  $y_1=y_2=0$ and $\beta := \pi$, in dimension d = 1.
10, the endpoints are denoted by red dots, and their edges are denoted by purple dashed lines.
$\beta := \pi$, in dimension d = 1.
10, the endpoints are denoted by red dots, and their edges are denoted by purple dashed lines.
A three-hop path with two endpoints in dimension d = 2.
Cumulants of the count of two-hop paths with two endpoints in dimension d = 1.
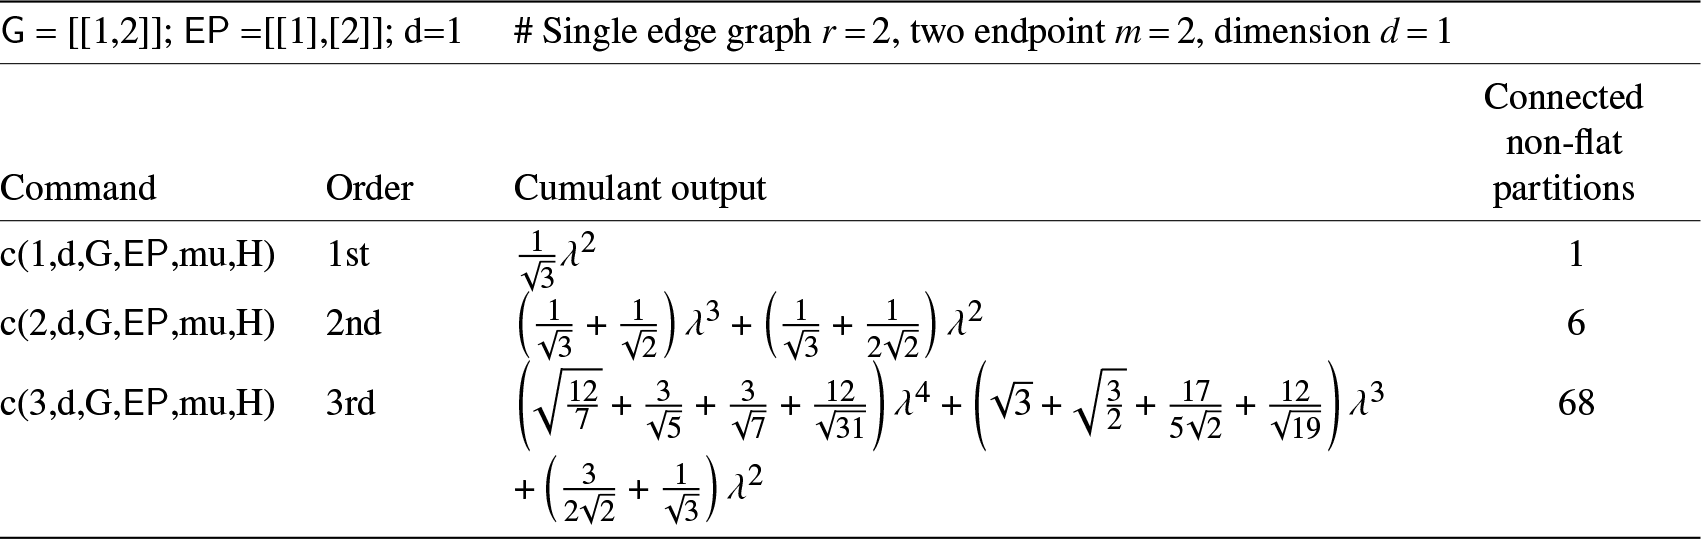
Table 3 lists the counts of connected non-flat partitions and runtimes for the computation of cumulants of orders 1–6 and shows that such partitions represent only a fraction (around 25%) of total partition counts.
Computation times and counts of connected non-flat vs. all partitions in  $\Pi ([n]\times[2])$.
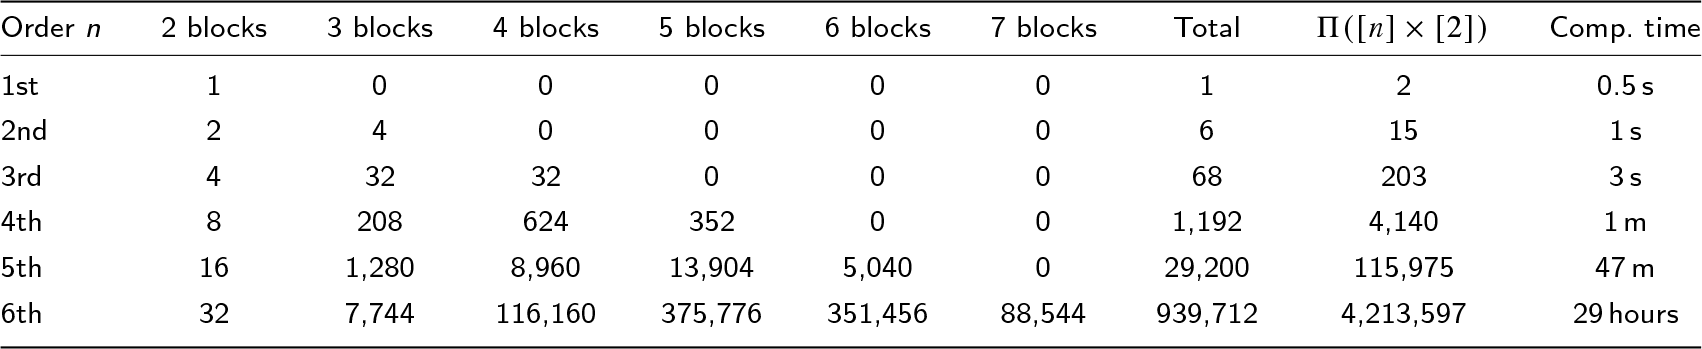
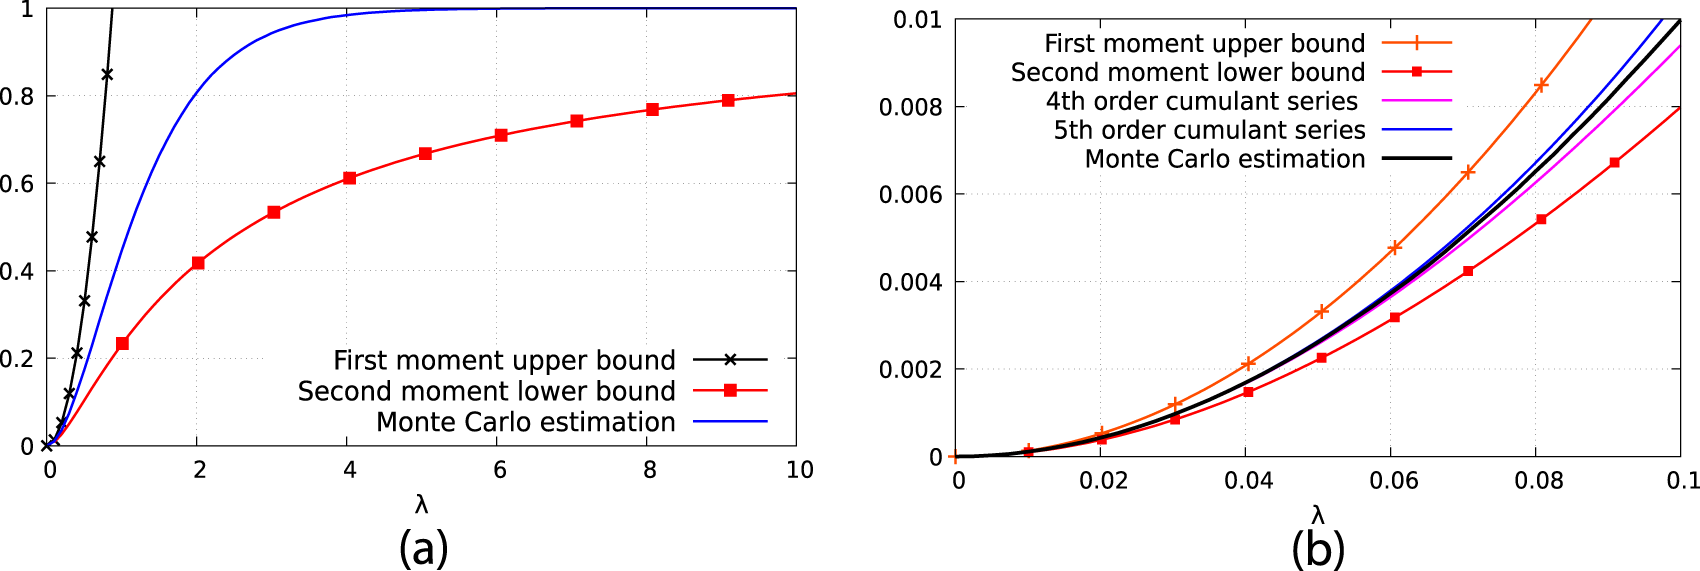
Figure 5 presents connectivity estimates based on the moment and cumulant formulas of Propositions 4.6 and B.2, in dimension d = 1.
Connection probabilities. (a) First and second moment bounds (4.4). (b) Cumulant approximations (B.1) with n = 0.
5.2. Four-hop paths with two endpoints
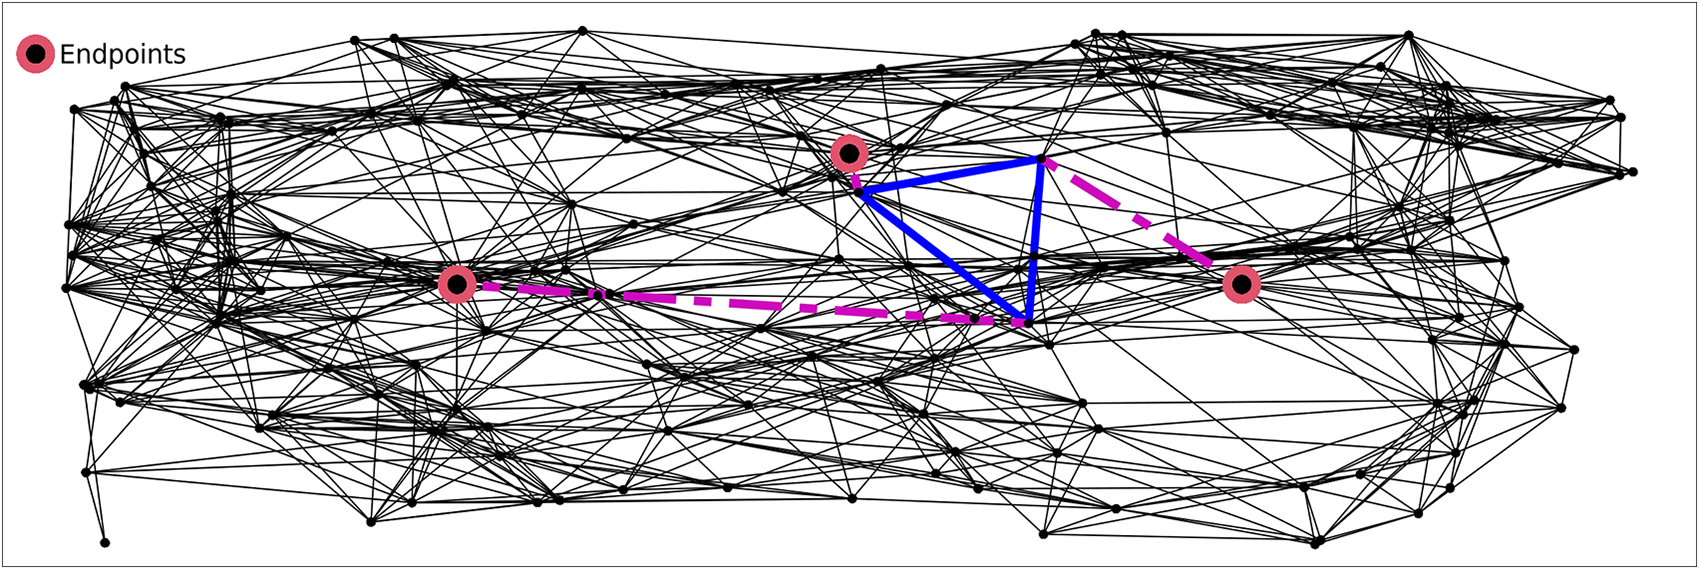
Here, we take m = 2 and r = 3, and in Table 4 we compute the first cumulant of  $N^G_{y_1,y_2}$ when G is a four-hop path with two endpoints in dimension d = 1, see Figure 6 for an illustration in dimension d = 2.
A four-hop path with two endpoints in dimension d = 2.
First and second cumulants of the count of four-hop paths with two endpoints.
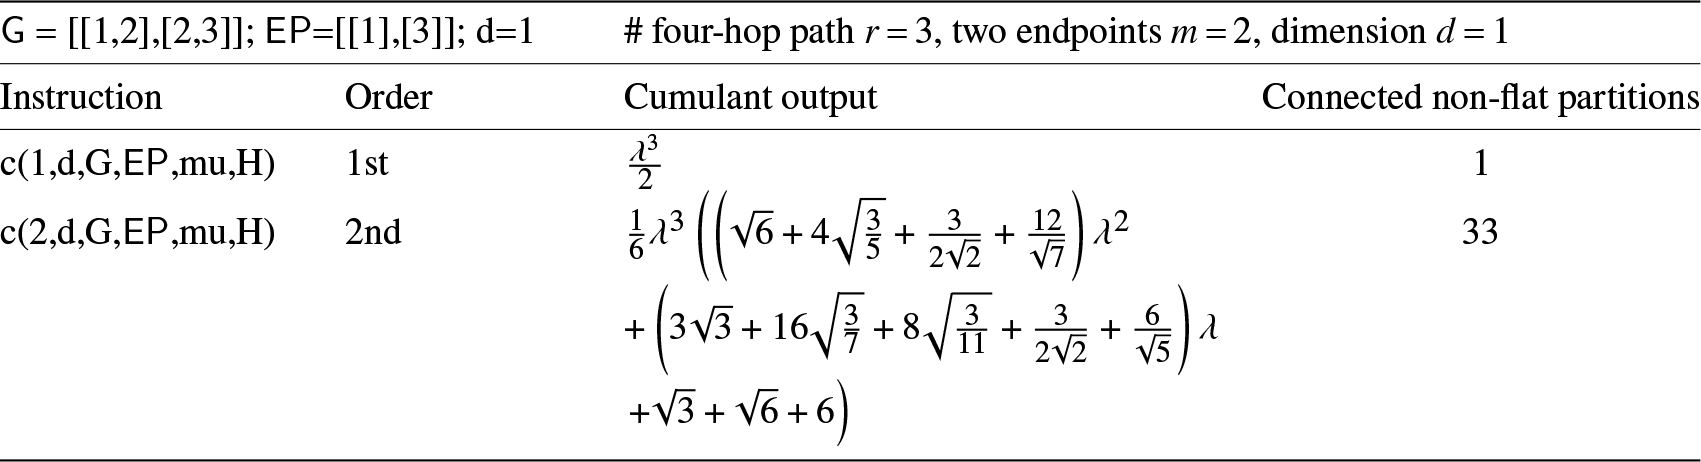
The closed-form expressions in Table 4 are expressed with  $y_1=y_2=0$ and $\beta := \pi$, in dimension d = 1.
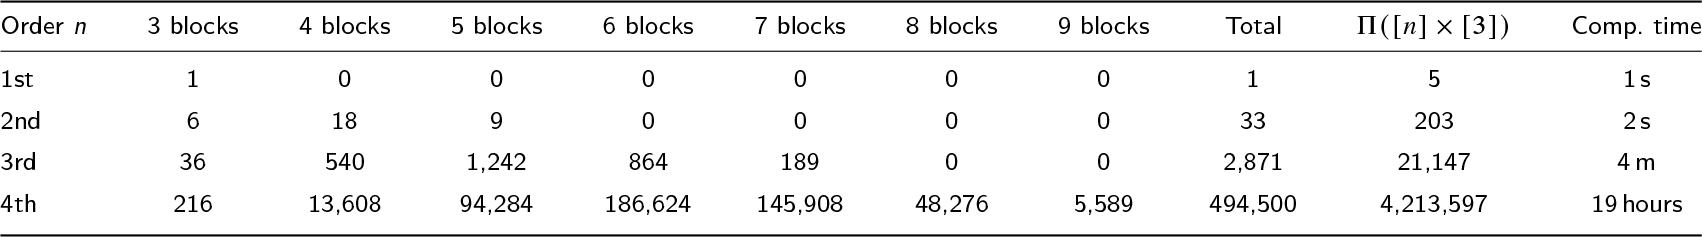
Table 5 presents the counts of connected non-flat partitions at different orders, and shows that such partitions represent only a fraction (around 10%) of total partition counts.
Computation times and counts of connected non-flat vs. all partitions in  $\Pi ([n]\times[3])$.
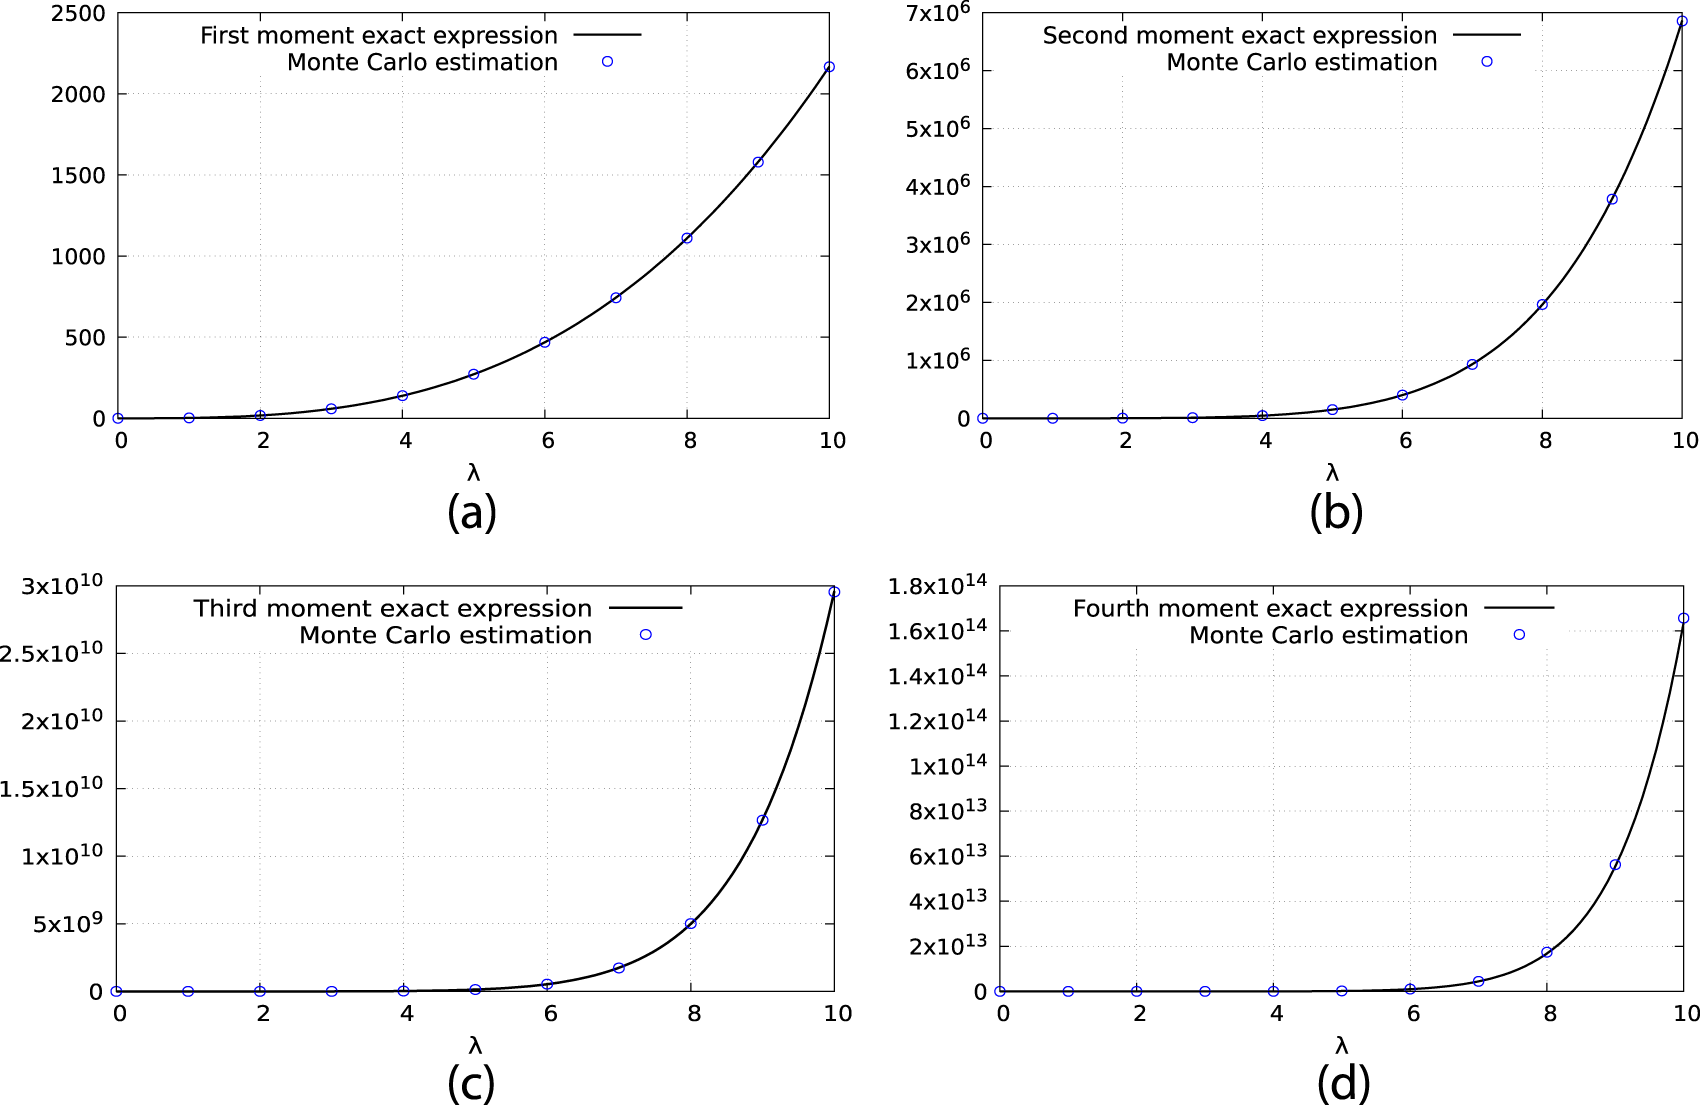
In Figure 7, we plot the corresponding moment expressions vs. their Monte Carlo estimates in dimension d = 1, with the parameters of Table 4.
Moment estimates. (a) First moment. (b) Second moment. (c) Third moment. (d) Fourth moment.
5.3. Triangles with endpoints
Taking r = 3 and m = 3, in Table 6, we compute the first and second cumulants of  $N^G_{y_1,y_1,y_3}$ when G is a triangle with three endpoints in dimension d = 1, see Figure 8 for an illustration in dimension d = 2.
A triangle with three endpoints in dimension d = 2.
First and second cumulants of the count of triangles with three endpoints.
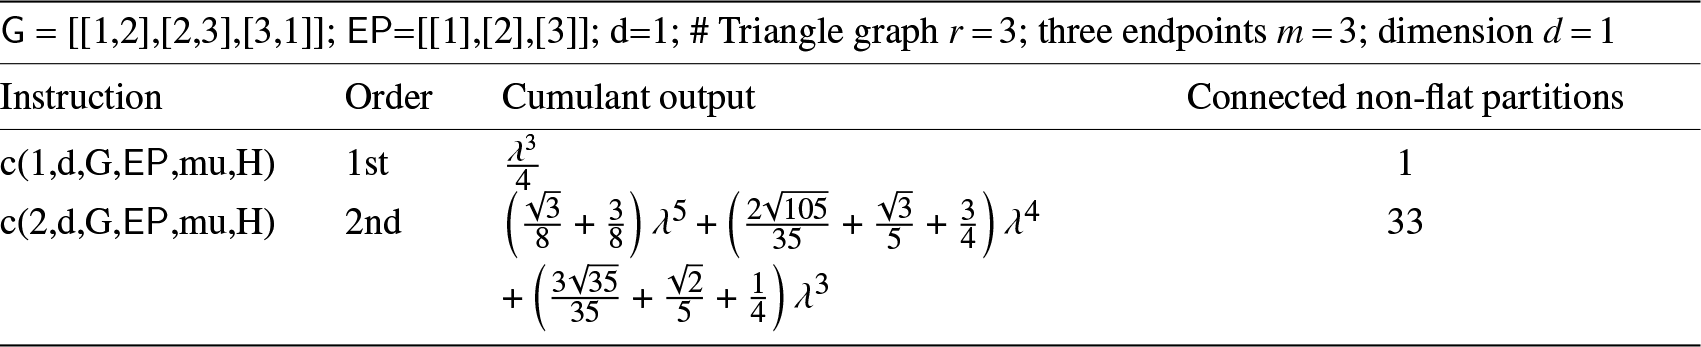
The closed-form expressions in Table 6 are expressed with  $y_1=y_2=y_3=0$ and $\beta := \pi$, in dimension d = 1.
Table 7 presents computation times in dimension d = 2.
Computation times and counts of connected non-flat vs. all partitions in  $\Pi ([n]\times[3])$.
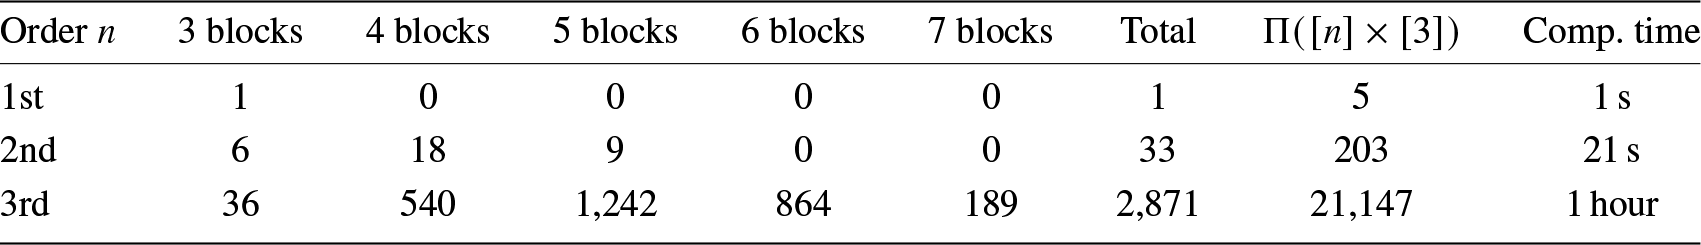
Figure 9 presents second and third order Gram–Charlier expansions (C.1)–(C.2) for the probability density function of the count  $N^G_{y_1,y_1,y_3}$ of triangles with three endpoints, based on exact second and third cumulant expressions.
Gram–Charlier density expansions vs. Monte Carlo density estimation. (a)  $\lambda = 50$. (b) $\lambda = 400$.
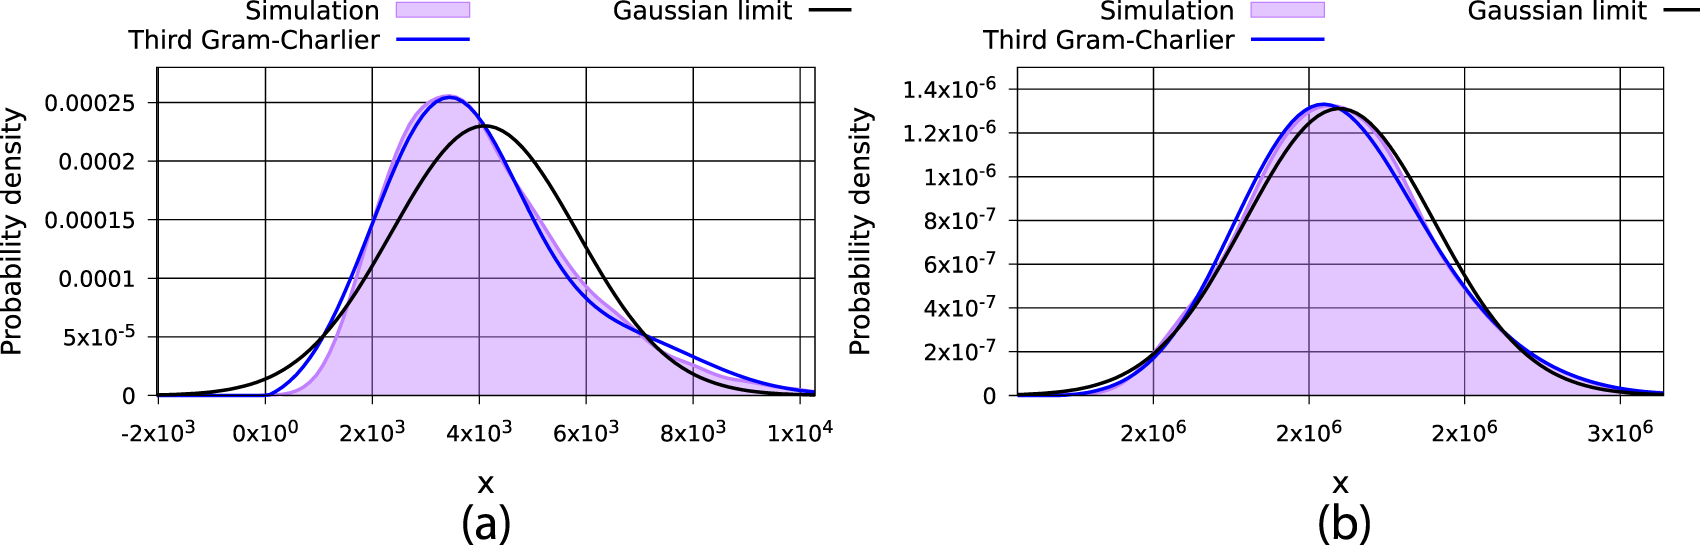
In Figure 9, the purple areas correspond to probability density estimates obtained by Monte Carlo simulations with β = 2. The second order expansions correspond to the Gaussian diffusion approximation obtained by matching first and second order moments. Figure 9 shows that the actual probability density estimates obtained by simulation can be significantly different from their Gaussian diffusion approximations when skewness takes large absolute values. In addition, in Figure 9, the fourth order Gram–Charlier expansions appear to give the best fit to the actual probability densities, which have positive skewness.
5.4. Trees with one endpoint
Here we take r = 4 and m = 1, and in Table 8 we compute the first and second cumulants of  $N^G_{y_1,y_1,y_3}$ when G is made of a tree and a single endpoint in dimension d = 2, see Figure 10 for an illustration.
Four trees with a single endpoint in dimension d = 2.
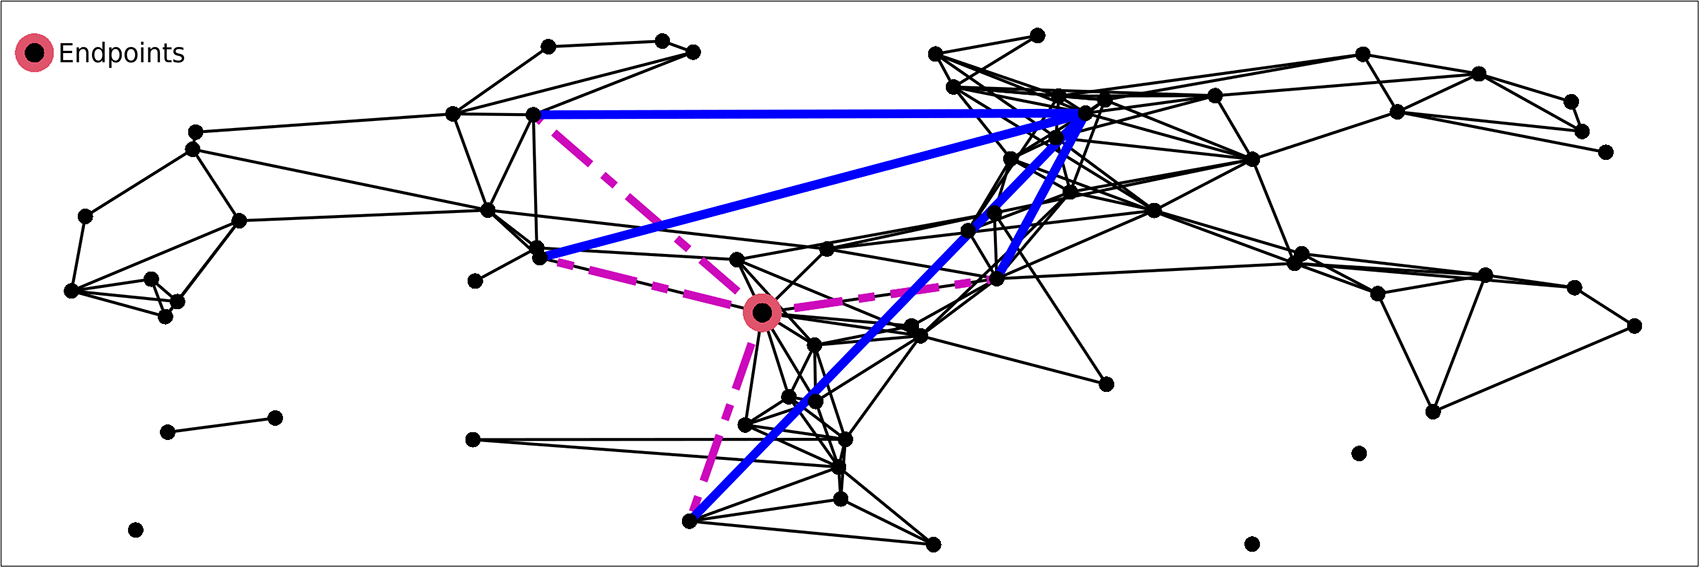
In Table 8, the location of the unique endpoint has no impact on cumulant expressions due to space homogeneity of the underlying Poisson point process.
First and second cumulants of the count of trees with one endpoint.
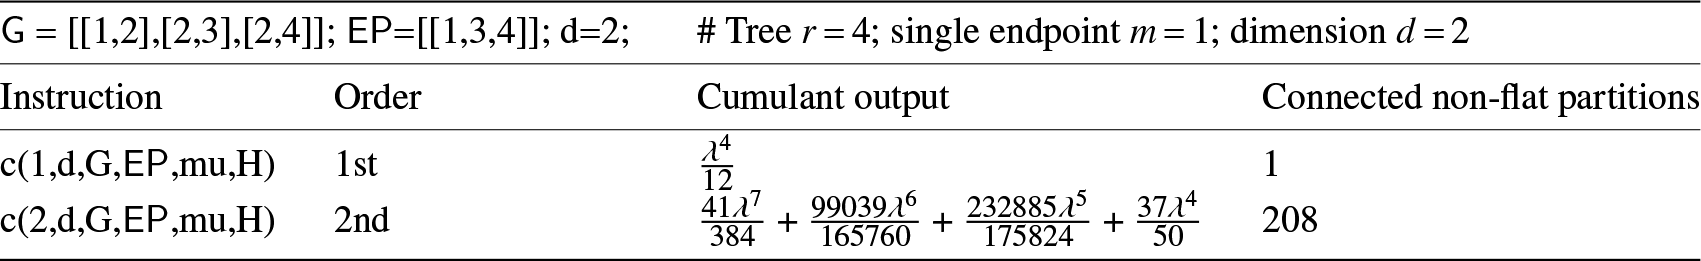
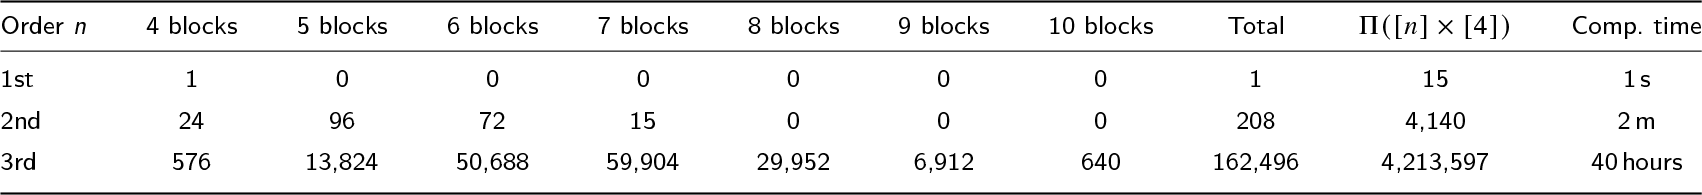
The computation times presented in Table 9 are for dimension d = 2.
Computation times and counts of connected non-flat vs. all partitions in  $\Pi ([n]\times[4])$.
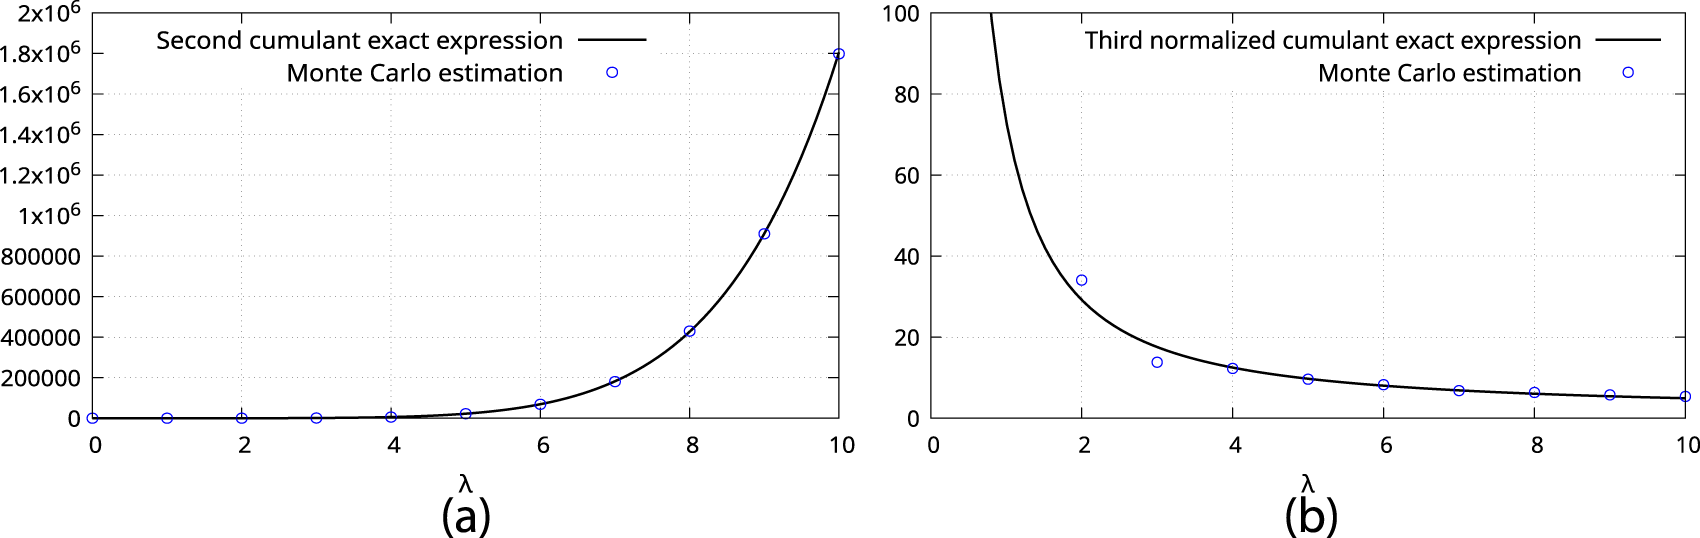
In Figure 11, we plot the second cumulant of  ${N}_{y_1,\ldots , y_m}^G$ and the third cumulant of $\widetilde{N}_{y_1,\ldots , y_m}^G$ vs. their Monte Carlo estimates in dimension d = 2 with $y_1 = y_2 = y_3 = 0$.
Cumulant estimates. (a) Second cumulant. (b) Normalized third cumulant.
5.5. Correlation of triangles vs. four-hop counts
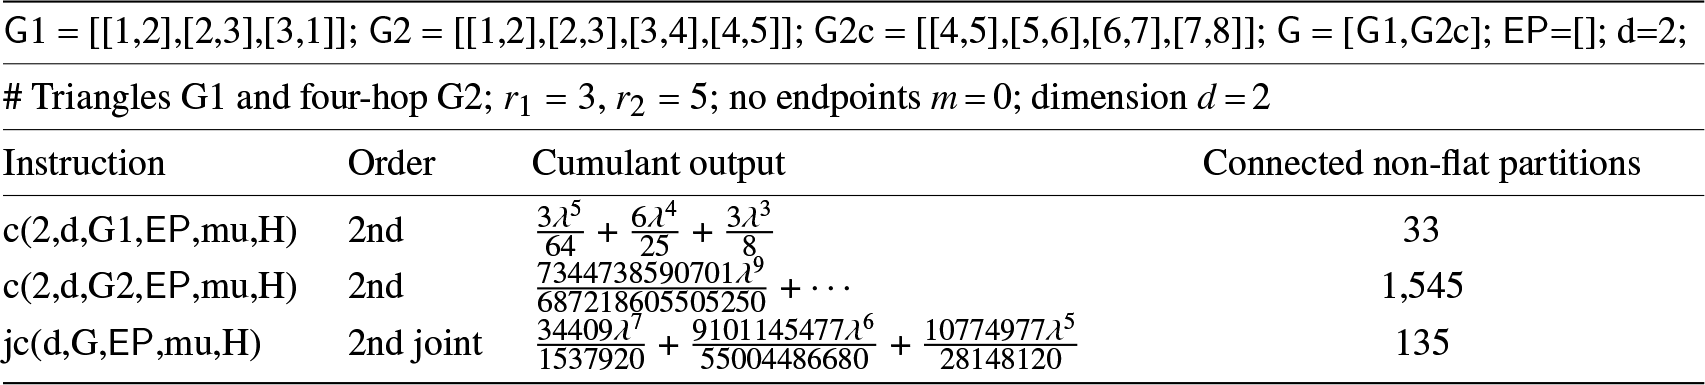
In this example, we run the joint cumulant code provided in Appendix E to compute the correlation of triangle and four-hop counts without endpoints, as a function of the intensity parameter λ. Here, µ is taken to be a finite measure as no endpoints are considered, that is we have  $\mathsf{EP}$=[ ] and m = 0, and the SageMath code listed in Appendix E is run after loading the definitions of Table 10.
Functions definitions.
The closed-form expressions in Table 11 are expressed with  $\beta := \pi$, in dimension d = 2.
Second (joint) moments of triangle counts vs. four-hop counts.
In Figure 12, we plot the second joint cumulant and correlation of  $\big({N}^{G_1},{N}^{G_2}\big)$ vs. their Monte Carlo estimates in dimension d = 1.
Correlation and second joint cumulant estimates. (a) Second joint cumulant. (b) Correlation.
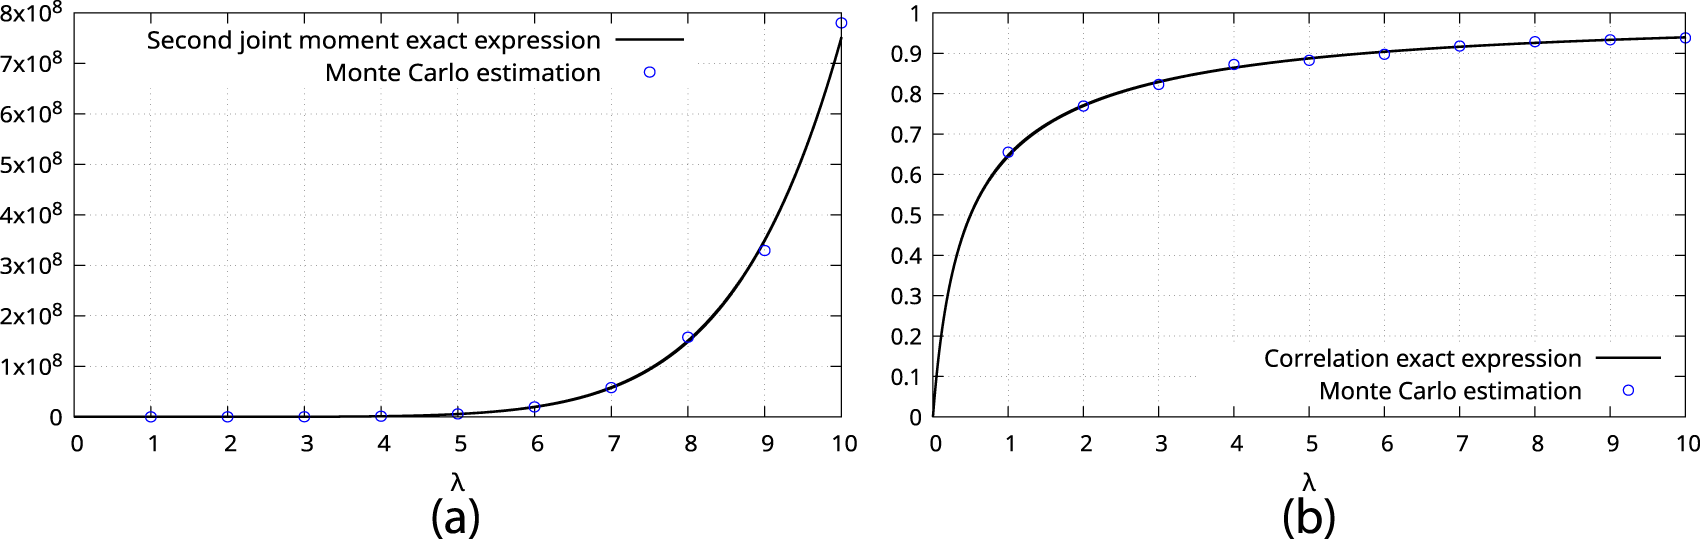
The limit correlation as λ tends to infinity can be exactly estimated from Table 11 as
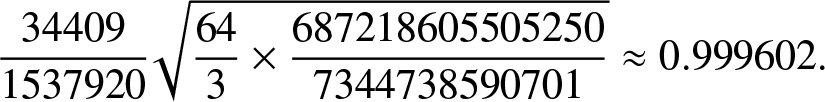 \begin{align*}
\frac{34409 }{1537920} \sqrt{\frac{64}{3} \times
\frac{687218605505250}{7344738590701}} \approx 0.999602.
\end{align*}
\begin{align*}
\frac{34409 }{1537920} \sqrt{\frac{64}{3} \times
\frac{687218605505250}{7344738590701}} \approx 0.999602.
\end{align*}Acknowledgments
This research is supported by the Ministry of Education, Singapore, under its Tier 2 Grant MOE-T2EP20120-0005. We thank Xueying Yang for essential contributions to the SageMath cumulant codes.
Competing interests
The authors have no competing interests to declare that are relevant to the content of this article.
Supplementary material
To view supplementary material for this article, please visit http://dx.doi.org/10.1017/S0269964824000160.
Appendix A. Multivariate moment and cumulant formulae
In this section, we prove an extension of Proposition 3.4 for the joint moments and cumulants of subgraph counts. The next definition extends Definition 3.1.
Definition A.1. Given  $r_1,\dots,r_n {\geq} 1$, we set
 \begin{align*}
\pi_i=\left\{(i,1), \ldots ,(i,r_i)\right\},
\quad
i=1, \ldots , n,
\end{align*}
\begin{align*}
\pi_i=\left\{(i,1), \ldots ,(i,r_i)\right\},
\quad
i=1, \ldots , n,
\end{align*} and  $\pi := \{\pi_1,\ldots , \pi_n \}$.
(i) A set partition
$\sigma\in\Pi( \pi_1 \cup \cdots \cup \pi_n )$ is connected if $\sigma\vee\pi=\widehat{1}$.(ii) A set partition
$\sigma\in\Pi ( \pi_1 \cup \cdots \cup \pi_n )$ is non-flat if $\sigma\wedge\pi=\widehat{0}$.


We let  $\Pi_{\widehat{1}}( \pi_1 \cup \cdots \cup \pi_n )$ denote the collection of all connected partitions of $\pi_1 \cup \cdots \cup \pi_n$.
In what follows, every partition  $\rho \in \Pi(\pi_1\cup \cdots \cup \pi_n )$ will be arranged into a diagram denoted by $\Gamma(\rho ,\pi)$, by arranging $\pi_1,\dots,\pi_n$ into n rows and connecting together the elements of every block of ρ, see Figure A1 for two illustrations with n = 5, $(r_1, r_2 , r_3 , r_4 , r_5) = (3,2,4,3,4)$.
Two examples of partition diagrams. (a) Non-connected partition diagram  ${\Gamma}(\rho, \pi)$. (b) Connected partition diagram ${\Gamma}(\rho, \pi)$.
Definition A.2 extends [Reference Liu and Privault16, Def. 2.4] to the multivariate setting.
(i) Given
$\rho\in\Pi(\pi_1\cup \cdots \cup \pi_n )$, we let σρ be the partition of $[n]$ defined by the condition
\begin{align*}
\rho\vee\pi=\bigg\{\bigcup_{i\in b}\pi_i:b\in\sigma_\rho \bigg\}.
\end{align*}(ii) For any non-empty set
$b \subset [n]$, we let
\begin{align*}
\rho_b:=\bigg\{c\in\rho:c\subset \bigcup_{i\in b}\pi_i\bigg\}.
\end{align*}


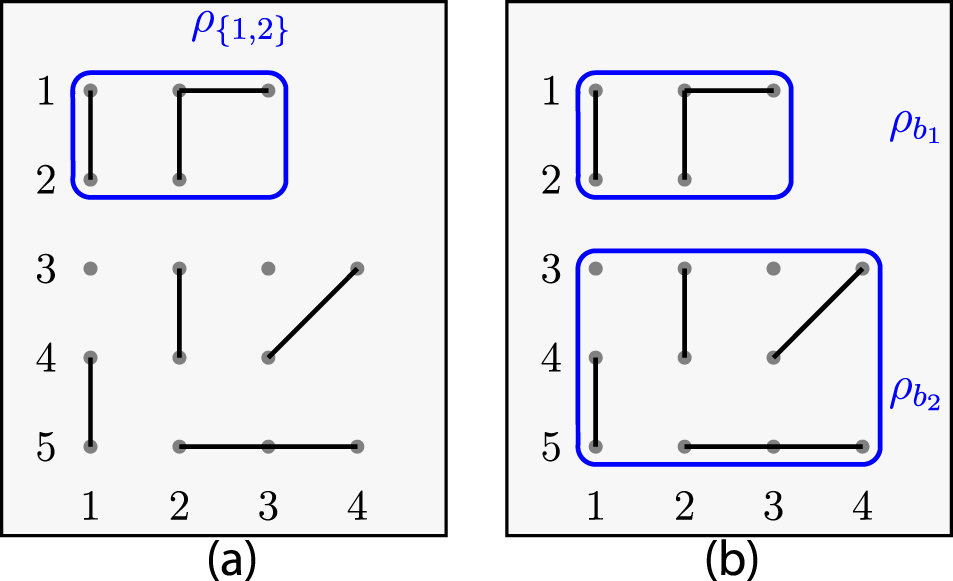
As an example, in Figure A2(a), when  $b = \{1,2\}$ we have
 \begin{align*}
\rho_{\{1,2\}} = \big\{\{(1,1),(2,1)\}, \{(1,2),(1,3),(2,2)\}\big\}.
\end{align*}
\begin{align*}
\rho_{\{1,2\}} = \big\{\{(1,1),(2,1)\}, \{(1,2),(1,3),(2,2)\}\big\}.
\end{align*}Diagram  $\Gamma(\rho,\pi)$ and splitting of the partition ρ with $\rho\vee\pi=\{\pi_1\cup\pi_2,\pi_3\cup\pi_4\cup\pi_5\}$. (a) Connected subpartition ${\rho_{\{1,2\}}}$. (b) Splitting $\rho$ into connected subpartitions $\rho_{b1}, \rho_{b2}$.
We note that for  $b\subset [n]$ we have $\pi_b=\{\pi_i:i\in b\}$, and any partition $\rho \in \Pi ( \pi_1\cup \cdots \cup \pi_n )$ can be split into subpartitions deduced from the connected components of $\Gamma(\rho,\pi)$, that is
 \begin{equation*}
\rho=\bigcup_{b\in\sigma_\rho}\rho_b,
\end{equation*}
\begin{equation*}
\rho=\bigcup_{b\in\sigma_\rho}\rho_b,
\end{equation*} as illustrated in Figure A2(b) with  $b_1 = \{1,2\}$, $b_2 = \{3,4,5\}$, and $\sigma_\rho = \{b_1,b_2\}$.
Definition A.3. For  $\sigma\in\Pi([n])$ we let $\Pi_{\sigma}(\pi_1\cup \cdots \cup \pi_n )$ denote the collection of partitions $\rho\in\Pi(\pi_1\cup \cdots \cup \pi_n)$ such that
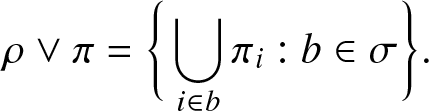 \begin{align*}\rho\vee\pi=\bigg\{\bigcup_{i\in b}\pi_i:b\in\sigma\bigg\}.
\end{align*}
\begin{align*}\rho\vee\pi=\bigg\{\bigcup_{i\in b}\pi_i:b\in\sigma\bigg\}.
\end{align*}In particular,  $\Pi_{\widehat{1}}(\pi_1\cup \cdots \cup \pi_n )$ represents the set of connected partitions of $\pi_1\cup \cdots \cup \pi_n $, and $\Pi_{\widehat{0}}(\pi_1\cup \cdots \cup \pi_n )$ represents the partitions of $\pi_1\cup \cdots \cup \pi_n$ that are finer than $\pi := \{\pi_1,\ldots , \pi_n \}$.
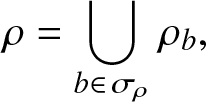
Given  $F:\Pi'(\pi_1\cup \cdots \cup \pi_n )\to\mathbb{R}$, where $\Pi'(\pi_1\cup \cdots \cup \pi_n )$ is the collection of all subpartitions of $\pi_1\cup \cdots \cup \pi_n $, we define the mixed moments $\widehat{F}:2^{[n]}\to\mathbb{R}$ by
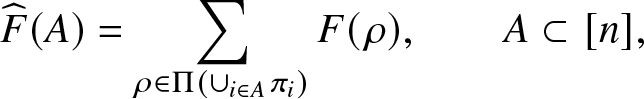 \begin{equation}
\widehat{F}(A)=\sum_{\rho\in\Pi(\cup_{i\in A}\pi_i)}F(\rho),
\qquad
A\subset [n],
\end{equation}
\begin{equation}
\widehat{F}(A)=\sum_{\rho\in\Pi(\cup_{i\in A}\pi_i)}F(\rho),
\qquad
A\subset [n],
\end{equation} cf. [Reference Malyshev and Minlos18, p. 33]. The semi-invariants  $C_F:2^{[n]}\to\mathbb{R}$ are defined by the induction formula $C_F(A)=\widehat{F}(A)$ when $|A|=1$, and
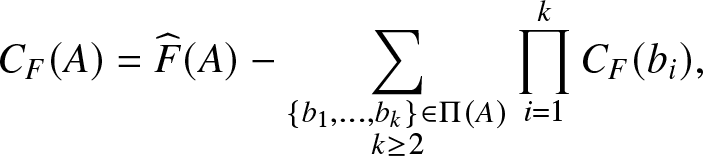 \begin{equation*}
C_F(A)=\widehat{F}(A)-\sum_{\substack{\{b_1,\dots,b_k\}\in\Pi(A)\\ k\ge2}}\prod_{i=1}^kC_F(b_i),
\end{equation*}
\begin{equation*}
C_F(A)=\widehat{F}(A)-\sum_{\substack{\{b_1,\dots,b_k\}\in\Pi(A)\\ k\ge2}}\prod_{i=1}^kC_F(b_i),
\end{equation*} for  $|A| \gt 1$, see Relation (16) page 33 of [Reference Malyshev and Minlos18], where the sum is taken over all partitions $\sigma\in\Pi(A)$ such that $|\sigma|\ge2$, that is
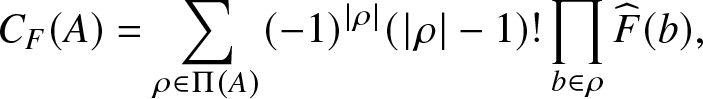 \begin{equation}
C_F(A)=\sum_{\rho\in\Pi(A)}
(-1)^{|\rho|} (|\rho|-1)!
\prod_{b\in\rho} \widehat{F}( b),
\end{equation}
\begin{equation}
C_F(A)=\sum_{\rho\in\Pi(A)}
(-1)^{|\rho|} (|\rho|-1)!
\prod_{b\in\rho} \widehat{F}( b),
\end{equation}see Relation (16’) in [Reference Malyshev and Minlos18]. The next proposition generalizes [Reference Liu and Privault16, Prop. 3.3] to the multivariate case.
Proposition A.4. Suppose that F satisfies the connectedness factorization property
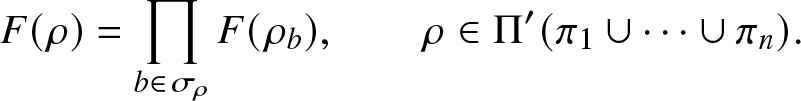 \begin{equation}
F(\rho)=\prod_{b\in\sigma_\rho}F(\rho_b),
\qquad
\rho\in\Pi'(\pi_1\cup \cdots \cup \pi_n ).
\end{equation}
\begin{equation}
F(\rho)=\prod_{b\in\sigma_\rho}F(\rho_b),
\qquad
\rho\in\Pi'(\pi_1\cup \cdots \cup \pi_n ).
\end{equation}Then, the semi-invariants are given by
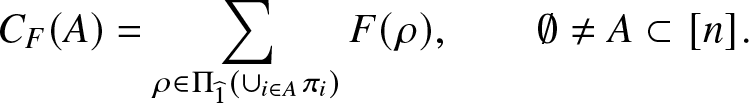 \begin{equation}
C_F(A)=\sum_{\rho\in\Pi_{\widehat{1}}(\cup_{i\in A}\pi_i)}F(\rho),
\qquad
\emptyset \not= A\subset [n].
\end{equation}
\begin{equation}
C_F(A)=\sum_{\rho\in\Pi_{\widehat{1}}(\cup_{i\in A}\pi_i)}F(\rho),
\qquad
\emptyset \not= A\subset [n].
\end{equation}(i) It is clear that (A.4) holds when
$|A|=1$. When $|A|=2$, taking $A=\{i,j\} \subset [n]$, $i\not= j$, we have
\begin{eqnarray*}
C_F(A)&=&\widehat{F}(\{i,j\})-C_F(\{i\})C_F(\{j\})\\
&=&\sum_{\rho\in\Pi(\pi_i \cup\pi_j )}F(\rho)-\widehat{F}(\{i\})\widehat{F}(\{j\})\\
&=&\sum_{\rho\in\Pi_{\widehat{1}}(\pi_i \cup\pi_j )}F(\rho)+\sum_{\rho\in\Pi_{\widehat{0}}(\pi_i \cup\pi_j )}F(\rho)-\left(
\sum_{\rho_1\in\Pi(\pi_i)}F(\rho_1)\right)
\left(
\sum_{\rho_2\in\Pi(\pi_j)}F(\rho_2)\right).
\end{eqnarray*}By splitting any
$\rho\in\Pi_{\widehat{0}}(\pi_i\cup\pi_j)$ into two disjoint subpartitions according to Definition A.2, that is
\begin{align*}\rho=\rho_{\{i\}}\cup\rho_{\{j\}},
\end{align*}together with the factorization property (A.3), we find
\begin{eqnarray*}
\sum_{\rho\in\Pi_{\widehat{0}}(\pi_i \cup\pi_j)}F(\rho)&=&\sum_{\substack{\rho\in\Pi_{\widehat{0}}(\pi_i\cup\pi_j)\\
\rho=\rho_{\{i\}}\cup\rho_{\{j\}}}}F(\rho_{\{i\}})F(\rho_{\{j\}})\\
&=&\left(
\sum_{\rho_1\in\Pi(\pi_i)}F(\rho_1)\right)
\left(
\sum_{\rho_2\in\Pi(\pi_j)}F(\rho_2)\right),
\end{eqnarray*}which shows (A.4).
(ii) Next, suppose that (A.4) holds for any
$A\subset [n]$ with $|A|\leq l \leq n-1$. Let $A\subset [n]$ be a subset of $[n]$ with $|A|=l +1$. We have
\begin{eqnarray*}
\widehat{F}(A)&=& \sum_{\substack{\rho\in\Pi(\cup_{i\in A}\pi_i) } }F(\rho) \\
&=&
\sum_{\substack{\sigma=\{b_1,\dots,b_k\}\in\Pi(A)\\ k{\geq} 1}}\sum_{\substack{\rho\in\Pi(\cup_{i\in A}\pi_i)\\ \rho\vee\pi_A=\{\cup_{i\in b_j}\pi_i\}_{j=1}^k}}F(\rho)\\
&=&
\sum_{\substack{\sigma=\{b_1,\dots,b_k\}\in\Pi(A)\\ k{\geq} 1}}\sum_{\substack{\rho\in\Pi(\cup_{i\in A}\pi_i)\\ \rho\vee\pi_A=\{\cup_{i\in b_j}\pi_i\}_{j=1}^k}}\prod_{j=1}^kF(\rho_{b_j})\\
&=&
\sum_{\substack{\sigma=\{b_1,\dots,b_k\}\in\Pi(A)\\ k{\geq} 1}}\prod_{j=1}^k \sum_{\substack{\rho_j\in\Pi(\cup_{i\in b_j}\pi_i)\\ \rho_j\vee\pi_{b_j}=\widehat{1}}}F(\rho_{b_i}) \\
&=&
\sum_{\substack{\sigma=\{b_1,\dots,b_k\}\in\Pi(A)\\ k{\geq} 1}}\prod_{j=1}^k \sum_{\rho_j\in\Pi_{\widehat{1}}(\cup_{i\in b_j}\pi_i)}F(\rho_{b_i}) \\
&=& \sum_{\rho\in\Pi_{\widehat{1}}(\cup_{i\in A}\pi_i)}F(\rho) + \sum_{\substack{\{b_1,\dots,b_k\}\in\Pi(A)\\ k{\geq} 2}}\prod_{j=1}^kC_F(b_j),
\end{eqnarray*}where the last equality follows from the induction hypothesis (A.4) when
$|A|\leq l $. The proof is completed by subtracting the last term from both sides.


Given  $n\ge1$ and $f^{(i)}:(\mathbb{R}^d)^{r_i}\to\mathbb{R}$, $i=1,\dots,n$, measurable functions, we let
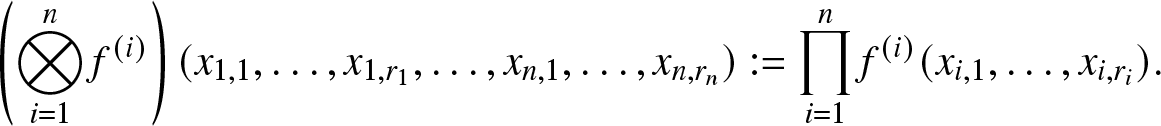 \begin{align*}
\left(\bigotimes_{i=1}^nf^{(i)} \right)(x_{1,1},\ldots,x_{1,r_1},\ldots,
x_{n,1},\ldots , x_{n,r_n}):=\prod_{i=1}^nf^{(i)} (x_{i,1},\dots,x_{i,r_i}).
\end{align*}
\begin{align*}
\left(\bigotimes_{i=1}^nf^{(i)} \right)(x_{1,1},\ldots,x_{1,r_1},\ldots,
x_{n,1},\ldots , x_{n,r_n}):=\prod_{i=1}^nf^{(i)} (x_{i,1},\dots,x_{i,r_i}).
\end{align*} For  $\rho\in \Pi(\pi_1\cup \cdots \cup \pi_n )$, we also denote by $\big( \bigotimes_{i=1}^nf^{(i)} \big)_{\hskip-0.01cm \rho}:(\mathbb{R}^d)^{|\rho|}\to\mathbb{R}$ the function obtained by equating any two variables whose indexes belong to a same block of ρ. We refer to [Reference Bogdan, Rosiński, Serafin and Wojciechowski1, Thm. 3.1] for the next result.
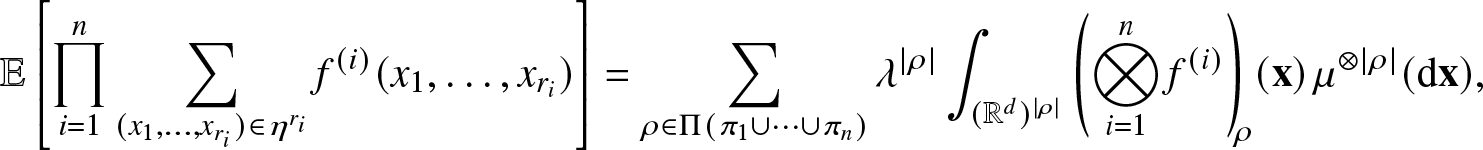
Proposition A.5. Let  $n\ge1$, $r_1,\ldots ,r_n\ge1$, and let $f^{(i)} :(\mathbb{R}^d)^{r_i}\to\mathbb{R}$ be a sufficiently integrable measurable function for $i=1,\dots,n$. We have
 \begin{equation*}
\mathbb{E}\left[\prod_{i=1}^n
\sum_{(x_1, \ldots ,x_{r_i})\in\eta^{r_i} }
f^{(i)} (x_1,\dots,x_{r_i})
\right]=\sum_{\rho\in\Pi(\pi_1\cup \cdots \cup \pi_n )}\lambda^{|\rho|}\int_{(\mathbb{R}^d)^{|\rho|}}\left(\bigotimes_{i=1}^n f^{(i)} \right)_{\hskip-0.1cm \rho} \! (\mathbf{x})
\ \! \mu^{\otimes |\rho|} ( \mathrm{d}\mathbf{x} ),
\end{equation*}
\begin{equation*}
\mathbb{E}\left[\prod_{i=1}^n
\sum_{(x_1, \ldots ,x_{r_i})\in\eta^{r_i} }
f^{(i)} (x_1,\dots,x_{r_i})
\right]=\sum_{\rho\in\Pi(\pi_1\cup \cdots \cup \pi_n )}\lambda^{|\rho|}\int_{(\mathbb{R}^d)^{|\rho|}}\left(\bigotimes_{i=1}^n f^{(i)} \right)_{\hskip-0.1cm \rho} \! (\mathbf{x})
\ \! \mu^{\otimes |\rho|} ( \mathrm{d}\mathbf{x} ),
\end{equation*}Proposition A.5 can be specialized as follows.
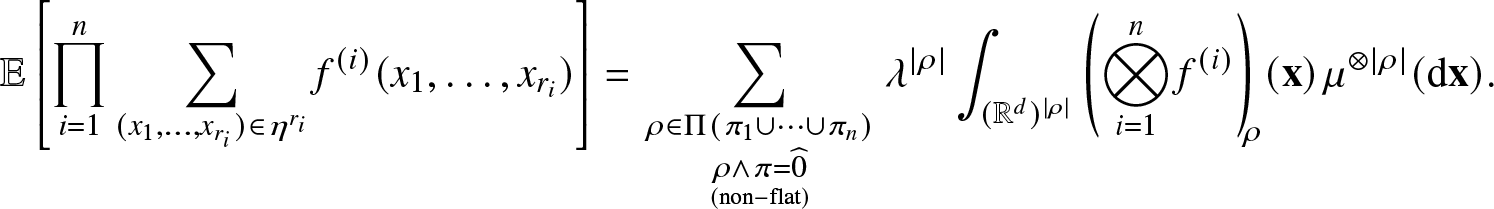
Corollary A.6. Let  $r_i\ge2$, $i=1,\dots,n$, and consider $f^{(i)}:(\mathbb{R}^d)^{r_i}\to\mathbb{R}$ measurable functions that vanish on diagonals, that is $f^{(i)} (x_1,\dots,x_{r_i})=0$ whenever $x_k=x_l$ for some $1\leq k\neq l\leq r_i$, $i=1,\ldots , n$. We have
 \begin{equation}
\mathbb{E}\left[\prod_{i=1}^n
\sum_{(x_1, \ldots ,x_{r_i})\in\eta^{r_i} }
f^{(i)} (x_1,\dots,x_{r_i})
\right]=
\sum_{\substack{\rho\in\Pi ( \pi_1 \cup \cdots \cup \pi_n )
\\\rho\wedge\pi=\widehat{0}} \atop {\mathrm{(non-flat)} \atop
}}
\lambda^{|\rho|}\int_{(\mathbb{R}^d)^{|\rho|}}\left(\bigotimes_{i=1}^n f^{(i)} \right)_{\hskip-0.1cm \rho} \! (\mathbf{x})
\ \! \mu^{\otimes |\rho|} ( \mathrm{d}\mathbf{x} ).
\end{equation}
\begin{equation}
\mathbb{E}\left[\prod_{i=1}^n
\sum_{(x_1, \ldots ,x_{r_i})\in\eta^{r_i} }
f^{(i)} (x_1,\dots,x_{r_i})
\right]=
\sum_{\substack{\rho\in\Pi ( \pi_1 \cup \cdots \cup \pi_n )
\\\rho\wedge\pi=\widehat{0}} \atop {\mathrm{(non-flat)} \atop
}}
\lambda^{|\rho|}\int_{(\mathbb{R}^d)^{|\rho|}}\left(\bigotimes_{i=1}^n f^{(i)} \right)_{\hskip-0.1cm \rho} \! (\mathbf{x})
\ \! \mu^{\otimes |\rho|} ( \mathrm{d}\mathbf{x} ).
\end{equation} For  $i=1,\dots,n$, let $M_i \subset \{1,\ldots , m\}$, $r_i{\geq} 2$, and let $G_i=(V_{G_i},E_{G_i})$ be a connected graph with edge set $E_{G_i}$ and vertex set of the form $V_{G_i}=\big(v^{(i)}_1, \ldots ,v^{(i)}_{r_i}; {\{w_j^{(i)}\}_{j\in M_i}}\big)$, such that
(i) the subgraph
$\mathsf{G}_i$ induced by Gi on $\{v^{(i)}_1, \ldots ,v^{(i)}_{r_i}\}$ is connected, and(ii) the endpoint vertices
$ \{w_j^{(i)}\}_{j\in M_i}$ are not adjacent to each other in Gi,


and let  $G:=\{G_1,\ldots , G_n\}$. In Definition A.7, for every $\rho\in\Pi(\pi_1\cup \cdots \cup \pi_n )$ we build a graph structure induced by $(G_1,\dots,G_n)$ on the diagram $\Gamma(\rho,\pi)$, analogous to [Reference Liu and Privault16, Def. 2.2].
Definition A.7. Given  $\rho \in\Pi(\pi_1\cup \cdots \cup \pi_n )$ a partition of $\pi_1\cup \cdots \cup \pi_n $, we let $\widetilde{\rho}_G$ denote the multigraph constructed as follows on $[m] \cup \pi_1 \cup \cdots \cup \pi_n$:
(i) for all
$j_1, j_2\in [r_i]$, $j_1\not= j_2$, and $i\in [n]$, an edge links $(i,j_1)$ to $(i,j_2)$ iff $\{v^{(i)}_{j_1},v^{(i)}_{j_2}\}\in E_{G_i}$.(ii) for all
$(j,k)\in [r_i]\times M_i$ and $i\in [n]$, an edge links (k) to (i, j) iff $\{v^{(i)}_j,w_k^{(i)}\}\in E_{G_i}$;(iii) for all
$i_1,i_2\in [n]$ and $(j_1,j_2) \in [r_{i_1}]\times [r_{i_2}]$, we merge any two nodes $(i_1,j_1)$ and $(i_2,j_2)$ if they belong to a same block in ρ.


In addition, we let ρG be the graph constructed from the multigraph  $\widetilde{\rho}_G$ by removing any redundant edge in $\widetilde{\rho}_G$.
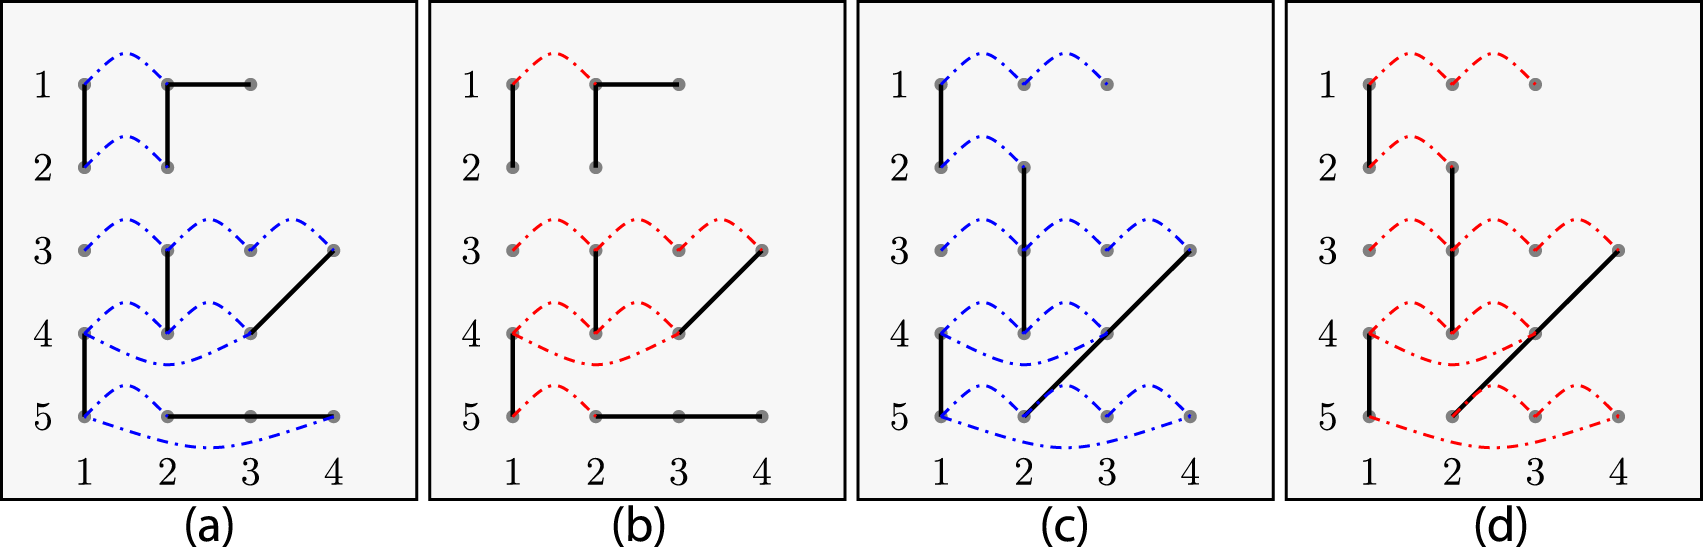
As in Section 3, the graph ρG forms a connected graph with  $|\rho | + m$ vertices. Figure A3 presents two examples of multigraphs $\widetilde{\rho}_G$ and graphs ρG when $G_1,G_2,G_3$ are line graphs, G 4 is a triangle, and G 5 is a rectangle on a partition diagram $\Gamma ( \rho , \pi )$ with no endpoints, that is $M_1=\cdots = M_n = \emptyset$ here.
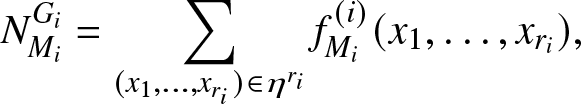
For each  $i=1,\ldots , n$ denote by $N_{M_i}^{G_i}$ the count of subgraphs in the random-connection model $G_H (\eta \cup \{y_j\}_{j\in M_i} )$ with endpoint set $\{y_j\}_{j\in M_i}$, that is
 \begin{equation*}
N_{M_i}^{G_i}
=\sum_{(x_1, \ldots ,x_{r_i})\in\eta^{r_i}} f^{(i)}_{M_i} (x_1, \ldots ,x_{r_i}),
\end{equation*}
\begin{equation*}
N_{M_i}^{G_i}
=\sum_{(x_1, \ldots ,x_{r_i})\in\eta^{r_i}} f^{(i)}_{M_i} (x_1, \ldots ,x_{r_i}),
\end{equation*}Diagram  $\Gamma ( \rho , \pi )$, multigraph $\widetilde{\rho}_G$, and graph ρG. (a) Multigraph $\widetilde{\rho}_G$ in blue. (b) Graph ${\rho}_G$ in red. (c) Multigraph $\widetilde{\rho}_G$ in blue. (d) Graph and ${\rho}_G$ in red.
where  $f^{(i)}_{M_i} :({\mathord{\mathbb R}}^d)^{r_i} \to \{0,1\}$ is the random function defined as
 \begin{equation*}
f^{(i)}_{M_i} (x_1, \ldots ,x_{r_i}):=
\prod_{\substack{
1 \leq l \leq r_i, \ j \in M_i
\\ \{w_j^{(i)} , v^{(i)}_l\}\in E_{G_i} }
}
\textbf{1}_{\{y_j\leftrightarrow x_l \}}
\prod_{\substack{1 \leq k,l \leq r_i
\\ \{v^{(i)}_k,v^{(i)}_l\}\in E_{G_i}}}\textbf{1}_{\{x_k \leftrightarrow x_l \}},
\qquad
x_1,\ldots , x_{r_i} \in \mathbb{R}^d.
\end{equation*}
\begin{equation*}
f^{(i)}_{M_i} (x_1, \ldots ,x_{r_i}):=
\prod_{\substack{
1 \leq l \leq r_i, \ j \in M_i
\\ \{w_j^{(i)} , v^{(i)}_l\}\in E_{G_i} }
}
\textbf{1}_{\{y_j\leftrightarrow x_l \}}
\prod_{\substack{1 \leq k,l \leq r_i
\\ \{v^{(i)}_k,v^{(i)}_l\}\in E_{G_i}}}\textbf{1}_{\{x_k \leftrightarrow x_l \}},
\qquad
x_1,\ldots , x_{r_i} \in \mathbb{R}^d.
\end{equation*} For  $\rho = \{b_1,\ldots , b_{|\rho |}\} \in
\Pi (\pi_1 \cup \cdots \cup \pi_n )$, we also let
$\rho = \{b_1,\ldots , b_{|\rho |}\} \in
\Pi (\pi_1 \cup \cdots \cup \pi_n )$, we also let
 \begin{equation*}
{\cal A}^\rho_j:=\{i \in [ |\rho | ] \ : \ \exists (s,k)\in b_i \mathrm{s.t.}
\big(v^{(s)}_k,w_j^{(s)}\big) \in E_{G_s}
\}
\end{equation*}
\begin{equation*}
{\cal A}^\rho_j:=\{i \in [ |\rho | ] \ : \ \exists (s,k)\in b_i \mathrm{s.t.}
\big(v^{(s)}_k,w_j^{(s)}\big) \in E_{G_s}
\}
\end{equation*} denote the neighborhood of the vertex  $(|\rho | + j)$ in ρG, $j=1,\ldots , m$. The next proposition is a consequence of Relation (A.4) and Corollary A.6.
Proposition A.8. Let  $N_{M_i}^{G_i}$ be subgraph counts in the random-connection model $G_H (\eta\cup\{y_1,\dots,y_m\})$ as defined above, for $i=1,\dots,n$. We have
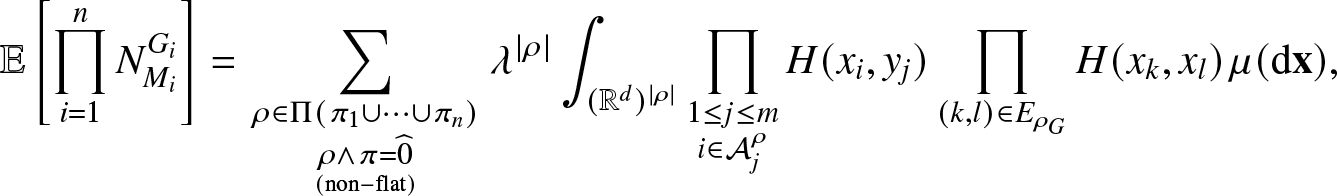 \begin{equation}
\mathbb{E}\left[\prod_{i=1}^n N^{G_i}_{M_i}\right]=\sum_{
\substack{
\rho\in\Pi(\pi_1 \cup \cdots \cup \pi_n )
\\\rho\wedge\pi=\widehat{0}} \atop {\mathrm{(non-flat)}}}
\lambda^{|\rho|}\int_{(\mathbb{R}^d)^{|\rho|}}\prod_{\substack{
1 \leq j \leq m
\\ i\in {\cal A}^\rho_j}}
H(x_i,y_j)\prod_{(k,l)\in E_{\rho_G} }H(x_k,x_l) \ \! \mu(\mathrm{d}\mathbf{x}),
\end{equation}
\begin{equation}
\mathbb{E}\left[\prod_{i=1}^n N^{G_i}_{M_i}\right]=\sum_{
\substack{
\rho\in\Pi(\pi_1 \cup \cdots \cup \pi_n )
\\\rho\wedge\pi=\widehat{0}} \atop {\mathrm{(non-flat)}}}
\lambda^{|\rho|}\int_{(\mathbb{R}^d)^{|\rho|}}\prod_{\substack{
1 \leq j \leq m
\\ i\in {\cal A}^\rho_j}}
H(x_i,y_j)\prod_{(k,l)\in E_{\rho_G} }H(x_k,x_l) \ \! \mu(\mathrm{d}\mathbf{x}),
\end{equation}and joint cumulant
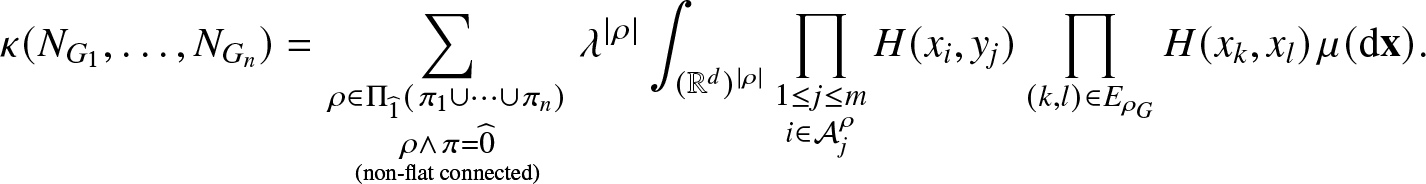 \begin{equation}
\kappa(N_{G_1},\dots,N_{G_n})=\sum_{
\substack{\rho\in\Pi_{\widehat{1}}(\pi_1 \cup \cdots \cup \pi_n )
\\\rho\wedge\pi=\widehat{0}} \atop {\textrm{(non-flat connected)}}}
\lambda^{|\rho|}\int_{(\mathbb{R}^d)^{|\rho|}}
\prod_{\substack{
1 \leq j \leq m
\\ i\in {\cal A}^\rho_j}}
H(x_i,y_j)\prod_{(k,l)\in E_{\rho_G} }H(x_k,x_l) \ \! \mu(\mathrm{d}\mathbf{x}).
\end{equation}
\begin{equation}
\kappa(N_{G_1},\dots,N_{G_n})=\sum_{
\substack{\rho\in\Pi_{\widehat{1}}(\pi_1 \cup \cdots \cup \pi_n )
\\\rho\wedge\pi=\widehat{0}} \atop {\textrm{(non-flat connected)}}}
\lambda^{|\rho|}\int_{(\mathbb{R}^d)^{|\rho|}}
\prod_{\substack{
1 \leq j \leq m
\\ i\in {\cal A}^\rho_j}}
H(x_i,y_j)\prod_{(k,l)\in E_{\rho_G} }H(x_k,x_l) \ \! \mu(\mathrm{d}\mathbf{x}).
\end{equation}Proof. The moment identity (A.6) is obtained by taking expectation on both sides of (A.5) in Corollary A.6 and using the relation  $H(x,y) = \mathbb{E} [
\textbf{1}_{\{x \leftrightarrow y\}}]$,
$H(x,y) = \mathbb{E} [
\textbf{1}_{\{x \leftrightarrow y\}}]$,  $x, y \in {\mathord{\mathbb R}}^d$. Next, we note that the connectedness factorization property (A.3) is satisfied by
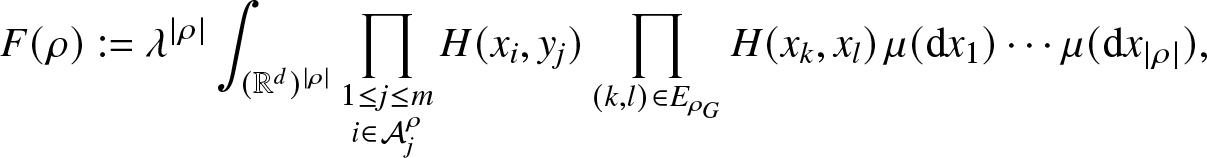 \begin{align*}F(\rho ):=\lambda^{|\rho |}\int_{(\mathbb{R}^d)^{|\rho |}}
\prod_{\substack{
1 \leq j \leq m
\\ i\in {\cal A}^\rho_j}}
H(x_i,y_j)
\prod_{(k,l)\in E_{\rho_G} }H(x_k,x_l) \ \! \mu(\mathrm{d}x_1)\cdots\mu(\mathrm{d}x_{|\rho |}),
\end{align*}
\begin{align*}F(\rho ):=\lambda^{|\rho |}\int_{(\mathbb{R}^d)^{|\rho |}}
\prod_{\substack{
1 \leq j \leq m
\\ i\in {\cal A}^\rho_j}}
H(x_i,y_j)
\prod_{(k,l)\in E_{\rho_G} }H(x_k,x_l) \ \! \mu(\mathrm{d}x_1)\cdots\mu(\mathrm{d}x_{|\rho |}),
\end{align*}  $\rho \in\Pi(\pi_1\cup \cdots \cup \pi_n )$, hence (A.7) follows from Relations (A.1), (A.4), (A.6), and the classical cumulant-moment relationship (A.2), see, for example, Relation (3.3) in [Reference Lukacs17].
The cumulant formula of Proposition A.8 is implemented in the code listed in Appendix E.
Appendix B. Cumulant and factorial moment estimates
The following result can be found in [Reference Saulis and Statulevičius26, Cor. 2.1] or [Reference Döring, Jansen and Schubert6, Thm. 2.4].
Lemma B.1. Let  $\{X_\lambda\}$ be a family of random variables with moments of all orders, mean zero and unit variance for all λ > 0. Suppose that for all $j{\geq} 3$ and sufficiently large λ, the cumulant of order j of Xλ is bounded by
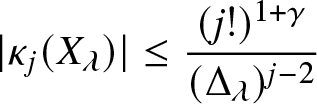 \begin{equation*}
|\kappa_j(X_\lambda)|\leq \frac{(j!)^{1+\gamma}}{(\Delta_\lambda)^{j-2}}
\end{equation*}
\begin{equation*}
|\kappa_j(X_\lambda)|\leq \frac{(j!)^{1+\gamma}}{(\Delta_\lambda)^{j-2}}
\end{equation*} where  $\gamma\ge0$ is a constant independent of λ. Then we have the Berry–Esseen bound
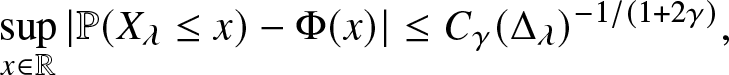 \begin{equation*}
\sup_{x\in\mathbb{R}}|\mathbb{P} (X_\lambda\leq x)-\Phi(x)|\leq C_\gamma (\Delta_\lambda)^{-1/(1+2\gamma)},
\end{equation*}
\begin{equation*}
\sup_{x\in\mathbb{R}}|\mathbb{P} (X_\lambda\leq x)-\Phi(x)|\leq C_\gamma (\Delta_\lambda)^{-1/(1+2\gamma)},
\end{equation*} for  $C_\gamma \gt 0$ a constant depending only on γ.
We let  $m_n(X) := \mathbb{E} [ X(X-1) \cdots (X-n+1)]$ denote the factorial moments of order $n {\geq} 1$ of a discrete random variable X.
Proposition B.2. Corollary 1.13 in [Reference Bollobás2]
Assume that
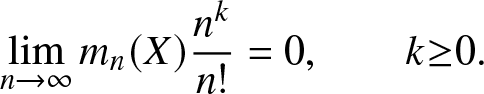 \begin{align*}
\lim_{n\to \infty} m_n(X)\frac{n^k}{n!} =0,
\qquad
k {\geq} 0.
\end{align*}
\begin{align*}
\lim_{n\to \infty} m_n(X)\frac{n^k}{n!} =0,
\qquad
k {\geq} 0.
\end{align*} Then for any  $n{\geq} 0$, we have
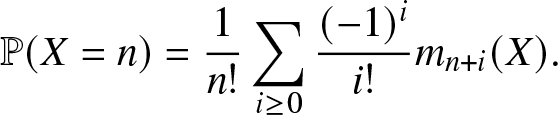 \begin{equation}
\mathbb{P} ( X = n ) =
\frac{1}{n!}
\sum_{i{\geq} 0} \frac{(-1)^i}{i!}
m_{n + i}(X).
\end{equation}
\begin{equation}
\mathbb{P} ( X = n ) =
\frac{1}{n!}
\sum_{i{\geq} 0} \frac{(-1)^i}{i!}
m_{n + i}(X).
\end{equation}Appendix C. Gram–Charlier expansions
Let  $\varphi(x) := e^{-x^2/2} / \sqrt{2\pi}$, $x\in {\mathord{\mathbb R}}$, denote the standard normal probability density function. In addition to the second order expansion Gaussian approximation
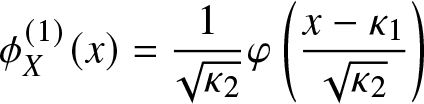 \begin{equation}
\phi_X^{(1)}(x)=
\frac{1}{\sqrt{\kappa_2}}
\varphi \left( \frac{x-\kappa_1}{\sqrt{\kappa_2}}\right)
\end{equation}
\begin{equation}
\phi_X^{(1)}(x)=
\frac{1}{\sqrt{\kappa_2}}
\varphi \left( \frac{x-\kappa_1}{\sqrt{\kappa_2}}\right)
\end{equation} for the probability density  $\phi_X(x)$ function of a random variable X, higher order Gram–Charlier expansions of third and fourth order are given by
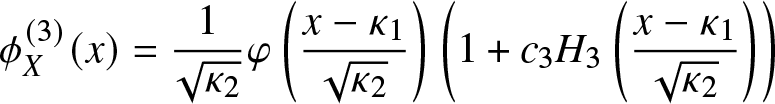 \begin{equation}
\phi_X^{(3)}(x)=
\frac{1}{\sqrt{\kappa_2}}
\varphi \left( \frac{x-\kappa_1}{\sqrt{\kappa_2}}\right)
\left( 1 +
c_3 H_3\left(
\frac{x-\kappa_1}{\sqrt{\kappa_2}} \right)
\right)
\end{equation}
\begin{equation}
\phi_X^{(3)}(x)=
\frac{1}{\sqrt{\kappa_2}}
\varphi \left( \frac{x-\kappa_1}{\sqrt{\kappa_2}}\right)
\left( 1 +
c_3 H_3\left(
\frac{x-\kappa_1}{\sqrt{\kappa_2}} \right)
\right)
\end{equation}and
 \begin{equation*}
\nonumber
\phi_X^{(4)}(x)=
\frac{1}{\sqrt{\kappa_2}}
\varphi \left( \frac{x-\kappa_1}{\sqrt{\kappa_2}}\right)
\left( 1 +
c_3 H_3\left(
\frac{x-\kappa_1}{\sqrt{\kappa_2}} \right)
+
c_4 H_4\left(
\frac{x-\kappa_1}{\sqrt{\kappa_2}} \right)
+ c_6 H_6\left( \frac{x-\kappa_1}{\sqrt{\kappa_2}} \right)
\right).
\end{equation*}
\begin{equation*}
\nonumber
\phi_X^{(4)}(x)=
\frac{1}{\sqrt{\kappa_2}}
\varphi \left( \frac{x-\kappa_1}{\sqrt{\kappa_2}}\right)
\left( 1 +
c_3 H_3\left(
\frac{x-\kappa_1}{\sqrt{\kappa_2}} \right)
+
c_4 H_4\left(
\frac{x-\kappa_1}{\sqrt{\kappa_2}} \right)
+ c_6 H_6\left( \frac{x-\kappa_1}{\sqrt{\kappa_2}} \right)
\right).
\end{equation*}see Section 17.6 of [Reference Cramér4], where
•
$H_0(x)=1$, $H_1(x)=x$, $H_3(x)=x^3-3x$, $H_4(x)=x^4-6x^2+3$, $H_6(x)=x^6-15x^4+45x^2-15$ are Hermite polynomials,• the sequence
$c_3,c_4,c_5,c_6$ is given from the cumulants $(\kappa_n)_{n{\geq} 1}$ of X as
\begin{align*}
c_3 = \frac{\kappa_3}{3! (\kappa_2)^{3/2}},
\quad
c_4 = \frac{\kappa_4}{4! (\kappa_2)^2},
\quad
c_5 = \frac{\kappa_5}{5! \kappa_5^{5/2}},
\quad
c_6 =
\frac{\kappa_6}{6! (\kappa_2)^3}
+
\frac{(\kappa_3)^2}{2(3!)^2 (\kappa_2)^3},
\end{align*}where c 3 and c 4 are expressed from the skewness
$\kappa_3/(\kappa_2)^{3/2}$ and the excess kurtosis $\kappa_4/(\kappa_2)^2$.


Appendix D. Cumulant code
The following code generates closed-form cumulant expressions via symbolic calculations in SageMath for any dimension  $d{\geq} 1$, any connected subgraph $\mathsf{G}$ induced by G, and any set of endpoint connections represented as the sequence $\mathsf{EP} = [\mathsf{EP}_1,\ldots , \mathsf{EP}_m]$. When G has no endpoint (m = 0) we have $\mathsf{EP} =[ \ ]$, however, in this case the measure µ should be finite, that is, the density function mu(x, $\lambda,\beta$) should be integrable with respect to the Lebesgue measure on ${\mathord{\mathbb R}}^d$. The choice of SageMath for this implementation is due to its fast handling of symbolic integration via Maxima, which is significantly faster than the Python package Sympy. This code is also sped up by parallel processing that can distribute the load among different CPU cores. This SageMath code and the next one are available for download at https://github.com/nprivaul/random-connection.
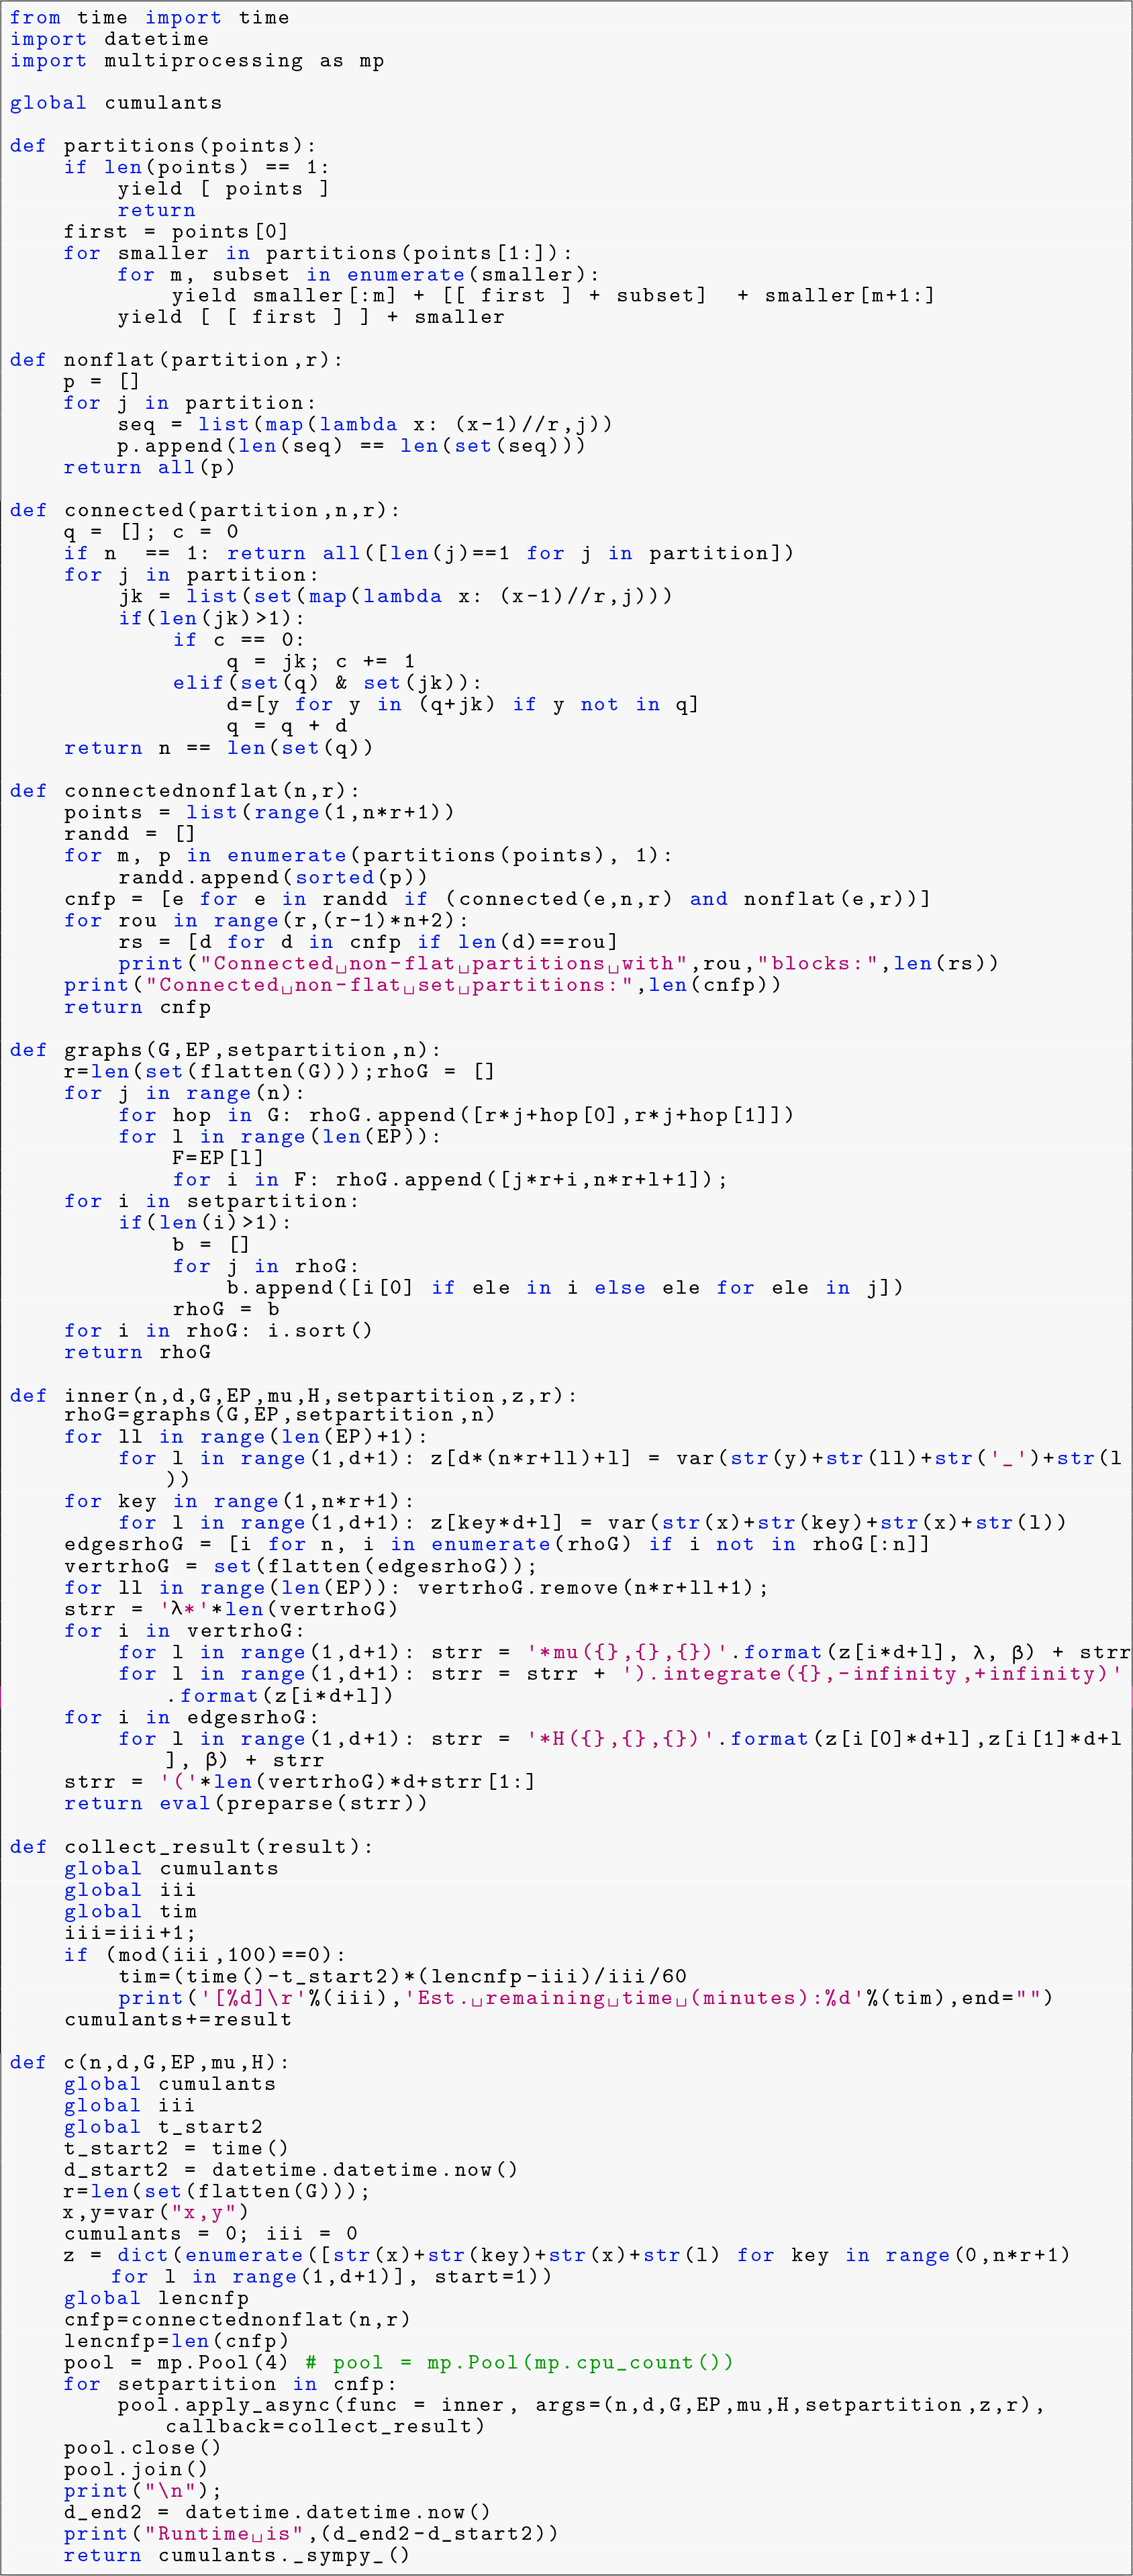
Appendix E. Joint cumulant code
The following code generates closed-form joint cumulant expressions via symbolic calculations in SageMath for any dimension  $d{\geq} 1$, any sequence $(\mathsf{G}_1,\ldots , \mathsf{G}_n)$ of connected subgraphs induced by $(G_1,\ldots ,G_n)$. As above, the endpoint connections are represented using represented as the sequence $\mathsf{EP} = [\mathsf{EP}_1,\ldots , \mathsf{EP}_m]$ where $\mathsf{EP}_i$ denotes the set of vertices of $\mathsf{G}_1\cup \cdots \cup \mathsf{G}_n$ which are attached to the ith endpoint, $i=1,\ldots , m$.
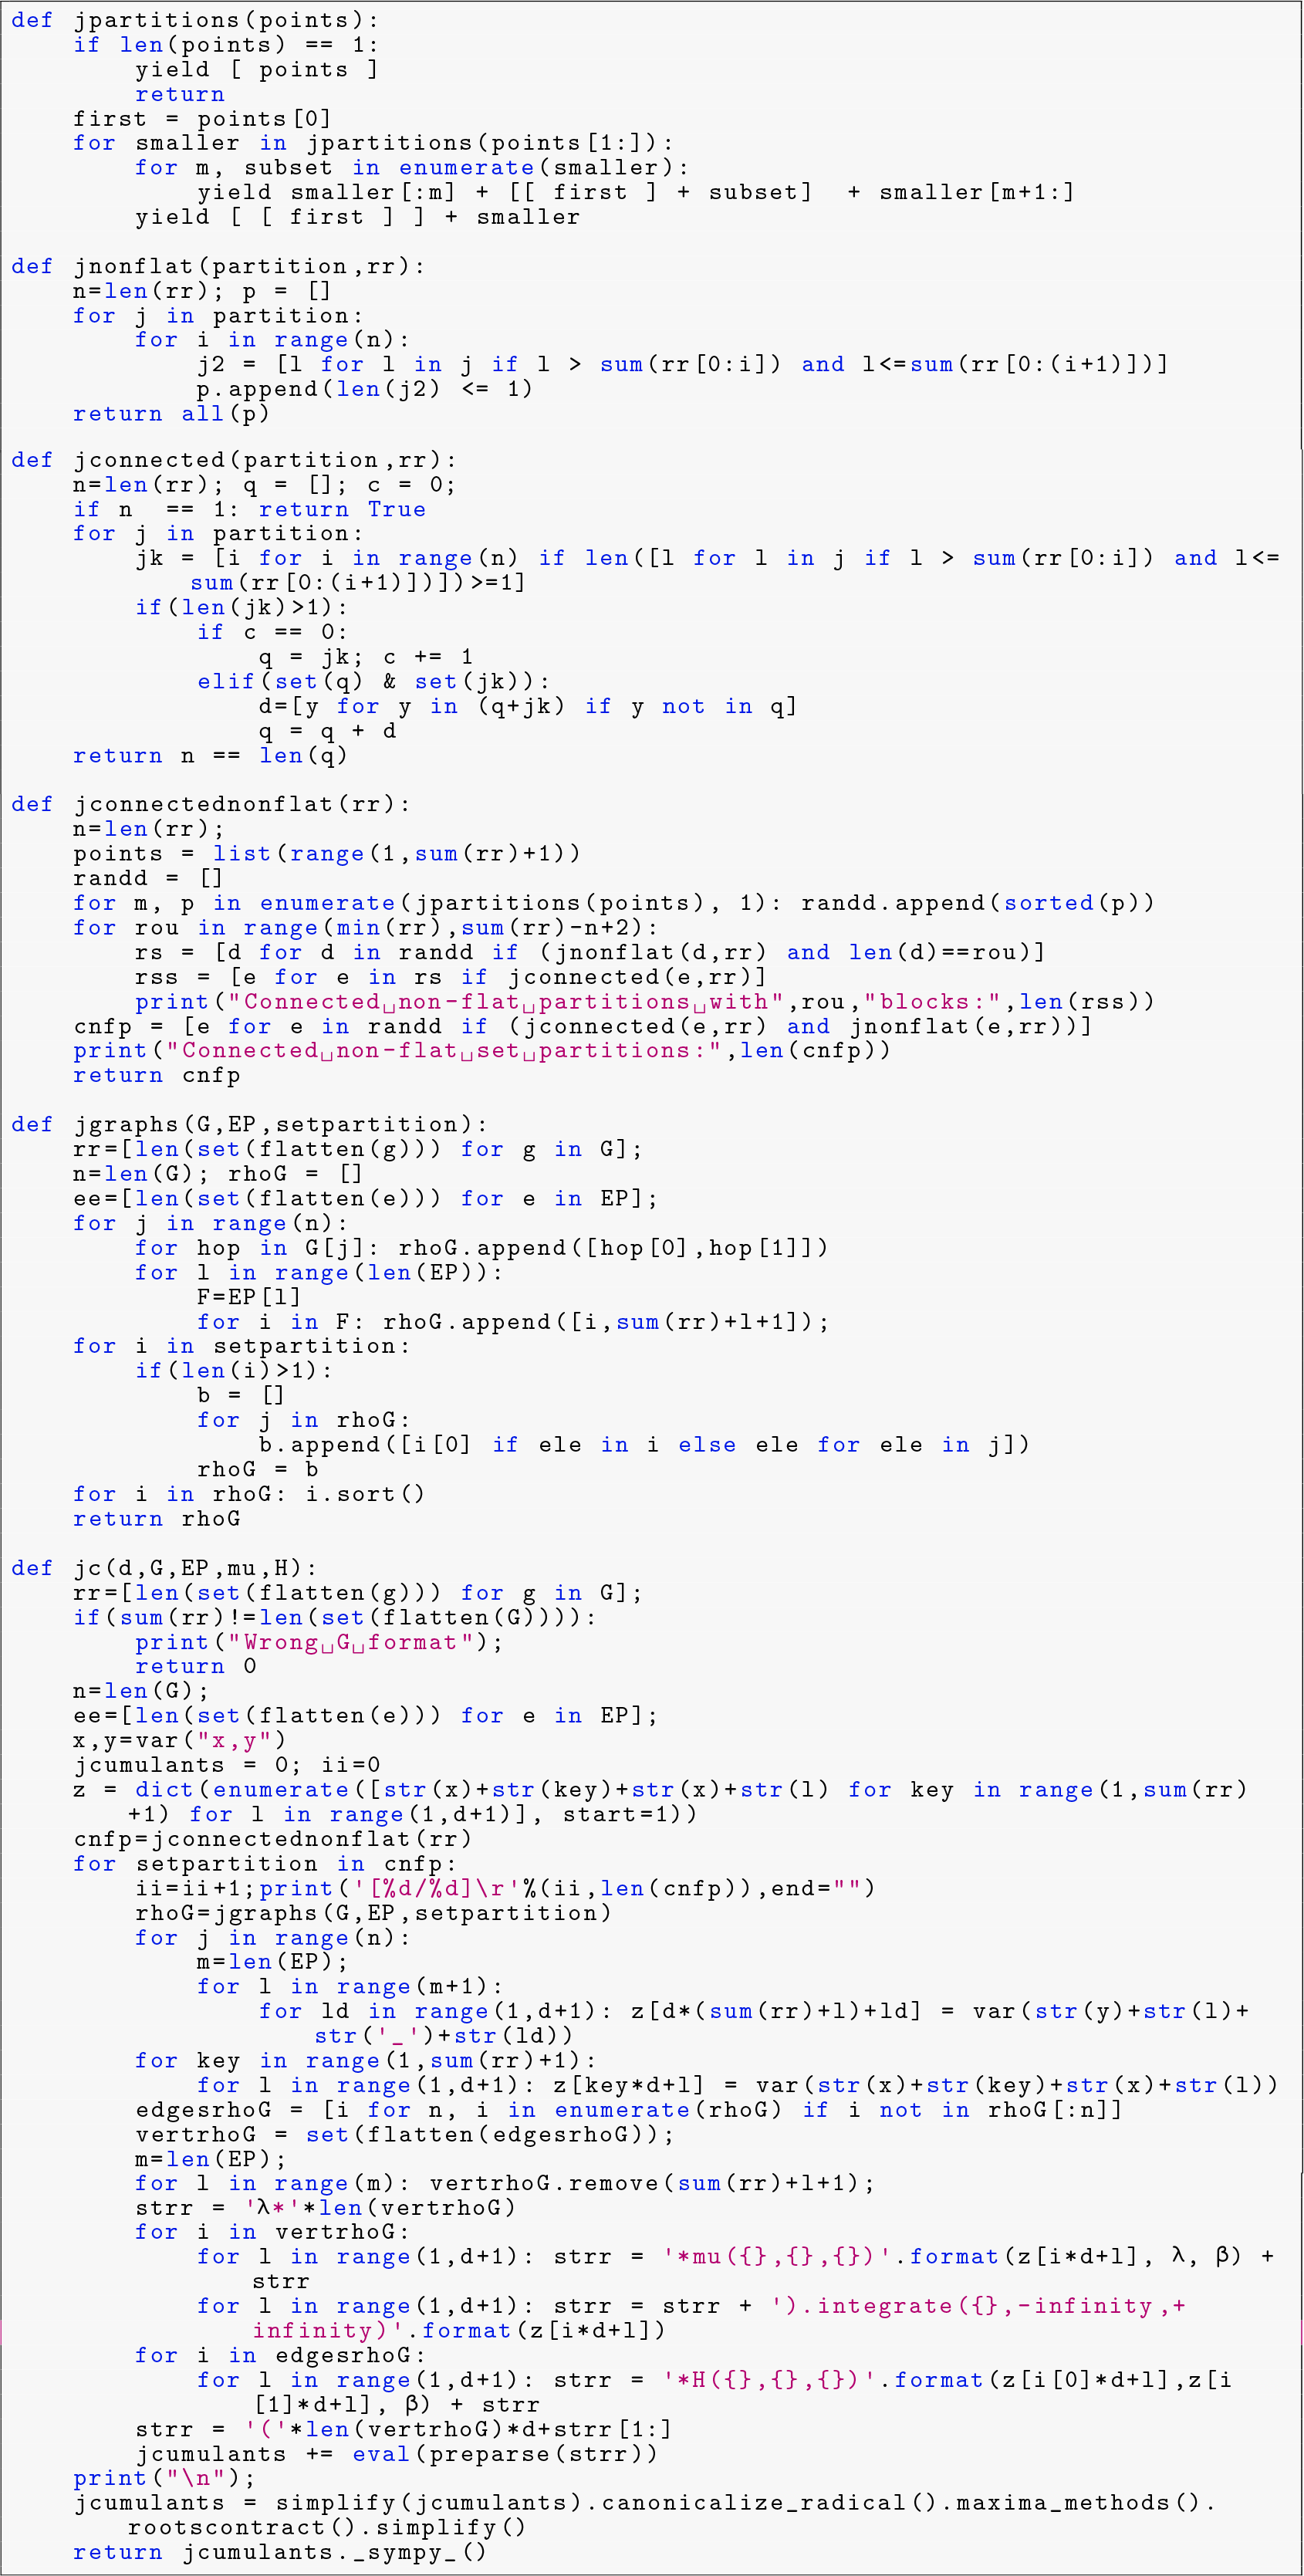


 Open access