

The recent increase in the prevalence of obesity is widely recognized as constituting a major threat to health in most countries as obesity has reached epidemic proportions globally, with 1·5 billion adults overweight in 2008 according to the WHO(1). Based on data from the National Health and Nutrition Examination Survey 2007–2008, the estimated prevalence of obesity (BMI ≥ 30 kg/m2) for adults aged 20 years or older in the USA was 33·8 %(Reference Flegal, Carroll and Ogden2), while for adult men (women) in the UK, obesity prevalence was 22·2 % (23·0 %) in 2003(Reference Berghofer, Pischon and Reinhold3). Kelly et al. reported a prevalence of 1·8 % (4·4 %) for men (women) in India and 16·0 % (20·0 %) for men (women) in Latin America and the Caribbean in 2005(Reference Kelly, Yang and Chen4). In Brazil in 2002–2003, the prevalence was 8·9 % for men and 13·1 % for women(5). Although developed countries present higher levels of obesity, developing countries also show increasing overweight prevalence, mainly as a consequence of the nutrition transition they are experiencing(Reference Popkin6). Brazil has continental dimensions and inequality is present all over the country. Trends show a shift in the prevalence from the higher to the lower socio-economic level in Brazil(Reference Monteiro, Conde and Popkin7) and this change has contributed to the coexistence of an overweight person with an underweight person in the same household, called the ‘dual burden’ of disease(Reference Doak, Adair and Bentley8–Reference Caballero10).
The number of studies on obesity has increased significantly in the last decade, mainly due to the high risk that this condition leads to patients with other chronic diseases, such as diabetes and hypertension(Reference Mokdad, Bowman and Ford11–Reference Peeters, Barendregt and Willekens13). Although several individual-level risk factors for obesity have been identified, population rates of obesity are determined by a complex interplay of biological, social, environmental, behavioural and cultural factors, which collectively have created over decades an adverse environment for maintaining a healthy weight. A comprehensive understanding of how these factors interact is currently lacking(Reference Koplan, Liverman and Kraak14, Reference Glass, Rasmussen and Schwartz15). Age, sex, socio-economic status, sedentary lifestyle and co-morbidities such as diabetes and hypertension have traditionally been studied as risk factors for overweight or obesity. However, investigations on the risk of obesity and its association with factors other than those already widely studied have been proposed. The condition of obesity is not a communicable disease, but studies on its spatial distribution are being developed by considering the food supply and environmental conditions in a particular area(Reference Mokdad, Bowman and Ford11, Reference Hill and Peters16–Reference Drewnowski, Rehm and Solet20). The inclusion of GIS (geographic information systems) methods for assessing the food environment is already in use(Reference Charreire, Casey and Salze21) and the study of factors influencing the difference in obesity prevalence by region raises hypotheses about the influence of the environment in this epidemic(Reference Drewnowski, Rehm and Solet20, Reference Ouedraogo, Fournet and Martin-Prevel22, Reference Schlundt, Hargreaves and McClellan23).
Although BMI is the most widely used anthropometric index and cut-off points to define excess of weight are already established, other indices like waist circumference and waist-to-hip ratio also have been found to be associated with all-cause mortality, diabetes mellitus, cardiovascular morbidity and mortality in prospective studies(Reference Can, Bersot and Gonen24). However, waist circumference alone is unsatisfactory in detecting people in need of weight management on the basis of either a high BMI and/or a high waist-to-hip ratio(Reference Molarius, Seidell and Sans25). A combination of indices indicating excess of weight and abdominal adiposity is then recommended for risk assessment for type 2 diabetes, hypertension and CVD(26–32).
Another aspect to be considered when studying metabolic complications is the polytomous characteristic of its risk, classified as no risk, increased, high or very high risk, according to a combination of BMI and abdominal circumference. The proper way to analyse an outcome with more than two categories is by use of a multinomial model that allows to one research, in a single analysis, the association for each class observed(Reference Ananth and Kleinbaum33). Although the estimates of relative risk for variables with more than two categories require a multinomial model, transforming data in several dichotomous variables is still commonly seen(Reference Hasselmann and Reichenheim34–Reference Zammiti, Mtiraoui and Kallel37). Besides, including spatial analysis in a multinomial model can provide valuable information about the risk of a specific condition. Therefore we aimed to identify spatial variation in the risk for metabolic complications by means of a semi-parametric approach for multinomial data, in order to reveal locations for public health interventions to prevent an epidemic condition.
Methods
We conducted a population-based cross-sectional study between November 2006 and December 2007 in one of five health districts of Campinas (São Paulo, Brazil) of area 128 km2 and estimated population 277 000 inhabitants. The sample was selected in two stages, households and individuals, according to records of the Health Unit of the district, and comprises the South district of the city. The study sample was composed of 651 (89 %) local residents of 730 visited households.
After informed consent from the selected individuals we applied a standardized questionnaire and anthropometric measures were obtained following the methods proposed by the Anthropometric Standardization Reference Manual (Reference Lohman, Roche and Martorell38). Weight was measured with a portable electronic balance with a capacity up to 150 kg, height was measured using a portable stadiometer and we used an inelastic tape with a capacity of 150 cm with 0·1 cm markings to measure body circumferences. Geographical coordinates of addresses of the participants were taken using a portable GPS (Global Positioning System), datum SAD-69 and projection UTM 23S, with an average accuracy of 7 m.
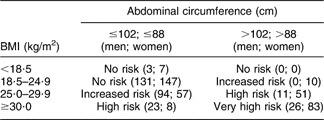
We used an association of abdominal circumference and BMI as a combined form of risk assessment for type 2 diabetes, hypertension and CVD. This combined risk, called ‘risk for metabolic complications’ (RMC) herein, was defined according to the National Institutes of Health(26, Reference Rexrode, Carey and Hennekens29–31) as shown in Table 1.
Number of men and women stratified for levels of risk for type 2 diabetes, hypertension and CVD according to the combined recommendations of BMI and abdominal circumference cut-off points(31), Campinas, São Paulo, Brazil, 2006–2007
Statistical analysis
We implemented a routine based on the spatial risk functions for epidemiological studies proposed by Bithell(Reference Bithell39) and the estimated spatial risk through Generalized Additive Models (GAM) proposed by Kelsall and Diggle(Reference Kelsall and Diggle40). Both studies worked from a dichotomous perspective, classifying individuals into two categories (ill and not ill). Our routine considers the multinomial response to estimate the spatial risk through a GAM, a model that enables the inclusion of non-spatial covariates that may be related to the outcome being studied, called a ‘semi-parametric model’. In the GAM, the non-parametric function was fitted by a bi-dimensional Nadaraya–Watson kernel.
The significance of spatial effects was obtained by a Monte Carlo method. Based on the probabilities estimated under a logistic model without the spatial component, a new response variable was built and, with it, the GAM was fitted to obtain the spatial risk estimated in a grid of points representing the study area. This was repeated 400 times and the results at each point were normally distributed. From this, the estimates based on the observed data were compared with these distributions and classified as significant if they were outside the region of tolerance (P < 0·025 or P > 0·975).
For the parametric part of the model, the odds ratio was obtained through a polytomous logistic model(Reference Ananth and Kleinbaum33), considered the most appropriate analysis as we had a multinomial response with a clearly defined reference category (no risk). Analyses were performed using the software R version 2·10 for Linux (R Project for Statistical Computing, Vienna, Austria).
Results
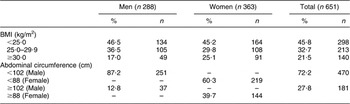
The sample was composed mostly of women (55·7 %), mean age was 41·6 (sd 12·5) years and more than half of the sample (52·5 %) had studied for >8 years. Obesity (BMI ≥ 30·0 kg/m2) was present in more than 20 % of the total sample (17·0 % of men and 25·1 % of women). Overweight (BMI = 25·0–29·9 kg/m2) was present in about a third of the total sample (29·8 % of women and 36·5 % of men). Abdominal circumference values above the upper limit (102 cm for men and 88 cm for women) were found in 12·8 % of men and 39·7 % of women (Table 2).
Distribution of BMI and abdominal circumference among adult men and women, Campinas, São Paulo, 2006–2007
A third of men presented an increased RMC (33·0 %), while almost a quarter of women (22·9 %) had very high RMC. Older people presented very high RMC (21·4 % of those aged >55 years), although increased RMC was seen for 25 % of individuals in all age categories. RMC was more frequent among those with lower levels of education (63·9 % for 0–4 years of study) than among the higher educated (51·2 % for >8 years of study), as shown in Table 3.
Prevalence of risk for metabolic complications (RMC) according to characteristics of the sample, Campinas, São Paulo, 2006–2007
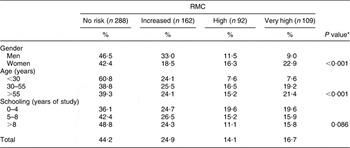
*P values for Pearson's χ 2 association test of significance.
In the multinomial semi-parametric model analysis with variables age, schooling and the geographical coordinates, age was significant for all levels of RMC. For those aged >30 years the odds of having increased RMC were fourfold greater or more compared with those aged <30 years. These effects seemed to decline as the outcome became more severe, with the odds decreasing to 1·7 for very high RMC in both age categories (30–55 years and >55 years).
More years of study were protective for the high RMC category only (Table 4). Note that gender is not included in the model because it is used in the definition of the levels of the RMC.
Semi-parametric model for risk for metabolic complications (RMC), Campinas, São Paulo, 2006–2007
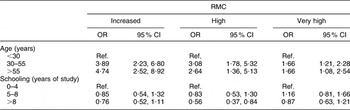
Ref., reference category.
All RMC categories compared with no risk.
The house locations for the individuals of the sample are plotted according to each level of the RMC in Fig. 1. The sample covers the entire populated area.
Distribution of a population-based sample according to risk for metabolic complications, Campinas, São Paulo, Brazil, 2006–2007

Crude spatial risk for the three levels of the RMC (increased, high and very high) in relation to absence of risk suggested different patterns in each level (Fig. 2). We detected a significant area in the north-east of the region for both increased and high categories of the RMC (Figs 2(a) and (b)). We also found a small area with lower odds for increased RMC in the east of the region (Fig. 2(a)) and for high RMC in the central north (Fig. 2(b)). For very high RMC we found a protective area in the south-west of the region (Fig. 2(c)).
Crude spatial analysis of the risk for metabolic complications, Campinas, São Paulo, Brazil, 2006–2007: (a) increased; (b) high; (c) very high

As shown in Table 3, gender, age and schooling might influence the distribution of RMC over the region. So, an adjusted spatial risk for the RMC in relation to the absence of risk was calculated (Fig. 3). As expected, the surface of the adjusted risk was more flat compared with Fig. 2 and the significant areas were smaller, although the patterns of the risk remained similar.
Adjusted spatial analysis of the risk for metabolic complications, Campinas, São Paulo, Brazil, 2006–2007: (a) increased; (b) high; (c) very high

Discussion
The analytical method proposed here considers all levels of the response variable in a single model and the inclusion of a non-parametric component, the geographical coordinates, as an alternative to study the influence of environment on the risk for type 2 diabetes, hypertension and CVD. The results presented indicate that the association of house location and RMC calls for more consideration. These population-based data for an urban region of 277 000 inhabitants and area of 128 km2 showed few significant associations considering both crude and adjusted spatial risk. Age >30 years was associated with RMC in all three of its categories, while more years of study was protective for RMC only in the high risk category. Higher prevalence of overweight and obesity with increasing age and lower education levels has also been detected in Brazil by Monteiro et al.(Reference Monteiro, Conde and Popkin7).
Urban characteristics in the region point to the similarity in the prevalence of obesity and consequently less variation of the RMC. The small area detected as statistically significant for increased RMC has better socio-economic indicators than the whole region, and the protective area corresponds to lower indices as income, schooling of household heads and urban infrastructure (water supply, sewage and garbage collection). For very high RMC, the protective area corresponds to a very poor county(41).
Although we had a lack of environmental information such as food supply and access to parks, we could identify an association between RMC and areas with certain sociodemographic characteristics which corroborates the consensus reported by the US Institute of Medicine(Reference Koplan, Liverman and Kraak14) stating that the environmental factors play a role and that environmental solutions are required to address the epidemic of obesity(Reference Glass, Rasmussen and Schwartz15). In this direction, it is noted also that the nutritional environment has been investigated in order to deepen the understanding of the widespread prevalence of obesity, including the study of local availability, access to health food and environmental conditions(Reference Glanz, Sallis and Saelens42–Reference Procter and Smith45). These data support the importance of focusing on places in addition to the individuals who live in those places. The public health significance of these findings may lie in the additional evidence provided that spatial location and its features can influence patterns of risk for type 2 diabetes, hypertension and CVD.
Multinomial logistic regression is already widely used in epidemiological studies and can identify different patterns in the levels or categories of the response variable(Reference Kilicarslan, Isildak and Guven46, Reference Ziraba, Fotso and Ochako47). The selection of GAM with polytomous logistic regression and bi-dimensional kernel enriches the present analysis and provides another way to analyse data on the epidemic of obesity, a challenge for public health today. Because this epidemic is the result of a system that contains a diverse set of factors at many levels of scale, with different individual motivations and priorities, the search for new forms of analysis that can address all of the factors at their different levels helps in its understanding, combat and prevention(Reference Hammond48).
One limitation of the present study, and indeed most of studies on this topic, is that our data are observational and cross-sectional. Because of this, causal association of current house location with RMC cannot be attributed to the location and the variables included in the statistical model. Additionally, we did not include information about diet or lifestyle variables in the analysis as the main objective was to apply the multinomial method and to locate the individuals at risk. A further limitation is that although the sample size was adequate for the statistical analysis and we covered the entire inhabited area, we found similarity in the region. The features of the region, being predominantly urban with similar economic and social development throughout, hampered the identification of an environmental component that could be influencing the differences in risks within the area. Strengths of the present study include greater precision in the measurement of individual location to estimate the spatial risk over the region and the use of the semi-parametric GAM combining this location with other covariates of interest.
While there are many ways to define community, geographic location is one important way to understand the context in which people live(Reference Schlundt, Hargreaves and McClellan23). We identified small areas with different levels of risk, allowing health interventions in the community and providing information for community-based health research. Future studies including prospective follow-up, evaluation of community interventions and additional information that has been studied elsewhere(Reference Glass, Rasmussen and Schwartz15, Reference Hill and Peters16, Reference Drewnowski, Rehm and Solet20, Reference Schlundt, Hargreaves and McClellan23, Reference Sharkey, Horel and Han49–Reference Elinder and Jansson52), such as food supply, access to parks, diet and physical activity, will help understand the growth of the obesity epidemic in developed countries. In order to establish associations between the obesogenic environment, eating patterns and health, we need good and reliable tools and indicators to characterize these environments(Reference Elinder and Jansson52). In previous centuries, major advances in the control of infectious diseases, like cholera and tuberculosis, came from environmental changes involving public sanitation. The modern epidemics of obesity, type 2 diabetes, hypertension and CVD may require a return to this basic strategy. Studies suggest that community redevelopment and housing policy, in addition to other benefits, may contribute to improvements in population health(Reference Glass, Rasmussen and Schwartz15).
Conclusions
Spatial point analysis with a multinomial approach to properly treat variables with more than two categories improves the quality of data information. Risk and protective areas for metabolic complications were identified despite the distribution of the population according to gender, age and schooling. Thorough investigation is needed to identify the environmental factors that are responsible for the higher and lower risk in the studied area, but our results lead to a rapid intervention as was done for transmissible diseases in the past.
Acknowledgements
This work was supported by the São Paulo Research Foundation (FAPESP), processes 2006/05920-7, 2007/07435-1, 2008/05324-0 and 2008/58461-5. The authors declare they have no conflicts of interest. L.B.N. and A.C.C.N.M. designed and developed the study's analytic strategy. L.T.O.Z. supervised the field activities and M.A.T.M. helped conducted the literature review. R.C. designed the study and directed its implementation.


