

Increasing the dietary intake of tree nuts and products derived from them has been suggested to be an effective means of improving dietary habits. Tree nuts, such as almonds and pistachios, are a rich source of mostly unsaturated fatty acids, dietary fibre and various phytochemicals( Reference Coates and Howe 1 ). Most of the suggested health benefits of nut consumption have been attributed to fatty acids and phytochemicals( Reference Bolling, Chen and McKay 2 ). However, the significant amounts of fibre in nuts form an important substrate for microbial fermentation in the gut and thus might facilitate the maintenance or selection of a healthy microbiota composition, which includes mostly bacteria, viruses and fungi( Reference Ukhanova, Culpepper and Baer 3 ). Such positive effects have been established for various purified complex carbohydrates, such as inulin and galacto-oligosaccharides, that are commonly described as prebiotics.
Many aspects of human health have been reported to be associated with gut microbiota composition and activities( Reference Atkinson, Frankenfeld and Lampe 4 – Reference Mai and Draganov 7 ). The fermentation of fibre to beneficial end products, especially butyric acid, and the biotransformation of phytochemicals are considered to be important mechanisms through which microbiota might improve health. Little is known as to how nuts, in general, and almonds and pistachios, in particular, affect the microbiota composition. Directed changes in the intestinal physiology through the modification of gut microbiota composition by dietary interventions (prebiotics and probiotics) have the potential to prevent diseases. Although gut microbiota composition is unique for each individual, the main metabolic capabilities encoded by the commensal gut metagenome appear to be preserved( Reference Kurokawa, Itoh and Kuwahara 8 , Reference Qin, Li and Raes 9 ).
Molecular tools, especially high-throughput sequencing, have helped overcome the limitations of conventional microbiological cultivation methods for studying gut microbiota composition( Reference Tannock 10 , Reference Vaughan, Schut and Heilig 11 ). These tools have already been extensively utilised to study potential associations between microbiota composition and energy balance in the context of obesity( Reference Turnbaugh, Ley and Mahowald 12 – Reference Sun, Cai and Mai 15 ). High-throughput 16S rRNA sequencing allows for a semi-quantitative analysis of known as well as unknown bacteria, which is in contrast to quantitative PCR (qPCR) and fluorescence in situ hybridisation, which depend on a priori information on DNA targets.
Almonds or pistachios might exhibit prebiotic effects by enriching potentially beneficial microbes such as bifidobacteria or lactic acid bacteria (LAB). Energy provided by macronutrients that reach the large colon, including fibre and fats from nuts, is derived from the metabolic activities of the resident microbiota. Consequently, as microbiota composition varies among individuals, the energy gained from fibre fermentation might also vary and correlate with microbiota composition. Indeed, we have previously reported such an association for a resistant maltodextrin( Reference Ukhanova, Culpepper and Baer 3 ). In vitro modelling of the gastrointestinal tract investigating the potential prebiotic effects of almonds has demonstrated that consumption of almond skins increases the population levels of bifidobacteria and Clostridium coccoides/Eubacterium rectale group( Reference Mandalari, Faulks and Bisignano 16 ).
In the present study, we investigated the hypothesis that the intake of up to 85 g/d of almonds or pistachios affects bacterial or fungal microbiota composition.
Materials and methods
Study design
Details of the two study designs have been published previously( Reference Baer, Gebauer and Novotny 17 , Reference Novotny, Gebauer and Baer 18 ). Almonds were supplied by the Almond Board of California and pistachios were provided by Paramount Farms. Briefly, volunteers (n 18 for the almond feeding study and n 16 for the pistachio feeding study) were recruited to participate in two separate randomised, controlled, cross-over studies with three 18 d feeding periods separated by a washout period of at least 2 weeks. The subjects were randomly assigned to three treatment groups: (1) no nuts; (2) 1·5 servings/d either almonds or pistachios; (3) 3 servings/d of either almonds or pistachios. During the three treatment periods, the subjects consumed the same-base typical low-fibre American diet. All foods and beverages were prepared (weighed to the nearest 1 g) and supplied by the Human Studies Facility at the Beltsville Human Nutrition Research Center, Beltsville, MD, USA. The subjects ate dinner and breakfast at the centre during the week; they received carryout lunches and snacks. Weekend meals and treatment products were packaged with instructions for home consumption. The subjects were required to eat all the food provided to them and nothing else. The present study was conducted according to the guidelines laid down in the Declaration of Helsinki, and all procedures involving human subjects were approved by the Institutional Review Board of the Medstar Health Research Institute, Hyattsville, MD, USA. Written informed consent was obtained from all the subjects. The subjects received financial compensation for their participation.
Sample collection
For microbiota analysis, faecal samples (a total of six faecal samples per subject) were collected on the first and the last day of each of the three feeding periods. The subjects obtained a cooler filled with ice for the storage of samples until delivery to the laboratory. For this analysis, all the samples were delivered on ice, usually within 4 h of defaecation. The samples were processed by kneading in a strong plastic bag immediately upon arrival to the laboratory and stored at − 80°C.
Microbiota analysis
Denaturing gradient gel electrophoresis analysis
Bacterial genomic DNA was isolated from the faecal samples by the bead-beating method. This method allows for the efficient lysis of most of the bacterial cells and appears to have little bias( Reference Miller, Bryant and Madsen 19 ). Denaturing gradient gel electrophoresis was carried out as described by Zoetendal et al. ( Reference Zoetendal, Akkermans and de Vos 20 ) on 8 % (w/v) acrylamide gels with a gradient from 40 % at the top to 50 % at the bottom at a temperature of 60°C. Denaturing conditions (100 %) were defined as 7 m-urea and 40 % formamide. The gels were run for 16 h at 65 V and stained with SYBR Green Nucleic Acid Gel stain. Images of the stained gels were scanned with imaging software (Quantity One; Bio-Rad) and analysed with database software (Diversity; Bio-Rad).
Quantitative PCR
We targeted the potentially probiotic LAB and bifidobacteria for qPCR to (1) confirm the results obtained from 16S rRNA sequencing and (2) to circumvent the known bias introduced by mismatches to the ‘universal’ sequencing primers. Reactions were carried out in duplicate using a QuantiTect SYBR Green PCR kit (catalogue no. 204143; Qiagen) on Stratagene MX3000P in a final volume of 12·5 μl with 10 ng of DNA template and 0·2 μm of each primer. The following primers and annealing temperatures were used: (1) eubacteria (V3 forward 5′-CCT ACG GGA GGC AGC AG-3′ and V3 reverse 5′-ATT ACC GCG GCT GCT GG-3′, 56°C); (2) bifidobacteria (forward 5′-TCG CGT C(C/T)G GTG TGA AAG-3′ and reverse 5′-CCA CAT CCA GC(A/G) TCC AC-3′, 58°C); LAB (forward 5′-AGC AGT AGG GAA TCT TCC A-3′ and reverse 5′-ATT YCA CCG CTA CAC ATG-3′, 58°C). Standard curves for quantification were constructed using genomic DNA extracted from Bifidobacterium adolescentis (ATC15703D lot no. 4013365) for bifidobacteria and VSL no. 3 mix (Sigma-Tau Pharmaceuticals, Inc.) for LAB. The amounts of input DNA were converted into genome equivalents by dividing the amounts of template DNA by 2·5 fg, the average genome mass of the targeted LAB and bifidobacteria. As different bacterial species contain different numbers of 16S rRNA copies, this approach allows for a better comparison of the quantities of bacteria present in a sample.
454-Based pyrosequencing
To determine bacterial diversity, DNA was amplified using a barcoded pyrosequencing primer set (35) based on 16S rRNA-targeting universal primers 27F and 533R. We obtained readings from one whole plate. For sequencing of fungal DNA, we used primers directed against the IS4 and IS5 inter-spacer regions( Reference Larena, Salazar and Gonzalez 21 ). Sequences of low quality or with a length of less than 200 nucleotides were removed from the analysis. The sequences were binned using the ESPRIT algorithm( Reference Sun, Cai and Liu 22 ). Bacterial 16S rRNA sequences were then analysed with the QIIME (Quantitative Insights Into Microbial Ecology) software package( Reference Caporaso, Kuczynski and Stombaugh 23 ) using Greengenes as a 16S rRNA gene database and the Ribosomal Database Project( Reference Cole, Wang and Cardenas 24 ), including features to calculate diversity indices and rarefaction curves. Fungal internal transcribed spacer sequences were analysed using a pipeline for the processing and identification of fungal internal transcribed spacer sequences( Reference Nilsson, Bok and Ryberg 25 ).
Statistical analysis
After background subtraction, denaturing gradient gel electrophoresis profiles were subjected to Gauss modelling. Multiple gels were combined using the Diversity Database software (Bio-Rad). We then calculated a similarity matrix based on Pearson's correlation coefficients and generated phylogenetic trees based on various algorithms (Ward, UPMA). The Shannon–Weaver diversity index was calculated and compared between the samples using a two-sided t test. qPCR data were analysed as genomic equivalents per ng of DNA; significance was determined using a two-sided t test.
For sequencing data, Student's t test was used when data were normally distributed; otherwise, a paired χ2 test followed by Fisher's combined was used to test for a difference in the proportion of operational taxonomic units (OTU). We adjusted for an expected high false discovery rate by increasing the requirement for statistical significance to P< 0·01. The QIIME package was used to calculate P values for differences in UniFrac distances.
Results and discussion
We initially analysed gut microbiota composition using denaturing gradient gel electrophoresis-based profiling as a quality control for DNA extraction and PCR amplification. We obtained profiles in the normal range of diversity for all the samples. We did not detect any distinct band or distortion in banding pattern associated with the consumption of either almonds or pistachios (data not shown).
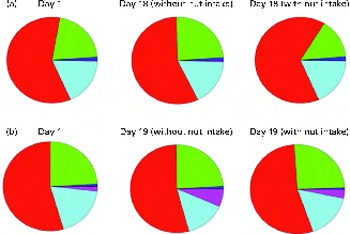
To carry out a more targeted quantitative microbiota analysis, we analysed microbiota by qPCR with primers directed towards bifidobacteria and LAB, which represent two major groups of potentially beneficial bacteria. While the mean numbers of LAB decreased with the intake of pistachios, in twelve of fourteen subjects, a decrease in the number of LAB was observed when they consumed 42·5 or 85 g/d of pistachios, and the number of bifidobacteria appeared to be unaffected by the intake of either pistachios or almonds (Fig. 1(a) and (b)). The lack of an effect on the number of bifidobacteria is in contrast to a previous report that has shown an increase in the number of bifidobacteria after the consumption of almond skins( Reference Mandalari, Faulks and Bisignano 16 ).
Amounts of (a) lactic acid bacteria (LAB) and (b) bifidobacteria determined by quantitative PCR (qPCR) and expressed in genome equivalents. ![]() , Pistachios;
, Pistachios; ![]() , almonds. P values are indicated only when < 0·05. * Mean values on day 19 with nut intake were significantly different from those on day 1 (P= 0·02). A colour version of this figure can be found online at http://www.journals.cambridge.org/bjn
, almonds. P values are indicated only when < 0·05. * Mean values on day 19 with nut intake were significantly different from those on day 1 (P= 0·02). A colour version of this figure can be found online at http://www.journals.cambridge.org/bjn

To expand our microbiota analysis from the limited number of gut bacteria targeted by qPCR, we carried out high-throughput microbial community 16S rRNA sequencing using 454 titanium technology, generating a total of 875 292 reads. After the removal of short-length and low-quality sequences, we retained 301 576 sequences with an average sequence length of 368 nucleotides for the gut bacterial samples obtained from subjects who consumed almonds and 226 452 sequences with an average sequence length of 373 nucleotides for gut bacterial samples obtained from subjects who consumed pistachios. Binning sequences using ESPRIT-Tree generated 18 992, 7277 and 1768 OTU at the 98, 95 and 90 % levels, respectively, for subjects who consumed almonds and 15 109, 6219 and 1592 OTU at the 98, 95 and 90 % levels for subjects who consumed pistachios. The distribution of sequences in the 100 most dominant OTU for both feeding studies is shown in online Supplementary Figs. S1 and S2. The consumption of either almonds or pistachios did not appear to have strongly affected the proportion of the most dominant OTU.
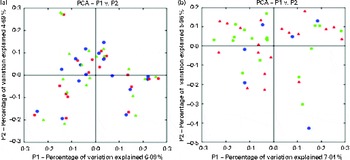
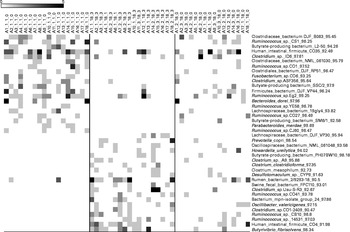
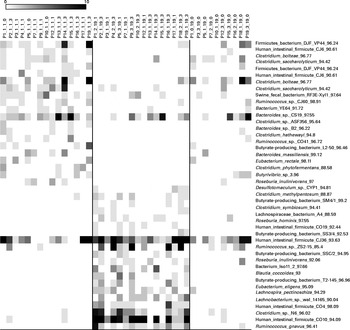
Chao-1, a measure of α-diversity, was not affected by the intake of either almonds or pistachios (data not shown) and neither were the proportions of the main phyla present (Fig. 2(a) and (b)). The relative stability at the phylum level suggests that almond and pistachio intake selects for functions that are distributed across the main phyla present, such as those required to efficiently metabolise the dietary fibre present in nuts to beneficial end products such as butyrate. The mean UniFrac distance, a measure of β-diversity, was larger for the effects of pistachio consumption than for those of almond consumption, indicating a stronger impact of the former on gut microbiota composition (data not shown). The principal coordinate analysis plots based on the UniFrac analysis are shown in Fig. 3(a) and (b). Heat maps showing the OTU that are most significantly affected by almond (Fig. 4) or pistachio (Fig. 5) consumption also suggest a stronger effect of pistachio consumption. Although many different OTU were affected by almond or pistachio consumption, we observed only 2 OTU that were significantly decreased upon the intake of either almonds or pistachios, one closest to the Firmicutes bacterium DJF VP44 (96·2 %) and the other closest to Clostridium sp. ASF 396 (95·6 %). The differences in the effects of the consumption of either almonds or pistachios on gut microbiota composition are probably due to the distinct chemical composition of the nut components, including dietary fibres, that reach the large intestine.
Changes in the proportion of operational taxonomic units grouping into the five most dominant bacterial phyla (Actinobacteria ![]() ; Bacteroidetes
; Bacteroidetes ![]() ; Firmicutes
; Firmicutes ![]() ; Proteobacteria
; Proteobacteria ![]() ; Tenericutes
; Tenericutes ![]() ; other
; other ![]() ). (a) Almonds and (b) pistachios. Based on 16S rRNA sequence similarity, individual sequence reads were matched to the closest sequence in the database and the corresponding phylum was determined. All the sequences matching one of the five most prevalent phyla were then added up. A colour version of this figure can be found online at http://www.journals.cambridge.org/bjn
). (a) Almonds and (b) pistachios. Based on 16S rRNA sequence similarity, individual sequence reads were matched to the closest sequence in the database and the corresponding phylum was determined. All the sequences matching one of the five most prevalent phyla were then added up. A colour version of this figure can be found online at http://www.journals.cambridge.org/bjn
Principal coordinate analysis (PCA) plots based on the UniFrac analysis. (a) Almonds and (b) pistachios. Each sample is depicted by a single symbol. ![]() ,
, ![]() , Day 1;
, Day 1; ![]() ,
, ![]() , day 18 or 19 with nut intake;
, day 18 or 19 with nut intake; ![]() , day 18 or 19 without nut intake. A colour version of this figure can be found online at http://www.journals.cambridge.org/bjn
, day 18 or 19 without nut intake. A colour version of this figure can be found online at http://www.journals.cambridge.org/bjn
Bacterial operational taxonomic units (OTU) (98 %) most strongly affected by almond intake. Left column: day 1, middle column: day 18 with nut intake, and right column: day 18 without nut intake. Each column represents one faecal sample and each row shows 1 OTU with its closest match indicated on the right. Darker shading indicates larger number of sequences detected.
Bacterial operational taxonomic units (OTU) (98 %) most strongly affected by pistachio intake. Left column: day 1, middle column: day 19 with nut intake, and right column: day 18 without nut intake. Each column represents one faecal sample and each row shows 1 OTU with its closest match indicated on the right. Darker shading indicates larger number of sequences detected.
When we investigated the metabolic characteristics associated with bacterial OTU that increased upon nut consumption, we observed an increase in the number of presumed butyrate producers, mostly hitherto uncharacterised butyrate producers labelled as such in the database. Butyrate is an important fuel for epithelial colonocytes and has been shown to help maintain normal differentiation( Reference Canani, Costanzo and Leone 26 ). Thus, an increase in the amounts of butyrate generated in the gut might be an indication of improved gut health. As we only determined the likelihood of generating significant amounts of butyrate based on the 16S rRNA phylotypes, this observation needs to be confirmed by additional metagenomic and/or metabolomic studies. However, as butyrate is largely absorbed by the gut epithelium, determination of the amounts of butyrate remaining after passage of a stool sample might not correlate strongly with butyrate production, which occurs mainly in the proximal colon. Similar concerns would make it difficult to correlate results obtained from bacterial gene expression studies in stool samples with expression levels in the proximal colon.
Various fungi, some of them present in the healthy human gut, can thrive on nuts and products made from them. To determine the effects of nut consumption on fungi, we analysed changes in the fungal microbiome in the study participants after nut consumption. Although various fungal OTU decreased in proportion (P< 0·01) when either almonds (Fig. 6) or pistachios (Fig. 7) were consumed, no fungal OTU increased statistically significantly upon nut consumption. As has been described above for the bacterial OTU, pistachio consumption had a stronger effect on the fungal microbiota than almond consumption.
Fungal operational taxonomic units (OTU) most significantly affected by almond intake. Left column: day 1, middle column: day 18 with nut intake, and right column: day 18 without nut intake. Each column represents one faecal sample and each row shows 1 OTU with its closest match indicated on the right. Darker shading indicates larger number of sequences detected.

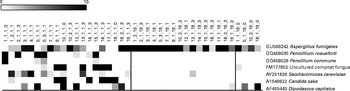
Fungal operational taxonomic units (OTU) most significantly affected by pistachio intake. Left column: day 1, middle column: day 19 with nut intake, and right column: day 18 without nut intake. Each column represents one faecal sample and each row shows 1 OTU with its closest match indicated on the right. Darker shading indicates larger number of sequences detected.
Conclusions
We have shown that tree nuts, almonds and especially pistachios, can affect the composition of the bacterial and fungal faecal microbiota. The consumption of neither almonds nor pistachios increased the numbers of LAB and bifidobacteria, often considered beneficial and thus included in various probiotic formulations. The apparent enrichment of butyrate producers upon nut consumption is indicative of potential health benefits that need to be confirmed in studies with well-defined health outcomes. Our observations are consistent with a potential prebiotic effect of nuts. Improvement of microbiota composition might be yet another benefit of increasing the dietary intake of almonds and pistachios. Future efforts need to link such changes in microbiota with improvements in specific health outcomes.
Supplementary material
To view supplementary material for this article, please visit http://dx.doi.org/10.1017/S0007114514000385
Acknowledgements
The authors thank the study subjects for their willingness to participate and the staff of the Beltsville Human Nutrition Research Center for their help with the study. The authors cordially thank Sara Daniels, Fleta Netter and Alexander Gutalj for their expert help with parts of the microbiota analysis.
The present study was funded by the Almond Board of California and Paramount Farms. The funders contributed to the study design, but did not participate in the conduct of the study, analysis of the samples or data, interpretation of the findings or preparation of the manuscript. The laboratories of D. J. B. and V. M. received funding from the Almond Board of California for carrying out the present study.
The authors' contributions are as follows: J. A. N. and D. J. B. designed and supervised the feeding studies; M. U., X. W., M. F. and V. M. developed and carried out the microbiota analysis; J. A. N., D. J. B., M. U., X. W., M. F. and V. M. carried out the data analysis including statistical analysis; D. J. B., M. F. and V. M. contributed to the writing of the manuscript. All authors approved the final version of the manuscript.


