

1. Introduction
Debates over functional descriptions in the philosophy of ecology have been popular as of recently (Odenbaugh Reference Odenbaugh and Hazzlett2010, Reference Odenbaugh2019; Nunes-Neto et al. Reference Nunes-Neto, Moreno and El-Hani2014; Dussault and Bouchard Reference Dussault and Bouchard2017; Millstein Reference Millstein2020; Lean Reference Lean2021; Dussault Reference Dussault2022; Krohs and Zimmer Reference Krohs and Zimmer2023; Morrow Reference Morrow2023). Four general theories of ecological function are defended: selected effects, systemic capacity, organizational theory, and persistence enhancing. A theory is often judged as adequate or inadequate based on its ability to include proper functions in and to exclude nonfunctions from its functional descriptions. This evaluative measure is termed the liberality criterion.Footnote 1 Many claim that one theory is superior when compared to the others given how well it addresses the liberality criterion. In this article I criticize the deference that is shown to the liberality criterion in the evaluation of a theory’s adequacy.
The essay is divided into three sections. The first section briefly summarizes the four general theories of ecological function and formally introduces the liberality criterion. The second section presents a hypothetical case. All four theories fail to satisfy the liberality criterion for the hypothetical case. The idea is not to refute the four theories. In fact, each theory yields a meaningful explanation of the hypothetical case that ecologists might find useful. Rather, I aim to refute the liberality criterion’s focal role in the evaluation of each theory’s adequacy. The third section sketches an alternative strategy. A theory’s functional description should be considered adequate as long as it leads to a better understanding of the complex phenomenon under study. I invoke Lean (Reference Lean2018) account of the indexical community concept as an apt starting point.
2. Theories of ecological function
Several articles review the four general theories of ecological function (Odenbaugh Reference Odenbaugh2019; Lean Reference Lean2021; Krohs and Zimmer Reference Krohs and Zimmer2023; Morrow Reference Morrow2023), so my presentation here is brief. This section summarizes the theories and introduces the liberality criterion to set the stage for the hypothetical case that is analyzed in the next section.
Jax (Reference Jax2005, Reference Jax2010) categorization of ecological functions is the typical springboard for discussions of the subject. He identifies four general meanings of function and functioning in ecology. The terms are used to reference:
-
1. A single process that describes a cause-and-effect relationship between two objects.
-
2. Several processes that operate within the context of the larger system:
-
2a. What happens? Which processes occur? How do organisms interact?
-
2b. How does the whole operate or perform? How is the whole sustained?
-
-
3. The role attributed to particular objects (i.e., “bearers of function”) within the system.
-
4. The role attributed to the whole system’s practical use (i.e., ecosystem services).
Discussions of the four general theories of ecological function are situated between the second and third interpretations (Dussault and Bouchard Reference Dussault and Bouchard2017; Millstein Reference Millstein2020; Dussault Reference Dussault2022). Both construe a distinct part–whole relationship. The second treats the whole ecosystem as the proper subject of a functional description. The third assigns functions primarily to the parts that comprise the whole ecosystem (Dussault Reference Dussault2022). The notable distinction between these two interpretations is that the former subscribes to a top-down view whereas the latter is bottom up.
The first theory of ecological function is the selected effects (SE) account. Wright (Reference Wright1973) is credited as its originator. Wright’s etiological definition assigns SE functions to traits that are naturally selected. A heritable trait possesses an SE function if possession of the trait confers adaptive advantages that increase the organism’s overall fitness. A commonly cited example is the human heart (Odenbaugh Reference Odenbaugh and Hazzlett2010). The human heart is a heritable trait that increases the fitness of the human species in virtue of its ability to circulate blood. Early accounts of SE functions centered on biological functions, like the function of the human heart (Millikan Reference Millikan1989; Neander Reference Neander1991), but it is contestable if SE functions scale up to ecological functions. Many philosophers of ecology reject the SE theory as adaptive traits of organisms are not obviously directed at ecosystem functioning (Maclaurin and Sterelny Reference Maclaurin and Sterelny2008; Nunes-Neto et al. Reference Nunes-Neto, Moreno and El-Hani2014; Dussault and Bouchard Reference Dussault and Bouchard2017; Odenbaugh Reference Odenbaugh2019; Dussault Reference Dussault2022; Morrow Reference Morrow2023). For instance, a peacock’s plumage is an inherited trait selected by peahens that does not cause their ecosystem to adopt any particular functionality. Recently, Millstein (Reference Millstein2020) advanced a modified version of the SE theory to account for Leopold’s use of function. She argues that coevolution between interactive species produces SE functions that operate at the ecological level. Initial reactions to Millstein’s account have been mixed (cf. Dussault Reference Dussault2022; Morrow Reference Morrow2023), but her modified SE theory offers explanatory insights that are absent from other theories, like an account of evolution’s role and a synthesis of community and ecosystem perspectives.
SE functions are contrasted with Cummins’ (Reference Cummins1975) causal role (CR) functions (Amundson and Lauder Reference Amundson and Lauder1994). Odenbaugh (Reference Odenbaugh and Hazzlett2010, Reference Odenbaugh2019) posits a CR-style account of systemic capacity (SC) functions for ecology. “The systemic capacity function account understands the function of x to F in terms of how the capacity or disposition to F contributes to a system S’s capacity or disposition to C” (Odenbaugh Reference Odenbaugh and Hazzlett2010, 252). In other words, a bearer of an SC function is relevant to the causal explanation of an emergent ecosystem behavior. Detritivores that consume litter and generate soils to stabilize the nutrient cycling capacity of the ecosystem possess SC functions (Maclaurin and Sterelny Reference Maclaurin and Sterelny2008). Similarly, a predator that increases diversity and stabilizes an ecosystem as a result of its predation possesses an SC function. Sterelny (Reference Sterelny2006) cites Paine (Reference Paine1966) starfish experiment as one such case. In both examples, neither the detritivores nor the starfish are selected by the ecosystem to perform their SC functions. Rather, SC functions describe how the activities of organisms are causally related to a distinct ecosystem behavior. But SC functions are not restricted to organisms. Odenbaugh (Reference Odenbaugh and Hazzlett2010, Reference Odenbaugh2019) assigns SC functions to abiotic elements, like lightning and volcanoes that contribute to a natural system’s nitrogen fixation capacity. The flexibility to accommodate abiotic elements in functional descriptions is a distinct advantage of the SC theory.
Whereas the first two theories subscribe to a more bottom-up view, the final two are more top down. Nunes-Neto et al. (Reference Nunes-Neto, Moreno and El-Hani2014) propose the organizational theory (OT) of ecological function. On this account, an ecosystem component possesses an OT function if, and only if, it cycles the flows of energy and matter that are essential to the structure of the ecosystem’s causal loop. The OT theory is informed by two principles from previous accounts of biological functions (Mossio et al. Reference Mossio, Saborido and Moreno2009; Mossio and Moreno Reference Mossio and Moreno2010; Saborido et al. Reference Saborido, Mossio and Moreno2011), self-maintenance and closure. Self-maintenance is an ecosystem property. Transfers of energy and matter between the components of an ecosystem are typically asymmetrical. Predators do not return energy and nutrients to the prey species that they consume. But, taken collectively, networks of trophic interactions ensure that the ecosystem sustains its organizational structure over time. At the level of ecosystem components, the bearers of OT functions constrain various flows of energy and matter that regulate and reinforce the ecosystem’s boundary conditions. Nunes-Neto et al. (Reference Nunes-Neto, Moreno and El-Hani2014) refer to this structural arrangement as a closure of constraints. Each constraint governs an interaction so as to close off the causal loop of processes that constitute the ecosystem. Thus, the OT theory differs from the SE and SC theories in that it fixes functional descriptions to a single ecosystem feature (self-maintenance) and a particular type of organizational structure (constrained causal loops).
The fourth theory is the persistence enhancing (PE) account. PE functions are assigned to the parts of an ecosystem that promote the ecosystem’s persistence. An ecosystem part is said to possess greater ecological fitness than another if it is better able to solve the design problems that detract from an ecosystem’s ability to maintain a distinct state (Bouchard Reference Bouchard2008). Dussault and Bouchard (Reference Dussault and Bouchard2017) situate the PE theory within the framework of Holling (Reference Holling1973), Reference Holling and Peter1996) ecological resilience concept. Ecological resilience indicates an ecosystem’s ability to endure disturbances to maintain a distinct stability regime (e.g., coral reef, grassland, pine forest, etc.).Footnote 2 Additionally, the SE theory integrates resilience theory’s distinction of functional groups and functional responses (Elmqvist et al. Reference Elmqvist, Carl Folke, Garry Peterson, Walker and Norberg2003; Folke et al. Reference Folke, Steve Carpenter, Marten Scheffer, Gunderson and Holling2004). A functional group sorts the PE functions performed by species into categories (e.g., nitrogen fixation, grazing, predation, etc.). Multiple species belong to the same functional group but perform PE functions under unique environmental conditions and across spatiotemporal scales to generate a mesh of overlapping functional responses (Jax Reference Jax2005). The specificity of the functions that the PE theory assigns in relation to a definitive ecosystem property (i.e., ecological resilience) is an advantage that it has over the other theories.
The part–whole dynamic between function bearers and an ecosystem that grounds all four theories invites the liberality criterion. The liberality criterion is simple: a functional description is adequate only if it successfully discriminates between functions and nonfunctions (Morrow Reference Morrow2023). All theories of ecological function construct responses to and develop criticisms on the basis of the liberality criterion (Nunes-Neto et al. Reference Nunes-Neto, Moreno and El-Hani2014; Dussault and Bouchard Reference Dussault and Bouchard2017; Odenbaugh Reference Odenbaugh2019; Morrow Reference Morrow2023). Many retreat to pluralism (Garson Reference Garson2017; Lean Reference Lean2018; Odenbaugh Reference Odenbaugh2019; Millstein Reference Millstein2020; Morrow Reference Morrow2023). The retreat to pluralism is sensible since the liberality criterion is a by-product of the idealization of ecosystems as closed systems. In reality, ecosystems are open across multiple scales (Wiens Reference Wiens1989; Holt Reference Holt, Gary, Mary and Gary2004). Pluralism empowers ecologists to utilize the idealization without a firm commitment to realism about ecosystem discreteness. This is a familiar exercise for philosophers of complexity science (Mitchell Reference Mitchell2009; Potochnik Reference Potochnik2017) and ecological complexity theorists (Allen and Starr Reference Allen and Starr1982; O’Neill et al. Reference O’Neill, DeAngelis, Waide and Allen1986). Yet the philosophy of ecology seems reluctant to abandon the liberality criterion. I argue that this is a mistake because it allows metaphysical inconsistency to obscure the epistemological utility inherent to the theories.
In the next section I present a hypothetical case to illustrate how deference to the liberality criterion is dysfunctional for all four theories of ecological function. In the final section I suggest that theories of ecological function should be evaluated differently. A theory should be considered adequate as long as its functional descriptions promote a better understanding of the complex phenomenon under study.
3. The hypothetical case
Each theory of ecological function posits its own test case to demonstrate how its definition outperforms others. Millstein (Reference Millstein2020) discusses parasitic beetles and their bee hosts in her modified SE account. Odenbaugh (Reference Odenbaugh and Hazzlett2010, Reference Odenbaugh2019) cites Rhizobium and the nitrogen cycle in his defense of the SC account. Nunes-Neto et al. (Reference Nunes-Neto, Moreno and El-Hani2014) use a bromeliad and its associated organisms (e.g., spiders and flies) to champion OT functions. And Dussault and Bouchard (Reference Dussault and Bouchard2017) can draw on any number of examples from resilience theory (see Folke et al. Reference Folke, Steve Carpenter, Marten Scheffer, Gunderson and Holling2004) to corroborate their PE theory. Rather than follow this model (i.e., offer a definition of ecological function, posit an example to confirm the definition, then explain how the definition is more advantageous than the others), I present a hypothetical case in which all four theories struggle to satisfy the liberality criterion. The objective is not to rank the theories or to propose another definition of ecological function. Instead, I intend to point out how deference to the liberality criterion needlessly problematizes functional descriptions that otherwise provide useful explanatory insights.
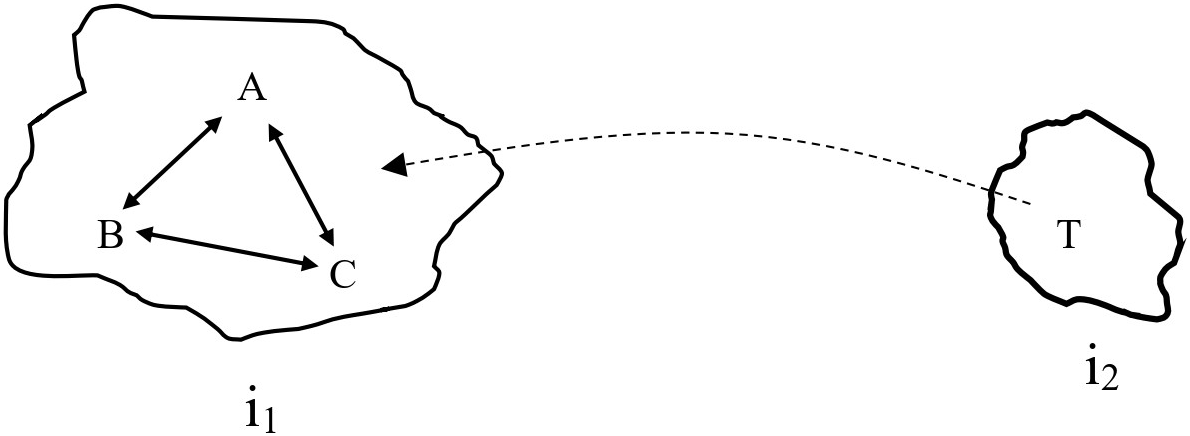
Here is the hypothetical case: Imagine a two-island scenario. Both islands possess unique configurations of ecological functions. An ecologist is asked to provide a functional description of the ecosystem found on one of the islands, i1. The ecologist satisfies the liberality criterion if, and only if, she successfully differentiates between functions and nonfunctions for the ecosystem on i1. Assume that the set of ecological interactions among species A, B, and C satisfies the liberality criterion under normal circumstances regardless of whether the ecological interactions are described with SE, SC, OT, or PE functions. Occasionally, a tramp species, T, on the adjacent island, i2, disperses to i1 (see figure 1). When T disperses to i1, it interacts with A–B–C in an ecologically discernible way. This is the question posed to each of the four theories: how does the functional description of A–B–C on i1 account for T?
A diagram of ecosystem A–B–C (composed of species A, B, and C) on island i1 and the tramp species, T, on island i2 that occasionally disperses to i1. The bidirectional arrows between A, B, and C signify ecosystem discreteness rather than any explicit type of causal interactions.

3.1. The SE approach’s potential responses
Oceanic islands are often characterized by remarkable coadaptation among resident species due to strong isolation effects on evolutionary histories (Carlquist Reference Carlquist1974). So, the SE theory seems well disposed to offer a meaningful functional description of A–B–C, especially Millstein (Reference Millstein2020) modified account since it integrates Thompson (Reference Thompson2005) Geographic Mosaic Theory of Coevolution (GMTC). The GMTC explains the coadaptation that emerges between proximate populations over evolutionary timescales. Populations that happen to coexist in the same geographical area jury-rig their ecological interactions to produce SE functions. But how might the SE theory fit T’s arrival into its functional description of A–B–C?
Established island populations sometimes lose their ability to compete against conspecifics if they are highly isolated. Wilson (Reference Wilson1961) taxon cycle concept describes the general replacement procedure. His work on Melanesian ants revealed that established island populations thrived for several generations but were outcompeted as soon as a novel competitor arrived on the island.Footnote 3 However, it is not necessarily the case that T replaces A, B, or C. Instead, i1 might be within T’s seasonal migratory range when i1’s productivity supports more populations (MacArthur Reference MacArthur1969). If so, T’s seasonal arrival could affect the coadaptation dynamics of A–B–C, albeit to a lesser degree.
In a taxon cycle scenario, T probably does not possess an SE function with respect to A–B–C since T lacks a historical connection to the evolutionary process that generated the SE functions possessed by A, B, and C. But the substitutability of T for the replaced population raises a question in regard to the status of the other populations that remain on i1. Does the loss of their evolutionary partner affect their SE functions? The question challenges the SE theory’s commitment to the idea that coadaptation is a communal process. It seems incorrect to revise the SE functions ascribed to the remaining populations even though one member is lost from the original functional description. The evolutionary processes remain operative as long as the populations continue to interact.
The seasonal migration scenario is a different story. It might be said that T possesses an SE function of increased flight duration (Amundson and Lauder Reference Amundson and Lauder1994). Specific morphological traits aside, greater vagility is an evolutionary trait that increases T’s ecological fitness (Holt Reference Holt, Robert and Schluter1993). But this interpretation is vulnerable to the liberality criterion. T possesses its SE function irrespective of A–B–C. T’s SE function operates over a spatial scale larger than i1. Hence, T’s SE function is not exclusive to A–B–C. The scalar incompatibility, in turn, exacerbates the problem. If T belongs to the SE theory’s functional description of A–B–C, then where is the precise stopping point? Why not include the populations that T interacts with on other islands, like i2? In most cases the SE theorist makes a thoughtful decision about the appropriate stopping point (in space and time). But such decisions defy the liberality criterion to pursue a better understanding of the complex phenomenon as defined by the SE theorist’s research aims.
3.2. The SC approach’s potential responses
The SC account requires a designated systemic capacity before it is testable. The hypothetical case was inspired by Diamond (Reference Diamond, Martin and Jared1975) research on assembly rules for bird guilds located in the South Pacific. Diamond’s study discovered evidence for MacArthur (Reference MacArthur1972) concept of diffuse competition (i.e., the systematic exclusion of outside competitors by the established members of a community due to their combined niche structure).Footnote 4 So, let A–B–C represent a configuration on i1 that possesses the systemic capacity of competitive exclusion through diffuse competition. A–B–C’s capacity to exclude species is diminished after a disturbance as the alteration to i1’s environmental conditions (e.g., habitat loss, reduction in resources, etc.) stresses the ecological interactions that hold A–B–C together. T’s invasion of i1 is highly probable at this time, and the configuration on i1 transforms into A–B–C–T. A–B–C–T possesses the capacity to resist invaders due to its greater niche saturation. Simultaneously, T returns the environmental conditions on i1 to their pre-disturbance state via subsidy effects, like seed dispersal (Cumming and Norberg Reference Cumming, Norberg, Norberg and Graeme2008). A, B, and C eventually reestablish ecological interactions strong enough to exclude T. All things considered, is it the case that T possesses an SC function with respect to A–B–C’s systemic capacity to enact competitive exclusion?
I envision four ways for an SC theorist to respond. The first is to deny that T possesses an SC function given that the systemic capacity of A–B–C tends to exclude T when it is at full strength. Ulanowicz (Reference Ulanowicz1997) ascendency model posits a similar claim. An ecosystem may support certain species early in its development because the ecological interactions are weak, but all ecosystems tend towards a state of maximum organization. A teleological perspective, like Ulanowicz (Reference Ulanowicz1990), could claim that any species filtered out during an ecosystem’s ontogenesis does not belong to the ecosystem proper. In truth, this is an underdeveloped area of the ecological function discussion. It is not clear if some threshold separates functions from nonfunctions. Implementation of an expected threshold is prudent since no functional description fully exhausts the causal complexity of a natural system (Wimsatt Reference Wimsatt1972). However, such a practice is antithetical to the liberality criterion because elements of the ecosystem that are known to possess an SC function (to some degree) are intentionally omitted from the functional description.
A second way that an SC theorist could respond to the hypothetical case is to emphasize the dispositional nature of SC functions. Perhaps T only possesses an SC function in relation to A–B–C if the interactions between A, B, and C are weakened by an exogeneous disturbance. Prima facie, this looks like a safe bet since the definition of SC function refers to dispositions. A–B–C is the appropriate functional description under ideal conditions, but explanations require flexibility to safeguard consistency when confronted with nonideal cases. But reference to dispositions becomes pernicious if the boundaries of the ecological unit are not well defined (as in the hypothetical case). Species exist all over the planet that, if introduced, would possess an SC function with respect to A–B–C. Despite the fact that T is more proximate and, as a result, more likely to interact with A–B–C, it would be impossible to establish criteria for dispositional SC functions that do not beg the question, why these conditions? Thus, the introduction of dispositional SC functions engenders more conceptual inconsistencies that contravene the liberality criterion.
Third, an SC theorist could accept that T possesses an SC function. As I previously stated, Odenbaugh (Reference Odenbaugh and Hazzlett2010, Reference Odenbaugh2019) argues for the SC theory given its ability to incorporate various abiotic elements, like lightning strikes and volcanic eruptions, into functional descriptions of systemic capacities, like nitrogen fixation. Similarly, moderate disturbances (e.g., hurricanes) are regularly incorporated into island dynamics. Patch dynamics theory (Pickett and White Reference Pickett and White1985), hierarchy theory (O’Neill et al. Reference O’Neill, DeAngelis, Waide and Allen1986), and resilience theory (Scheffer Reference Scheffer2009) all support this interpretation. So, it appears reasonable to attribute an SC function to T if the abiotic elements that prompt T’s dispersal from i2 are part of the functional description, too. But this interpretation is also imperfect. Two different systemic capacities are conflated. The original systemic capacity was competitive exclusion via diffuse competition, which belongs solely to the ecological interactions between A, B, and C. If the disturbance is incorporated into the functional description, then the systemic capacity is more akin to adaptive capacity, a property associated with resilience (Sundstrom et al. Reference Sundstrom, Allen, Angeler, Lance, Craig and Garmestani2022). Competitive exclusion is strongest during the conservation phase of an ecosystem’s adaptive cycle—a period marked by low adaptability and low resilience due to the increased rigidity of the internal interactions—but T arrives during earlier post-disturbance phases when ecological interactions are weak (Holling and Gunderson Reference Holling, Gunderson, Lance and Holling2002).Footnote 5 Consequently, it is more accurate to say that T possesses a PE function as opposed to an SC function.
The simplest solution, though, is to ignore the liberality criterion. The flexibility of the SC theory to accommodate diverse research interests is a distinct virtue that Odenbaugh (Reference Odenbaugh and Hazzlett2010, Reference Odenbaugh2019) rightfully emphasizes. Nothing prevents a qualified functional description of A–B–C where an SC function is attributed to T under specific contexts. However, the practice would certainly defy the liberality criterion. The ecological dynamics are not discrete enough to meet the expectations placed on functional descriptions by the liberality criterion. Ultimately, I argue that a functional description should be evaluated based on its explanatory advantages rather than its adherence to the liberality criterion. And the SC theory clearly provides a number of explanatory advantages.
3.3. The OT approach’s potential responses
The hypothetical case tests the OT theory’s logical commitment to system closure. On the OT theory, A, B, and C possess OT functions due to each’s ability to circulate structure-inducing resources (e.g., biomass) in an autocatalytic way that promotes A–B–C’s self-maintenance as an integrated unit. Ulanowicz (Reference Ulanowicz1986, Reference Ulanowicz1997) ascendency model is a network analysis approach that is highly compatible with the OT theory on this point. The ascendency model utilizes information theory to calculate ecosystem connectedness. With the additional quantitative dimension (i.e., information theory), a functional description of A–B–C as a collection of OT functions appears practical, scientifically informative, and reasonable as long as A–B–C forms a closed causal loop. But no perfectly homeostatic systems exist in nature, and Nunes-Neto et al. (Reference Nunes-Neto, Moreno and El-Hani2014) admit as much. An ecosystem closed at one scale is open at the one above (Wiens Reference Wiens1989; Holt Reference Holt, Gary, Mary and Gary2004). So, how does the OT theory accommodate T’s arrival on i1?
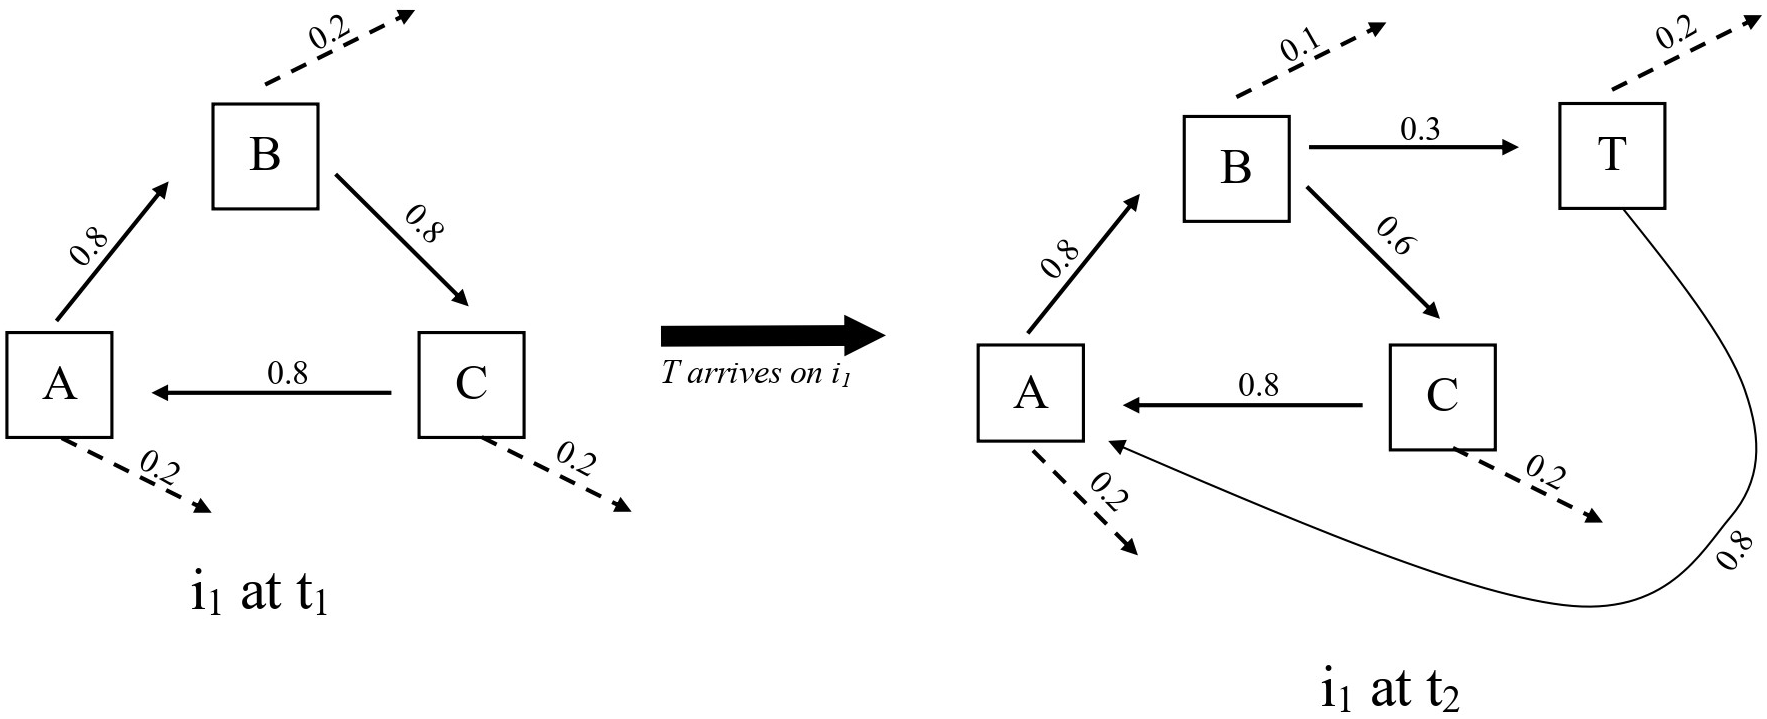
The solution is for the OT theory to revise its idealization of a causal loop. The movements of energy and matter that increase system connectedness do not form a deterministic pattern. The movements from one compartment (e.g., A, B, and C) to another within the network are probabilistic. Organizational structure emerges when the probabilities of interactions all near 1 (i.e., certain). Plenty of errancy exists throughout a network, though. Errancy, or overhead, is essential to organizational integrity because it prevents the overconnectedness that induces system fragility (Ulanowciz Reference Ulanowicz1997). In terms of the hypothetical case, an OT theorist could claim that T possesses an OT function once it establishes probabilistic relations with other compartments that promote the ecosystem’s self-maintenance to an appreciable degree (figure 2). What probability value constitutes an appreciable degree is a matter of debate, but the logical consistency of the OT theory is preserved and the liberality criterion is seemingly satisfied.
Hypothetical organization diagrams of A–B–C at t1 (prior to T’s arrival) and A–B–C–T at t2 (after T’s arrival). From Ulanowicz’s (1997) ascendency model, arrows represent the flows of information between compartments. Information quantifies flows of structure-inducing energy or matter. Values correspond to probabilities between 0 and 1. Dashed arrows represent errancies (i.e., overhead). Ulanowicz’s (1995, 653) simplest example is the Cone Spring ecosystem, which includes compartments for plants, detritus, bacteria, detritovores, and carnivores.

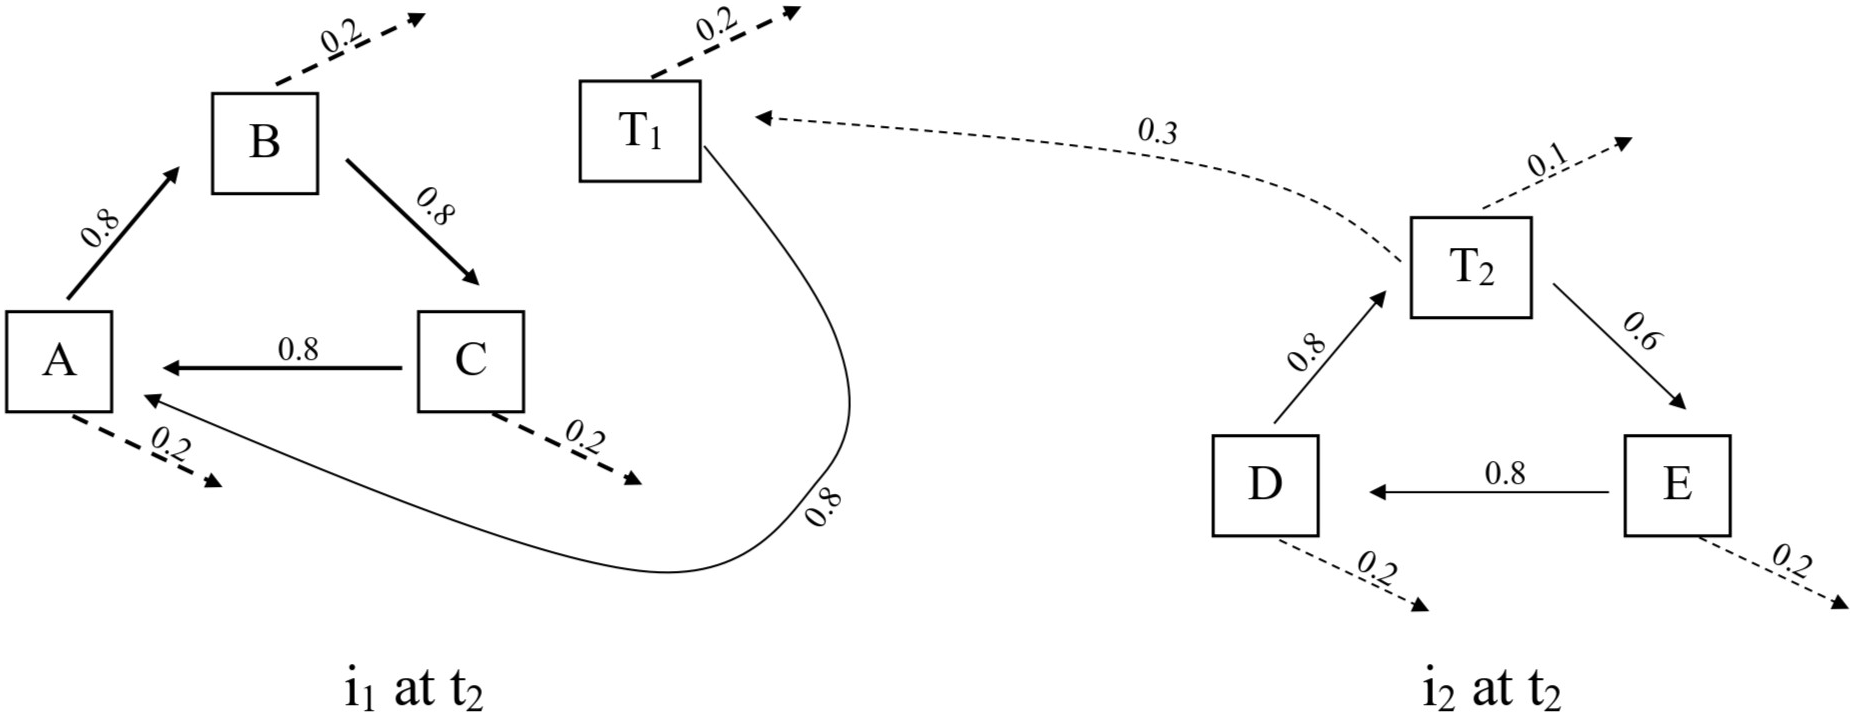
Although the proposed solution seems plausible enough, it is inadequate. Two populations of T must first be distinguished to clarify the inadequacy. Let T1 represent the population of T that immigrates to i1, and let T2 represent the population of T that remains on i2. Some vagile species, like T, have a high enough dispersal rate to overcome a high extinction rate. The result is a peculiar situation where a species’ fundamental niche is smaller than its realized niche (Pulliam Reference Pulliam1988). In effect, the species contributes to the organization of the ecosystem without reciprocal flows that embed it into the system’s self-maintaining web of interactions (figure 3). In ecological terms, T2 is a source population that sustains a sink population, T1 (Whittaker Reference Whittaker1998). Therefore, the conditions that define OT functions are faced with a choice between two unattractive options. Either T2 does not possess an OT function since it lacks the trademark closure that is central to the OT theory, which appears dubious if the organizational integrity of A–B–C exhibits some dependency on the inputs from T2. Or T2 does possess an OT function, and the notion of system closure needs revision as it is scaled up to the level of ecosystems (Lean Reference Lean2021).
A diagram that represents the organizational structure between the two islands, i1 and i2. D and E are species that belong to the D–T–E ecosystem on i2. T1 and T2 indicate the populations that are located on i1 and i2 respectively. Ulanowicz (1986) suggests a similar approach to handle spatial heterogeneity in an earlier formulation of the ascendency model.

Nunes-Neto et al. opt for the second of the two options, but their revisions are insufficient to satisfy the liberality criterion. They apply hierarchy theory to refine their conception of a closure of constraints. The logic of their account relies on Simon (Reference Simon1962) characterization of systems as nearly decomposable organizational structures. Put simply, the interactions between system parts produce emergent organizational structure (i.e., the whole is greater than the sum of the parts). But the organizational structure never achieves homeostasis. Instead, a hierarchy of loosely coupled systems regulates the organizational structure of systems through cross-scalar constraints (Simon Reference Simon and Howard1973). Nunes-Neto et al. argue (sensu Pattee Reference Pattee and Robert1972) that systems are embedded in a control hierarchy that coordinates flows of energy and matter towards perpetual self-maintenance. Lower-level agents restrict the behaviors of higher-level organizational structures, and vice versa. Therefore, T appears to constitute a constraint that entangles two levels. One level is A–B–C on i1, and the other level is the i1–i2 configuration (i.e., the combination of species that belong to both i1 and i2 and that form a self-maintaining causal loop). So, neither T1 nor T2 technically possess an OT function with respect to A–B–C. Only the metapopulation T properly possesses an OT function in the context of a multi-level hierarchy of constraints.Footnote 6
The hierarchical construal of system closure is vulnerable to at least two criticisms. First, hierarchy theory is fundamentally incompatible with the liberality criterion. The liberality criterion is a matter of metaphysical precision, and hierarchy theory is conceived as an epistemological tool to simplify complexity (Allen and Starr Reference Allen and Starr1982; O’Neill et al. Reference O’Neill, DeAngelis, Waide and Allen1986; Allen and Hoekstra Reference Allen and Hoekstra1992; cf. Salthe Reference Salthe1985).Footnote 7 Organizational structure is not neatly differentiated into discrete levels (Potochnik Reference Potochnik, Brooks, DiFrisco and Wimsatt2021). Second, the hierarchical construal is committed to the unintuitive idea that a member of T2 possesses an OT function in relation to A–B–C even though it never disperses to i1. The idea is equally problematic if the analysis focuses on the members of T1. Some members of T1 will not contribute to the self-maintenance of A–B–C in the same manner or to the same degree. So, do all members of T1 have to be divided into individual compartments to avert the misattribution of OT functions? If so, that would be an impractical workaround just to satisfy the liberality criterion.
3.4. The PE Approach’s Potential Responses
Dussault and Bouchard (Reference Dussault and Bouchard2017) posit the PE theory as an intermediate account that avoids the excessive liberality of the SC theory and the excessive restrictiveness of the OT theory. As previously shown, one of the SC theory’s responses recommends a view that is compatible with the PE theory, and the OT theory fails to include ecological agents that originate from outside an ecosystem’s set boundaries. But does the PE theory successfully describe the hypothetical case? I argue that the PE theory is a strong candidate, but it succumbs to the liberality criterion, too.
Since the PE theory’s principles are derived from Holling (Reference Holling1973, Reference Holling and Peter1996) original resilience concept, let A–B–C represent a self-organizing ecosystem with high ecological resilience (i.e., an ability to absorb exogenous disturbances to remain within the same qualitatively distinct stability regime). If A–B–C possesses strong internal feedback dynamics, then T’s arrival will likely have a negligible effect on the dominant processes. Walker (Reference Walker1995) refers to species like T as passengers that are entrained by the dominant processes enacted by drivers (i.e., A, B, and C). The passenger–driver designation effectively differentiates T’s weaker PE function from the stronger PE functions that hold A, B, and C together. Then, T’s functional group and functional response roles can be added as supplemental details to the more definitive functional description of A–B–C.
The PE theory also provides even greater ontogenetic precision in response to the hypothetical case. If T arrives after a stochastic dispersal event, then it probably possesses a minor PE function as a passenger species with respect to A–B–C. T would contribute only slightly to A–B–C’s persistence. But if the arrival of T to i1 coincides with a moderate disturbance, then T’s PE function is likely more noteworthy. Vagile species perform PE functions as mobile links to promote ecosystem recovery. Mobile links make ecological contributions as resources linkers (e.g., nutrient transportation), genetic linkers (e.g., seed dispersion), and process linkers (e.g., trophic interaction; Nyström and Folke Reference Nystrӧm and Folke2001; Lundberg and Moberg Reference Lundberg and Moberg2003). The significance of mobile links reaches its peak during the reorganization and exploitation phases of the adaptive cycle. As the ecosystem progresses towards the conservation phase, dominant processes reemerge (Clark Reference Clark2024). Resilience theorists associate the PE functions that are performed by mobile links with spatial resilience rather than the traditional interpretation of ecological resilience that primarily concerns internal self-organizing feedbacks (Cumming Reference Cumming2011). Thus, the PE theory seems to outperform the alternative frameworks in its ability to situate T’s PE function within the ontogenetic narrative of A–B–C.
Despite the PE theory’s superior ability to differentiate T’s PE function, its response to the hypothetical case remains deficient. Dussault and Bouchard’s account overlooks two important details about resilience. First, most PE functions are context sensitive. Obviously, a species can perform more than one PE function at a time, but the significance of each PE function will often vary from ecosystem to ecosystem. For example, B’s critical PE function in A–B–C might be being prey, whereas its critical PE function in B–D–E (on another island) is being a grazer, especially if the two ecosystems are located in zones with characteristically different stability regimes (e.g., grassland versus montane forest). Does B possess the whole assortment of its PE functions at all locations, or only the ones relevant to the ecosystem under consideration? Even though the species is the same, the functional description fails to satisfy the liberality criterion if it includes more PE functions than actually exist in a given context.
Morrow (Reference Morrow2023) counterfactual account offers a way to respond to this first issue. On this view, B possesses a PE function insofar as it would perform the same PE function regardless of the current stability regime of the ecosystem under consideration. In response to the hypothetical case, T possesses a PE function as long as T performs the same PE function (to some degree) in deserts, forests, tundra, and so on. Morrow’s counterfactual account prevents an explosion of PE functions, but, at the same time, it invites a similar T1–T2 problem as before. T1’s most critical PE function with respect to A–B–C is being a post-disturbance mobile link. But the mobile link PE function does not apply to all members of T2. Some members of T2 never disperse after a disturbance, yet all members of T1 originate from the T2 population. Moreover, several generations might pass between moderate disturbance events (Holling Reference Holling2001). So, it is unclear if T2 rightfully belongs to the functional description of A–B–C.
The second neglected detail concerns adaptive capacity. An ecosystem that lacks sufficient adaptive capacity is liable to undergo transformation from one stability regime to another after a moderate disturbance (Allen and Holling Reference Allen and Holling2010). If an ecosystem possesses sufficient adaptive capacity, then it innovates via processes of internal reorganization to remain in the same stability regime (Sundstrom et al. Reference Sundstrom, Allen, Angeler, Lance, Craig and Garmestani2022). Innovation complicates the attribution of PE functions because the ecosystem persists but some of its component populations, which possess PE functions, are replaced. Imagine that T develops a PE function to replace B in A–B–C. The PE theory assigns PE functions relative to the persistent ecosystem, so A–B–C and A–T–C are virtually functional equivalents as long as the dominant causal processes have not collapsed and restructured. How does the PE theory explain B’s possession of a PE function prior to T’s arrival and its lack of a PE function after its replacement if the ecosystem never switches stability regimes? Does B somehow belong to the functional description of A–T–C? Although this line of questioning appears troublesome for the PE theory, it is only troublesome if the liberality criterion serves as the chief measure of the PE theory’s adequacy.
4. Understanding complexity
The previous section presented a hypothetical case to assess the four theories of ecological function. The hypothetical case was not meant to refute the four theories but rather to criticize the liberality criterion as a test of adequacy. Each theory of ecological function was shown to offer an insightful interpretation of the hypothetical case that supports real research aims pursued in ecology. But the liberality criterion unravels the explanatory advantages gained from the various theories as it smuggles in a metaphysical commitment about the discreteness of ecological units that is unsatisfied by most accounts. The prevalence of pluralism within ecological function theory suggests that I am not alone in my dissatisfaction with the liberality criterion. Pluralism acts as a means to negotiate between competing views about the proper boundaries of an ecological unit. The conceptual framework used to delineate the ontological boundaries of an ecological unit determines the appropriate theory of ecological function. The liberality criterion operates as little more than a self-imposed obstacle on the way to that obvious conclusion. This seems needlessly counterproductive. Instead, the functional descriptions detailed by theories of ecological function should be evaluated epistemologically. This section sketches an alternative strategy that abandons the liberality criterion to better understand complex phenomena. The indexical community concept is invoked as an apt starting point.
The liberality criterion fundamentally rests on a conception of ecosystem discreteness. But many realize that no such discreteness exists. Shrader-Frechette and McCoy (Reference Shrader-Frechette and McCoy.1993) argue that no single definition of ecological concepts, like community and ecosystem, exhausts the research aims of ecology. The ecological units are tailored to scientific inquiry: “The exercise of determining, a posteriori, the boundaries of a community may have heuristic power for uncovering any structures underlying such communities, if indeed there are any” (Shrader-Frechette and McCoy Reference Shrader-Frechette and McCoy.1993, 59). Jax (Reference Jax2006, Reference Jax2010), too, advocates for a heuristic interpretation of ecological unit concepts. Like the hierarchy theorists (Allen and Starr Reference Allen and Starr1982; O’Neill et al. Reference O’Neill, DeAngelis, Waide and Allen1986; Allen and Hoekstra Reference Allen and Hoekstra1992), he argues that nature furnishes the data points but the observer decides where to delimit the boundaries of an ecosystem. Odenbaugh (Reference Odenbaugh2007, Reference Odenbaugh and Hazzlett2010) is more moderate. He asserts that ecosystems are concrete particulars with beginnings and endings. The strength of the causal relationships that constitute the ecosystem ultimately govern the ecosystem’s discreteness. Thus, a continuum exists. Odenbaugh (Reference Odenbaugh2007) cites watersheds as examples of where ecosystems possess objective boundaries. Jax (Reference Jax2006) also references watersheds as ecosystems where topographical and functional boundaries coincide, but he cautions that this is rare. At the same time, “[a] watershed ecosystem, or a lake, is far from being uniform” (Kolasa and Zalewski Reference Kolasa and Zalewski1995, 1). The boundaries that delimit an ecosystem represent an idealization that assumes uniformity for the sake of understanding (Potochnik Reference Potochnik2017).
Lean (Reference Lean2018) indexical community concept offers a better way forward for the evaluation of functional descriptions. Originally posited by Sterelny (Reference Sterelny2006), an indexical community refers to a population set that is defined relative to a specific research question. Some details are purposefully omitted to better understand others. “Identifying indexical communities enables us to pose some of the traditional problems of community ecology while remaining neutral on the extent to which the relevant phenomenological community is a causal system” (Sterelny Reference Sterelny2006, 227). Lean (Reference Lean2018) expands the indexical community concept. Simple indexical communities are useful for analyses of single populations but not for community-level properties. To make community-level properties analyzable, Lean suggests a three-step process that resembles Thomas and Pickett (Reference Thomas, Pickett, David and Thomas Parker1998) proposed patch model to account for historically contingent ecosystem dynamics. The first step is to adopt an interventionist account of causation (sensu Woodward Reference Woodward2010). Second, a specific set of causal interactions are selected based on the investigation’s research aims. Third, the causal interactions are mapped geographically:
Once we identify which causal relations are relevant, we map where these causal actors are distributed geographically, which is the information needed to identify the spatial boundaries of the community. The innovation here is that by using multiple starting points, we can build in robustness and avoid the explanatory fragility of indexical communities built around a single population. (Lean Reference Lean2018, 514)
Lean admits that interventionist accounts of causation are vulnerable to criticism because actual interventions are usually impossible. Ecological causation is too complex anyway. But his geographical approach is intended to embody Wimsatt (Reference Wimsatt1972) notion of a descriptively complex perspective. When an indexical community is geographically mapped, it reveals how theoretical perspectives align with one another. The appearance of spatially congruent objects that are shared by the theoretical perspectives indicates robustness. The hypothetical case is evidence of this fact. All four theories of ecological function share the same objects of interest (i.e., A, B, C, A–B–C, and T) that are similarly bounded in physical space. Collectively, the theories fill in each other’s explanatory gaps to produce a multicausal interpretation of the hypothetical case.
If the liberality criterion is abandoned, then philosophers of ecology require a new test to evaluate the adequacy of functional descriptions after an indexical community is defined.Footnote 8 I argue that adequacy should be evaluated based on how a given functional description leads to a greater understanding of complexity. Ecosystems emerge from a mix of internal feedbacks, cross-scalar constraints, and stochastic disturbances. Ecosystems are also path dependent insofar as they “preserve the memories of their pasts” (Levin Reference Levin1999, 158). Despite the widespread complexity and contingency, a robust understanding of complex phenomena is possible (Allen and Starr Reference Allen and Starr1982; Lawton Reference Lawton1999).Footnote 9 Each theory of ecological function effectively idealizes the causal structure of a phenomenon to improve understanding. Importantly, idealizations do not need to be robust to all investigative aims to be adequate. This is Potochnik (Reference Potochnik2017) point with respect to complexity science more generally. The same applies here. Functional descriptions are motivated by specific research aims, and their adequacy should be evaluated accordingly.
As a corollary, the savviness afforded by a pluralist approach is essential to success. Each theory supplies a constructive framework to interpret complex phenomena. Whether a functional description satisfies the liberality criterion for all interpretations is a nonissue as it pertains to the pursuit of understanding. Ecological complexity theorists make a similar claim with respect to scale. The correct scale to interpret data is determined by a study’s interests in a particular complex phenomenon (Allen and Starr Reference Allen and Starr1982; O’Neill et al. Reference O’Neill, DeAngelis, Waide and Allen1986; Meentemeyer and Box Reference Meentemeyer, Box and Monica1987; Kolasa Reference Kolasa1989; Levin Reference Levin1992; Wiens et al. Reference Wiens, Stenseth, Van Horne and Ims1993; Cadenasso et al. Reference Cadenasso, Pickett, Weathers and Jones2003). To this end, theories of ecological function are invaluable epistemological tools (for philosophers and ecologists alike) to describe complex phenomena. And the liberality criterion is little more than an obstacle on the path to understanding.
5. Conclusion
This article discussed how four general theories of ecological function evaluate a functional description’s adequacy for a hypothetical case. Each theory failed to satisfy the liberality criterion. Nevertheless, the theories were used to articulate meaningful interpretations of the hypothetical case. I reasoned that deference to the liberality criterion is a mistake because it needlessly problematizes legitimate scientific inquiry. The various theories facilitate understanding even if they do not satisfy the liberality criterion. I suggested that a theory should be considered adequate if it leads to a better understanding of complexity. This shift in perspective unlocks new investigative avenues for theories of ecological function that respond to the diverse research aims of ecologists (e.g., genetics, populations, communities, landscapes, etc.).
Acknowledgments
I sincerely appreciate the feedback that I received from Melinda Fagan and the participants of the Institute for Practical Ethics at the University of California San Diego’s 2025 workshop on environmental philosophy, which included Derek Halm, Roberta Millstein, Jay Odenbaugh, Carlos Santana, Shermin de Silva, Natalie Jacewicz, Annabelle Tao, Joaquin López-Huertas, Drew Dittmer, Ellis Jones, and Andrés Garzón-Oechsle. I am also grateful for the comments and suggestions that I received throughout the review process.
Funding Information
None to declare.
Declarations
None to declare.

 Open access