


It is commonly reported that during exercise, sweat losses exceed fluid intake, and that many individuals finish exercise in a hypohydrated state(Reference Noakes, Adams and Myburgh1–Reference Passe, Horn and Stofan3). In situations where individuals finish exercise in a hypohydrated state, rehydration after exercise will be required. If no further exercise is to be performed, restoration of water balance can usually be achieved by following normal dietary habits, but in situations where two exercise bouts are performed in close proximity, rehydration from the first bout of exercise will need to be rapid and effective if performance in the second bout of exercise is not to be compromised(Reference Judelson, Maresh and Farrell4).
Over the past 30 years, rehydration after exercise-induced dehydration has been well investigated, and the main factors affecting post-exercise rehydration have been identified as the volume and composition of the rehydration solution(Reference Shirreffs, Armstrong and Cheuvront5). It has been shown that for complete recovery of fluid balance, the volume of fluid consumed must be greater than the volume of sweat lost to account for ongoing fluid losses that occur after exercise and drink consumption(Reference Shirreffs, Taylor and Leiper6). While ingesting a volume of fluid in excess of that lost means fluid balance will be restored in the short term, it does not mean that this restoration of fluid balance will be maintained(Reference Maughan and Leiper7–Reference Evans, Shirreffs and Maughan10). For effective retention of the ingested solution, its composition is of vital importance.
Electrolytes, particularly Na, are lost in sweat(Reference Verde, Shephard and Corey11), and addition of Na to rehydration solutions prevents the reduction in plasma osmolality and arginine vasopressin concentration that occurs with the ingestion of a large volume of plain water, and results in increased fluid retention(Reference Nose, Mack and Shi12, Reference Nose, Mack and Shi13). The retention of a rehydration solution has been shown to be directly related to its Na concentration(Reference Maughan and Leiper7, Reference Shirreffs and Maughan8). There is also some evidence demonstrating that the addition of K to a rehydration solution might increase fluid retention(Reference Maughan, Shirreffs and Leiper14, Reference Nielsen, Sjogaard and Ugelvig15), although other investigations have shown no effect of the addition of K to a rehydration solution(Reference Shirreffs, Aragon-Vargas and Keil16). Similarly, the retention of a carbohydrate solution appears to be related to its carbohydrate concentration, with an increased carbohydrate concentration resulting in an increased fluid retention(Reference Evans, Shirreffs and Maughan10, Reference Osterberg, Pallardy and Johnson17).
Some investigations have demonstrated that consumption of solutions containing protein after exercise-induced dehydration might confer some advantage in terms of fluid retention over protein-free solutions(Reference Shirreffs, Watson and Maughan9, Reference Seifert, Harmon and DeClercq18, Reference Watson, Love and Maughan19). Shirreffs et al. (Reference Shirreffs, Watson and Maughan9) demonstrated that low-fat milk containing approximately 36 g/l protein is retained better than either a carbohydrate–electrolyte sports drink or water. While in a similar study, Watson et al. (Reference Watson, Love and Maughan19) observed a tendency (P = 0·051) for increased fluid retention following the ingestion of low-fat milk compared with that of a carbohydrate–electrolyte sports drink. Neither of these studies was aimed at examining the specific effects of protein on rehydration, and the large number of compositional differences, other than protein content, between the low-fat milk and the carbohydrate–electrolyte sports drinks used (e.g. energy density, fat content, carbohydrate content, Na and K concentration and carbohydrate type) makes the specific effects of the protein in the milk difficult to elucidate. Seifert et al. (Reference Seifert, Harmon and DeClercq18) compared the rehydration effectiveness of commercially available carbohydrate–protein and carbohydrate solutions with flavoured water, reporting increased fluid retention with the carbohydrate–protein solution compared with both the other solutions. Again, there was a difference in energy density between the carbohydrate–protein and carbohydrate solutions, making the specific effects of protein difficult to determine(Reference Seifert, Harmon and DeClercq18). In addition, Seifert et al. (Reference Seifert, Harmon and DeClercq18) employed a drink volume of 100 % body mass loss over a relatively short period of time (20 min) and, as a result, participants would not have reached positive fluid balance at any point during rehydration.
At present, it is unclear what impact the addition of protein to a rehydration solution consumed after exercise-induced dehydration will have on fluid retention. Milk protein contains approximately 80 % casein, which has been shown by some authors to empty from the stomach at a slower rate than energy-matched carbohydrate solutions(Reference Burn-Murdoch, Fisher and Hunt20, Reference Bowen, Noakes and Trenerry21) and might affect fluid retention. Reducing the rate of gastric emptying of a rehydration solution by increasing the glucose concentration of the ingested solution has previously been shown to reduce the rate of water uptake into the circulation(Reference Evans, Shirreffs and Maughan22) and appears to offset the decline in serum osmolality observed with the ingestion of a large volume of dilute fluid and results in increased fluid retention(Reference Evans, Shirreffs and Maughan10).
The purpose of the present investigation was therefore to examine the specific effects of milk protein on rehydration after exercise in the heat, via the comparison of energy- and electrolyte content-matched carbohydrate and carbohydrate–milk protein solutions consumed in a volume equivalent to 150 % of body mass loss.
Materials and methods
Subjects
Eight healthy male subjects volunteered to participate in the present study, which was approved by the Nottingham Trent University School of Science and Technology Ethical Advisory Committee. A written consent to participate was obtained from all the subjects after the nature of the study and all experimental procedures had been fully explained. A medical screening questionnaire was completed before participation. Subjects' baseline physical characteristics were age 21 (sd 3) years, height 1·78 (sd 0·08) m and body mass 75·7 (sd 11·6) kg.
Experimental protocol
The subjects completed a familiarisation trial followed by two experimental trials, during which a different drink was ingested on each occasion. Experimental trials were separated by at least 7 d. The familiarisation trial involved completing the dehydration and rehydration protocols, described in detail later, and monitoring recovery for 1 h. Experimental trials began in the morning following an overnight fast, with the exception of approximately 500 ml plain water ingested approximately 1·5 h before the subjects arrived at the laboratory. This was to help ensure that the subjects were in an euhydrated state at the start of the trial. The subjects recorded their dietary intake and physical activity in the 24 h before the first experimental trial and were asked to repeat these patterns of dietary intake and physical activity in the 24 h preceding the second trial. The subjects were also asked to refrain from any strenuous physical activity and consumption of alcohol in the 24 h before each trial.
Upon arrival at the laboratory, the subjects voided their bladders (pre-exercise), and their body mass was measured (wearing dry boxer shorts only) to the nearest 50 g (Seca Digital Scales, Seca Limited, Birmingham, UK). The subjects then exercised in a temperature (35 ± 0·1°C) and humidity (50·9 (sd 2·1) % relative humidity) controlled environmental chamber (Design Environmental Limited, Ebbw Vale, UK) until they had lost approximately 1·6 % of their pre-exercise body mass. Due to continued sweating following the cessation of exercise, target body mass loss was 2·0 % of pre-exercise body mass. Exercise began at an intensity corresponding to 2 W/kg body mass, was the same during both experimental trials (P = 0·285), and amounted to 145 (sd 15) W. Exercise was performed on a friction-braked cycle ergometer (Monark Ergomedic E874; Cranlea, Birmingham, UK) in blocks of 10 min, separated by 5 min rest in the chamber. Body mass (wearing boxer shorts only) was monitored in the rest periods, and exercise was continued until the required body mass loss was achieved. Total exercise time was not different between the trials (P = 0·603) and amounted to 56 (sd 7) min, with total heat exposure, including rest periods lasting 82 (sd 10) min. Upon completion of the exercise, the subjects were allowed to shower for 15 min, after which their body mass was again measured (wearing dry boxer shorts only), and they provided a urine sample ( − 1 h). This body mass was used to determine total body mass loss from pre-exercise.
The subjects were then provided with a volume of rehydration drink in litres equivalent to 150 % of their body mass loss in kg. This drink was provided in four aliquots of equal volume every 15 min over a 1 h period (0, 15, 30 and 45 min). Drinks were prepared approximately 1 h before consumption and kept at room temperature. Each drink was mixed thoroughly, and its temperature was measured before serving. The temperature of the drink was not different between the trials (P = 0·731), and the temperature of the drink at serving was 16·6 ± 0·6°C over all the trials. After the 1 h rehydration period, the subjects provided a urine sample (0 h) and rested quietly in the laboratory (22·2 ± 1·5°C) for a further 4 h. During this recovery period, urine samples were provided by the subjects every hour (1, 2, 3 and 4 h). After providing the final urine sample (4 h), the subjects were again weighed (wearing dry boxer shorts only). Additionally, the subjects completed questionnaires related to their subjective feelings immediately before providing each urine sample (pre-exercise, − 1, 0, 1, 2, 3 and 4 h). The subjects were asked to rate their subjective feelings of thirst, stomach fullness, bloatedness, hunger, tiredness, alertness, concentration, head soreness, dryness of mouth, refreshness and energy using a 100 mm visual analogue scale, with 0 mm representing ‘not at all’ and 100 mm representing ‘very’. Additional questions on sweetness, saltiness, bitterness and pleasantness of the rehydration solutions were asked after the drink was consumed.
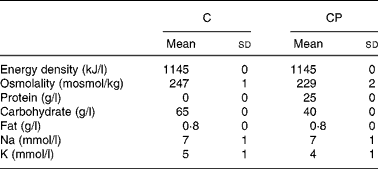
Trials were administered in a random, counterbalanced, crossover design, with subjects blinded as to which drink they consumed during each trial. Drinks (Table 1) were matched for energy and electrolyte content, with the only difference between the drinks being the carbohydrate and protein contents. The carbohydrate (C) drink contained 35 g/l glucose and 30 g/l maltodextrin, while the carbohydrate–protein (CP) drink contained 33·5 g/l glucose, 5 g/l maltodextrin, 1·5 g/l lactose (contributed by the protein supplement) and 25 g/l milk protein in the form of a commercially available protein supplement derived from the cold ultrafiltration of skimmed milk (Instant Milk Protein; Myprotein.co.uk, Manchester, UK). Additionally, the protein supplement contributed a small amount of fat, so an amount of olive oil providing the same amount of fat (0·8 g/l) was added to drink C. Both the drinks had a small amount (30 ml/l) of sugar-free squash added in an attempt to mask the drinks' contents. Furthermore, small amounts of NaCl (3 mmol/l) and KCl (4 mmol/l) were added to drink C to match Na and K concentrations between the drinks.
(Mean values and standard deviations)
For each urination, the subjects were instructed to completely empty their bladder and collect the entire volume in the container provided. The volume of each urine sample was measured, and a small (approximately 5 ml) sample was retained for subsequent analysis. A sample (approximately 5 ml) of each drink was also retained for subsequent analysis.
Sample analysis
Urine samples were analysed for osmolality by freezing-point depression (Gonotec Osmomat 030 Cryoscopic Osmometer; Gonotec, Berlin, Germany), while the drinks were analysed for osmolality as well as for Na and K concentrations by flame photometry (Corning Clinical Flame Photometer 410C; Corning Limited, Essex, UK).
Statistical analysis
All the data were analysed using SPSS 16.0 (Chicago, IL, USA). All the data were checked for normality of distribution using a Shapiro–Wilk test. All the data containing two variables were then analysed using a two-way repeated-measures ANOVA. Significant differences were located using Bonferroni-adjusted paired t tests for normally distributed data or Bonferroni-adjusted Wilcoxon signed-rank tests for non-normally distributed data. Variables containing one factor (e.g. drink perception) were analysed using paired t tests or Wilcoxon signed-rank tests as appropriate. Differences were accepted as being significant when P < 0·05. Normally distributed data are presented as means and standard deviations, while non-normally distributed data are presented as median (range).
Results
Pre-trial measurements
The subjects' pre-exercise body mass (75·66 (sd 11·86) kg (trial C), 75·91 (sd 11·50) kg (trial CP)) (P = 0·284) and urine osmolality (538 (sd 368) mosmol/kg (trial C), 417 (sd 337) mosmol/kg (trial CP)) (P = 0·314) were not different between the trials, indicating that the subjects began each trial in a similar state of hydration.
Body mass loss
The exercise-induced dehydration phase of the study resulted in a similar (P = 0·250) body mass loss of 1·41 (sd 0·24) kg (trial C) and 1·44 (sd 0·22) kg (trial CP). Over both the trials, mean body mass loss was 1·43 (sd 0·23) kg, representing 1·9 (sd 0·2) % of pre-exercise body mass. Subsequently, fluid intake during the 1 h rehydration period of the study was not different (P = 0·334) between the two trials (2·16 (sd 0·33) litres (trial C) and 2·12 (sd 0·36) litres (trial CP)).
Urine output and fluid balance
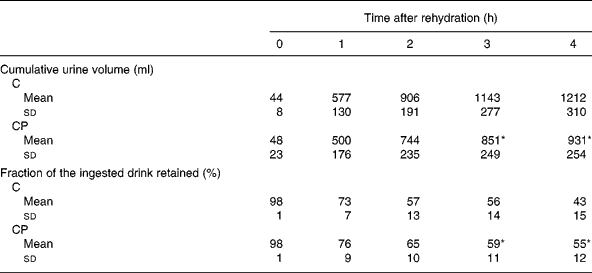
The volume of urine produced over each hour of the study (Fig. 1) was increased compared with that produced before rehydration ( − 1 h) at 1, 2 and 3 h during both the trials (P < 0·05). Additionally, there was a significant main effect of the trial (P < 0·05), with post hoc analysis revealing a significant difference between the trials at 3 h (P < 0·05). Cumulative urine output (Table 2) over the trial period was greater during trial C than during trial CP from 3 h onwards (P < 0·05), and at the end of the study, total cumulative urine volumes were 1212 (sd 310) ml and 931 (sd 254) ml during trial C and trial CP, respectively. Retention of the drinks (Table 2), calculated from the volumes of drink ingested and urine produced, was greater from 3 h after ingestion of drink CP than that after the ingestion of drink C (P < 0·05), and at the end of the study, 43 (sd 15) % and 55 (sd 12) % of drinks C and CP had been retained, respectively.
Urine output (ml) for each hour after exercise, following ingestion of the carbohydrate (C) (○) and carbohydrate–protein (CP) (●) drinks. * Significant difference between the trials (P < 0·05). Values are medians, with error bars representing ranges. † C and CP trials significantly different from − 1 h (P < 0·05).

(Mean values and standard deviations)
* Significantly different from C (P < 0·05).
Whole body net fluid balance (Fig. 2) was calculated from fluid losses in sweat (determined by body mass changes during exercise) and urine production, and fluid gained from drink ingestion. For the purposes of this investigation, it was assumed that all body mass loss was due to water loss, and water formed through substrate oxidation was ignored(Reference Maughan, Shirreffs and Leiper23). Whole body net fluid balance was significantly negative for trials C ( − 1·47 (sd 0·21) litres) and CP ( − 1·45 (sd 0·25) litres) at the end of exercise ( − 1 h) (P < 0·001) and had become significantly positive for trials C (+0·65 (sd 0·12) litres) and CP (+0·62 (sd 0·12) litres) at the end of rehydration (0 h) (P < 0·001). From the end of rehydration, ongoing urine production meant that net fluid balance decreased during both the trials and was significantly negative compared with pre-exercise from 3 h during trial C (P < 0·05). While whole body net fluid balance was negative from 2 h onwards during trial CP, it was not significantly negative at any time point compared with pre-exercise (P>0·168). Additionally, whole body net fluid balance was significantly different between the trials at 3 h and 4 h (P < 0·05), and at the end of the study, it was − 0·52 (sd 0·30) litres and − 0·26 (sd 0·27) litres for trials C and CP, respectively, representing a difference of 0·26 (sd 0·29) litres.
Net fluid balance (litres) during the carbohydrate (C) (○) and carbohydrate–protein (CP) (●) trials. * C trial significantly different from before exercise (P < 0·05). † C and CP trials significantly different from before exercise (P < 0·05). ‡ Significant difference between the trials (P < 0·05). Values are means, with error bars representing standard deviations.

Urine osmolality
Compared with pre-exercise, urine osmolality (Fig. 3) increased after exercise in the heat over both the trials (P < 0·05). Over both the trials, urine osmolality increased from 484 (sd 357) mosmol/kg before exercise to 708 (SD 234) mosmol/kg (P < 0·01) immediately after − 1 h. Urine osmolality was decreased 1 h after rehydration compared with pre-exercise for both the trials (P < 0·05), remaining decreased at 2 h during trial C (P < 0·05). Additionally, urine osmolality was lower at 2 and 3 h during trial C than during trial CP (P < 0·05).
Urine osmolality (mosmol/kg) during the carbohydrate (C) (○) and carbohydrate–protein (CP) (●) trials. * C trial significantly different from before exercise (P < 0·05). † C and CP trials significantly different from before exercise (P < 0·05). ‡ Significant difference between the trials (P < 0·05). Values are means, with error bars representing standard deviations.

Subjective feelings
There were significant main effects of time for subjective feelings of thirst (P < 0·001), stomach fullness (P < 0·001), bloatedness (P < 0·001), hunger (P < 0·001), tiredness (P < 0·05), concentration (P < 0·01), head soreness (P < 0·01), dryness of mouth (P < 0·001), refreshness (P < 0·001) and energy (P < 0·001), but there were no main effects of trial (P>0·281) or any interaction effects (P>0·079) for any of the subjective feelings. Drink C was perceived as more salty (13 (range 4–63) mm (drink C) v. 4·5 (range 0–15) mm (drink CP) (P < 0·05)) and more bitter (12 (range 1–54) mm (drink C) v. 2 (range 0–12) mm (drink CP) (P < 0·05)) than drink CP. There was no difference in the perceived sweetness (66 (sd 17) mm (drink C) v. 64 (sd 6) mm (drink CP) (P = 0·836)) or pleasantness (68 (sd 26) mm (drink C) v. 61 (sd 23) mm (drink CP) (P = 0·584)) of the drinks.
Discussion
The results of this investigation demonstrate that following a 1·9 (sd 0·2) % reduction in body mass via intermittent exercise in a hot environment, a 40 g/l carbohydrate, 25 g/l milk protein solution was better retained than a 65 g/l carbohydrate solution, when a drink volume equivalent to 150 % of the exercise-induced body mass loss was ingested. The solutions were matched in terms of energy density and fat content, as well as in terms of Na and K concentrations, although solution osmolality was lower for drink CP (229 (sd 2)) than for drink C (247 (sd 1)) (P < 0·001).
At the end of the study, whole body net fluid balance was negative during both the trials, but only significantly so following ingestion of drink C, indicating that ingestion of a 65 g/l carbohydrate solution resulted in a significant fluid deficit at the end of the study ( − 0·52 (sd 0·30) litres), despite ingestion of a fluid volume equivalent to 150 % of body mass loss. The substitution of 25 g/l of the carbohydrate (maltodextrin) for 25 g/l of milk protein in the CP trial reduced the total volume of urine produced over the trial by 281 (sd 312) ml and meant that at the end of the study, the subjects' whole body net fluid balance was 0·26 (sd 0·29) litres less negative, and although still net negative ( − 0·26 (0·27) litres), it was not significantly different from pre-exercise (P = 0·168).
These findings emphasise the importance of drink composition in ensuring complete recovery of fluid balance after exercise-induced dehydration. While drinking a sufficient volume of fluid to replace that lost through sweating is vital to the overall rehydration process(Reference Shirreffs, Taylor and Leiper6), it is the composition of the ingested fluid that determines how much of the fluid is retained(Reference Maughan and Leiper7–Reference Evans, Shirreffs and Maughan10).
To our knowledge, this is the first study to specifically investigate the addition of protein to post-exercise rehydration solutions, matched in terms of energy density and electrolyte content. There is some evidence to suggest that the inclusion of protein in a post-exercise rehydration solution might increase the retention of the ingested solution(Reference Shirreffs, Watson and Maughan9, Reference Seifert, Harmon and DeClercq18, Reference Watson, Love and Maughan19). Shirreffs et al. (Reference Shirreffs, Watson and Maughan9) have previously demonstrated that after exercise-induced dehydration, low-fat milk was better retained than either a carbohydrate–electrolyte sports drink or water. Although the low-fat milk contained 36 g/l protein, which might have contributed to the increased fluid retention, the large number of compositional differences (energy density, macronutrient composition and electrolyte composition) between the low-fat milk and the carbohydrate–electrolyte sports drink used makes it difficult to elucidate the specific effects of the protein on fluid retention. The results of the present study suggest that at least some of the increased fluid retention observed with low-fat milk ingestion compared with that observed with a carbohydrate–electrolyte sports drink(Reference Shirreffs, Watson and Maughan9) is attributable to the milk protein. At the end of the study, the subjects were in net negative fluid balance ( − 0·26 (sd 0·27) litres) following ingestion of CP, but in the study of Shirreffs et al. (Reference Shirreffs, Watson and Maughan9), fluid balance was essentially neutral (+0·01 (sd 0·19) litres) after ingestion of low-fat milk in an identical experimental protocol. Compared with the CP drink in the present study, low-fat milk has a greater energy density (1480 v. 1145 kJ/l), carbohydrate content (50 v. 40 g/l), protein content (36 v. 25 g/l), fat content (3 v. 0·8 g/l), Na concentration (39 v. 7 mmol/l) and K concentration (45 v. 4 mmol/l)(Reference Shirreffs, Watson and Maughan9). Any of these compositional differences between the CP drink in the present study and low-fat milk might account for the more positive net fluid balance observed after ingestion of low-fat milk(Reference Shirreffs, Watson and Maughan9). Seifert et al. (Reference Seifert, Harmon and DeClercq18) examined the effects of protein addition to a rehydration solution, observing increased fluid retention with a commercially available carbohydrate–protein solution (60 g/l carbohydrate, 15 g/l protein) compared with that with a commercially available carbohydrate solution (60 g/l carbohydrate) and flavoured water, ingested in a volume equivalent to body mass loss. Fluid retention was approximately 0·27 litres greater after ingestion of the carbohydrate–protein solution than after ingestion of the carbohydrate solution, but as the solutions were not matched in terms of energy density, it is not possible to determine whether it was the addition of protein to the solution or the increased energy density that produced the increased fluid retention.
Although the present study suggests that there are some benefits of milk protein on the retention of fluid after exercise-induced dehydration, it is not possible to determine the mechanism by which milk protein ingestion increased fluid retention. The rate at which a carbohydrate solution empties from the stomach has been shown to be directly related to its energy density(Reference Vist and Maughan24, Reference Vist and Maughan25). While Calbert & Maclean(Reference Calbert and MacLean26) reported that the rate of gastric emptying of an ingested solution was directly related to its energy density and was not influenced by the macronutrient distribution, others have reported differences in gastric emptying rates of solutions of different macronutrient distribution(Reference Burn-Murdoch, Fisher and Hunt20, Reference Bowen, Noakes and Trenerry21) and even between solutions of different protein type(Reference Billeaud, Guillet and Sandler27, Reference Hall, Millward and Long28). Milk protein contains approximately 80 % casein that, in the presence of gastric acid in the stomach, clots(Reference Billeaud, Guillet and Sandler27) and results in a reduction in gastric emptying rate compared with other protein factions(Reference Billeaud, Guillet and Sandler27 )and glucose and/or lactose(Reference Burn-Murdoch, Fisher and Hunt20, Reference Bowen, Noakes and Trenerry21). Similarly, the rate of gastric emptying has been shown to be slower for milk protein than for whey protein(Reference Hall, Millward and Long28). Although not measured in the present investigation, it might be reasonable to speculate that the inclusion of milk protein in the CP drink resulted in clotting of the casein fraction of the milk protein in the presence of gastric acid(Reference Billeaud, Guillet and Sandler27). The formation of a clot probably reduced the rate at which the CP solution emptied from the stomach(Reference Burn-Murdoch, Fisher and Hunt20, Reference Bowen, Noakes and Trenerry21, Reference Billeaud, Guillet and Sandler27, Reference Hall, Millward and Long28), which as has been shown with high- v. low-concentration carbohydrate solutions, might have reduced the rate of influx of water into the circulation(Reference Evans, Shirreffs and Maughan22) and offset the reduction in serum osmolality that occurs with the ingestion of large volumes of dilute solutions(Reference Evans, Shirreffs and Maughan10, Reference Nose, Mack and Shi12, Reference Osterberg, Pallardy and Johnson17). Decreasing the rate of gastric emptying of a rehydration solution results in a reduced rate of water uptake into the circulation(Reference Evans, Shirreffs and Maughan22), which ultimately is likely to affect serum osmolality response following fluid ingestion. Linear regression analysis has shown that a change in plasma osmolality of 1 mosmol/kg will lead to a change in plasma arginine vasopressin concentration of 0·41 pmol/l(Reference Baylis29). Similarly, a change in plasma arginine vasopressin concentration of 1 pg/ml (resulting from a change in plasma osmolality of approximately 3 mosmol/kg) will lead to a change in urine osmolality of 250 mosmol/kg(Reference Robertson30). Consequently, any change in fluid uptake as a result of a change in the rate of gastric emptying could have a profound effect on fluid retention. Although serum osmolality was not measured in the present investigation, urine osmolality stayed reduced compared with baseline for 1 h longer during trial C than during trial CP and was also greater at 2 h and 3 h during trial CP than during trial C, suggesting that the ingested solutions might have affected serum osmolality response.
Although there was a significant difference in net fluid balance between the trials, this difference in absolute terms (0·26 (sd 0·29) litres) is relatively small, representing approximately 0·3 % of subjects' body mass. It is unlikely that a difference in net fluid balance of this magnitude would result in any difference in exercise performance between the trials. It is generally accepted that a level of hypohydration equivalent to approximately 2 % body mass is necessary before a reduction in endurance exercise performance is observed(Reference Cheuvront, Carter and Sawka31). Watson et al. (Reference Watson, Love and Maughan19) examined exercise capacity in the heat after exercise-induced dehydration and rehydration with 150 % sweat loss with either a low-fat milk or a carbohydrate–electrolyte sports drink. There was a tendency (P = 0·051) for a greater net fluid balance (approximately 0·4 % body mass) 3 h after rehydration following ingestion of low-fat milk, but this difference did not result in an increased exercise capacity in a hot, humid environment. The difference in net fluid balance between the trials in the present study was similar to that of Watson et al. (Reference Watson, Love and Maughan19), suggesting that it is unlikely that this difference in net fluid balance would result in any difference in exercise performance between the trials, even in hot, humid environmental conditions.
In conclusion, the results of the present investigation indicate that, when matched for energy density, fat content and electrolyte concentration, a carbohydrate–milk protein solution is better retained than a carbohydrate solution after exercise-induced dehydration, when a volume equivalent to 150 % body mass loss is ingested. This suggests that gram-for-gram, milk protein is more effective at augmenting fluid retention than carbohydrate. Although not determined during this investigation, it is likely that the success of the carbohydrate–milk protein solution at maintaining fluid balance is due to a reduced rate of gastric emptying and, therefore, overall fluid uptake, although further investigation should be conducted in order to determine this relationship.
Acknowledgements
The authors would like to thank Miss Becky Gingell for her assistance with data collection for the present study. The authors had no conflicts of interest, and this research received no specific grant from any funding agency in the public, commercial or not-for-profit sectors. L. J. J. conceived the study design. Data collection and analysis were conducted by D. C., L. J. J. and G. H. E., and the manuscript was written by L. J. J., with assistance from G. H. E. and D. C.



