





Introduction
Cystic echinococcosis (CE) is a zoonotic disease, caused by tapeworm parasites of the Echinococcus granulosus sensu lato (s.l.) species complex. In this complex, the species E. granulosus sensu stricto (s.s.) is geographically the most widespread and of the highest zoonotic importance, being the most common cause of human CE worldwide. Wide-scale analysis of human CE data has revealed that >80% are due to E. granulosus s.s., followed by genotypes G6/G7 (Alvarez Rojas et al., Reference Alvarez Rojas, Romig and Lightowlers2014; Casulli et al., Reference Casulli, Massolo, Saarma, Umhang, Santolamazza and Santoro2022). The highly zoonotic E. granulosus s.s. primarily affects people living in rural areas and leading a pastoral lifestyle that provides a favourable environment for its life cycle (Deplazes et al., Reference Deplazes, Rinaldi, Alvarez Rojas, Torgerson, Harandi, Romig, Antolova, Schurer, Lahmar, Cringoli, Magambo, Thompson and Jenkins2017; Romig et al., Reference Romig, Deplazes, Jenkins, Giraudoux, Massolo, Craig, Wassermann, Takahashi and de la Rue2017; Thompson, Reference Thompson2017). Its main definitive host is the dog, whereas sheep, cattle and buffalo dominate among intermediate hosts. Wild animals are less involved, depending on the region (Romig et al., Reference Romig, Deplazes, Jenkins, Giraudoux, Massolo, Craig, Wassermann, Takahashi and de la Rue2017; Romig and Wassermann, Reference Romig and Wassermann2024). Echinococcus granulosus s.s. is also significant for food safety. A recent multicentre study from the MEmE project (https://onehealthejp.eu/projects/emerging-threats/jrp-meme; OneHealth EJP framework) by Umhang et al. (Reference Umhang, Bastien, Cartet, Ahmad, van der Ark, Berg, Bonelli, Davidson, Deplazes, Deksne, Gargate, van der Giessen, Jamil, Jokelainen, Karamon, Mrad, Maksimov, Oudni-mrad, Muchaamba, Oksanen, Pepe, Poulle, Rinaldi, Samorek-pierog, Santolamazza, Santoro, Santucciu, Saarma, Schnyder, Villena, Wassermann, Casulli and Boue2025), involving 12 European countries, Tunisia and Pakistan, reported the presence of E. granulosus s.s. eggs in lettuce and berries. Regarding lettuce, the frequency of occurrence of E. granulosus s.s. ranged from 0% to 6·5% among European countries, whereas in Pakistan and Tunisia, it was 4% and 12%, respectively. Among berries, the highest frequency of occurrence of E. granulosus s.s. was reported for blueberries from Pakistan (12%) and for strawberries from Tunisia (81·3%).
Phylogenetic studies of the genus Echinococcus have demonstrated that E. granulosus s.s. forms a monophyletic clade and is a sister species to E. felidis (e.g., Saarma et al., Reference Saarma, Jõgisalu, Moks, Varcasia, Lavikainen, Oksanen, Simsek, Andresiuk, Denegri, González, Ferrer, Gárate, Rinaldi and Maravilla2009; Knapp et al., Reference Knapp, Nakao, Yanagida, Okamoto, Saarma, Lavikainen and Ito2011; Lymbery, Reference Lymbery2017). The intraspecific phylogenetic analysis based on mtDNA has revealed that E. granulosus s.s. is divided into 2 major clades, one comprising representatives of genotype G1 and the other of G3 (Kinkar et al., Reference Kinkar, Laurimäe, Sharbatkhori, Mirhendi, Kia, Ponce-Gordo, Andresiuk, Simsek, Lavikainen, Irshadullah, Umhang, Oudni-m’rad, Acosta-Jamett, Rehbein and Saarma2017). These genotypes can be confidently distinguished from each other by sequencing a fragment of the mtDNA nad5 gene (Kinkar et al., Reference Kinkar, Laurimäe, Acosta-Jamett, Andresiuk, Balkaya, Casulli, Gasser, González, Haag, Zait, Irshadullah, Jabbar, Jenkins, Manfredi, Mirhendi, M’rad, Rostami-Nejad, Oudni-M’rad, Pierangeli, Ponce-Gordo, Rehbein, Sharbatkhori, Kia, Simsek, Soriano, Sprong, Šnábel, Umhang, Varcasia and Saarma2018a). Both genotypes are further divided into multiple subclades (Kinkar et al., Reference Kinkar, Laurimäe, Acosta-Jamett, Andresiuk, Balkaya, Casulli, Gasser, van der Giessen, González, Haag, Zait, Irshadullah, Jabbar, Jenkins, Kia, Manfredi, Mirhendi, M’rad, Rostami-Nejad, Oudni-M’rad, Pierangeli, Ponce-Gordo, Rehbein, Sharbatkhori, Simsek, Soriano, Sprong, Šnábel, Umhang, Varcasia and Saarma2018b,c). However, nuclear DNA analysis revealed no subdivision, suggesting ongoing gene flow between G1 and G3 (Kinkar et al., Reference Kinkar, Laurimäe, Sharbatkhori, Mirhendi, Kia, Ponce-Gordo, Andresiuk, Simsek, Lavikainen, Irshadullah, Umhang, Oudni-m’rad, Acosta-Jamett, Rehbein and Saarma2017). The genotype G1 (formerly the ‘sheep strain’) has a global distribution and can infect a wide range of animals and humans. The geographical distribution of G3 (formerly the ‘buffalo strain’) and the number of host species are, according to current knowledge, not as wide as those of G1 (Kinkar et al., Reference Kinkar, Laurimäe, Balkaya, Casulli, Zait, Irshadullah, Sharbatkhori, Mirhendi, Rostami-Nejad, Ponce-Gordo, Rehbein, Kia, Simsek, Šnábel, Umhang, Varcasia and Saarma2018c). In recent years, sequencing a large portion of mitochondrial genomes has considerably improved our understanding of the phylogenetic relations of isolates of G1 and G3 from different regions worldwide (Kinkar et al., Reference Kinkar, Laurimäe, Simsek, Balkaya, Casulli, Manfredi, Ponce-Gordo, Varcasia, Lavikainen, Gonzále, Rehbein, Giessen, Sprong and Saarma2016, Reference Kinkar, Laurimäe, Sharbatkhori, Mirhendi, Kia, Ponce-Gordo, Andresiuk, Simsek, Lavikainen, Irshadullah, Umhang, Oudni-m’rad, Acosta-Jamett, Rehbein and Saarma2017, Reference Kinkar, Laurimäe, Acosta-Jamett, Andresiuk, Balkaya, Casulli, Gasser, González, Haag, Zait, Irshadullah, Jabbar, Jenkins, Manfredi, Mirhendi, M’rad, Rostami-Nejad, Oudni-M’rad, Pierangeli, Ponce-Gordo, Rehbein, Sharbatkhori, Kia, Simsek, Soriano, Sprong, Šnábel, Umhang, Varcasia and Saarma2018a, Reference Kinkar, Laurimäe, Acosta-Jamett, Andresiuk, Balkaya, Casulli, Gasser, van der Giessen, González, Haag, Zait, Irshadullah, Jabbar, Jenkins, Kia, Manfredi, Mirhendi, M’rad, Rostami-Nejad, Oudni-M’rad, Pierangeli, Ponce-Gordo, Rehbein, Sharbatkhori, Simsek, Soriano, Sprong, Šnábel, Umhang, Varcasia and Saarma2018b, Reference Kinkar, Laurimäe, Balkaya, Casulli, Zait, Irshadullah, Sharbatkhori, Mirhendi, Rostami-Nejad, Ponce-Gordo, Rehbein, Kia, Simsek, Šnábel, Umhang, Varcasia and Saarma2018c; Laurimäe et al., Reference Laurimäe, Kinkar, Andresiuk, Haag, Ponce-Gordo, Acosta-Jamett, Garate, Gonzalez and Saarma2016; Zhao et al., Reference Zhao, Gesang, Wan, Li, Qiangba, Danzeng, Basang, Renzhen, Yin, Gongsang, Cai, Pang, Wang, Asan, Zhang, Li and Chen2022; Saarma et al., Reference Saarma, Skirnisson, Björnsdottir, Laurimäe and Kinkar2023; Guo et al., Reference Guo, Cairen, Zhao, Aimulajiang, Tang, Wu, Yimingjiang, Wu, Mi and Wen2024). The complex phylogeographical structure emerging from these studies has suggested that much of the current distribution, especially of G1, has been shaped by animal trade. Long mtDNA sequences can be crucial for correct genotype identification (Laurimäe et al., Reference Laurimäe, Kinkar, Romig, Omer, Casulli, Umhang, Gasser, Jabbar, Sharbatkhori, Mirhendi, Ponce-Gordo, Lazzarini, Soriano, Varcasia, Rostami Nejad, Andresiuk, Maravilla, Gonzalez, Dybicz, Gawor, Šarkunas, Šnabel, Kuzmina and Saarma2018; Biedermann et al., Reference Biedermann, Laurimäe, Anijalg, Kamenetzky, Soriano, Pierangeli, Lazzarini, Umhang, Bold, Bayasgalan, Karamon, Samorek-pieórg, Simsek, Celik, Harandi, Nasibi, Mehmood, Chihai, Casulli and Saarma2025) and may help identify the origin of infection. For example, Kinkar et al. (Reference Kinkar, Laurimäe, Sharbatkhori, Mirhendi, Kia, Ponce-Gordo, Andresiuk, Simsek, Lavikainen, Irshadullah, Umhang, Oudni-m’rad, Acosta-Jamett, Rehbein and Saarma2017) described a case involving a G1 haplotype from Finland that clustered together with several other haplotypes from Algeria. As the isolate was from an Algerian patient living in Finland, it is highly likely that the geographical origin of the infection was Algeria.
In Armenia, 752 surgical cases of CE were reported during 2008–2022, with an annual average incidence of 2·7 per 100 000 individuals. The majority of infected people (58%) were from rural communities (Manukyan et al., Reference Manukyan, Danielyan, Gevorgyan, Sahakyan, Vanyan, Andreasyan and Melik-andreasyan2024). Molecular studies of the E. granulosus s.l. species complex in Armenia have been carried out since 2005, revealing E. granulosus s.s. as the dominant species in humans, sheep and cattle (Gevorgyan, Reference Gevorgyan2006; Gevorgyan et al., Reference Gevorgyan, Dinkel, Mackenstedt and Romig2006; Ebi et al., Reference Ebi, Gevorgyan, Wassermann and Romig2014). However, exact genotype identifications have been rare (Maksimov et al., Reference Maksimov, Bergmann, Wassermann, Romig, Gottstein, Casulli and Conraths2020).
In Türkiye, according to the Social Security Administration, in 2008–2012, a total of 32 261 CE patients received treatment and 12 556 underwent surgical intervention (Ok et al., Reference Ok, Kilimcioglu and Özkol2020). Other studies have confirmed that E. granulosus s.s. has dominated among human patients (Utuk et al., Reference Utuk, Simsek, Koroglu and McManus2008; Ergin et al., Reference Ergin, Saribas, Yuksel, Zengin, Midilli, Adas, Arikan, Aslan, Uysal, Caliskan, Oner, Kucukbasmaci, Kaygusuz, Torun and Kocazeybek2010; Simsek et al., Reference Simsek, Kaplan and Ozercan2011b; Eryildiz and Şakru, Reference Eryildiz and Şakru2012; Bakal et al., Reference Bakal, Simsek and Kazez2015; Orsten et al., Reference Orsten, Boufana, Ciftci, Akinci, Karaagaoglu, Ozkuyumcu, Casulli and Akhan2018; Akkas et al., Reference Akkaş, Özgökçe, Aydemir, Dündar and Ekici2023; Celik et al., Reference Celik, Selcuk, Kilinc, Kesik, Ahmed, Wang, Simsek and Cao2024; Yılmaz et al., Reference Yılmaz, Aydın, Akkaş, Aydın, Eren and Uslu2025). Among domestic animals, E. granulosus s.s. appears most common in sheep, cattle and dogs (e.g., Vural et al., Reference Vural, Baca, Gauci, Bagci, Gicik and Lightowlers2008; Borhani et al., Reference Borhani, Fathi, Darabi, Jalousian, Simsek, Ahmed, Kesik, Hosseini, Romig, Harandi and Mobedi2021). Moreover, in a recent study, 7 of 13 cysts from goats were identified as E. granulosus s.s. (Selcuk et al., Reference Selcuk, Celik, Celik, Celik, Ercan, Uslug, Tekin and Simsek2024). Celik et al. (Reference Celik, Selcuk, Kilinc, Kesik, Ahmed, Wang, Simsek and Cao2024) reported that out of 28 cattle samples, 26 were G1 and 2 were G3, and out of 31 sheep samples, 25 were G1 and 6 were G3. Of wild animals, E. granulosus s.s. has been reported in wild sheep (Ovis gmelinii anatolica) (Simsek and Eroksuz, Reference Simsek and Eroksuz2009), wild boar (Sus scrofa) (Kesik et al., Reference Kesik, Çelik, Kılınç, Karabulut, Çevik and Şimşek2021) and wolf (Canis lupus) (Akyuz et al., Reference Akyuz, Kirman, Guven, Balkaya and Avcioglu2024).
Although Armenia and Türkiye are neighbouring countries where CE has long been recognized as a significant public health concern, little is known about the genetic variation and phylogenetic relationships among E. granulosus s.s. isolates from these 2 countries. The aim of this study was to analyse the mitogenome diversity and phylogenetic relationships of G1 and G3 isolates from Armenia and Türkiye and reveal major phylogeographical migration routes in the region.
Materials and methods
Samples
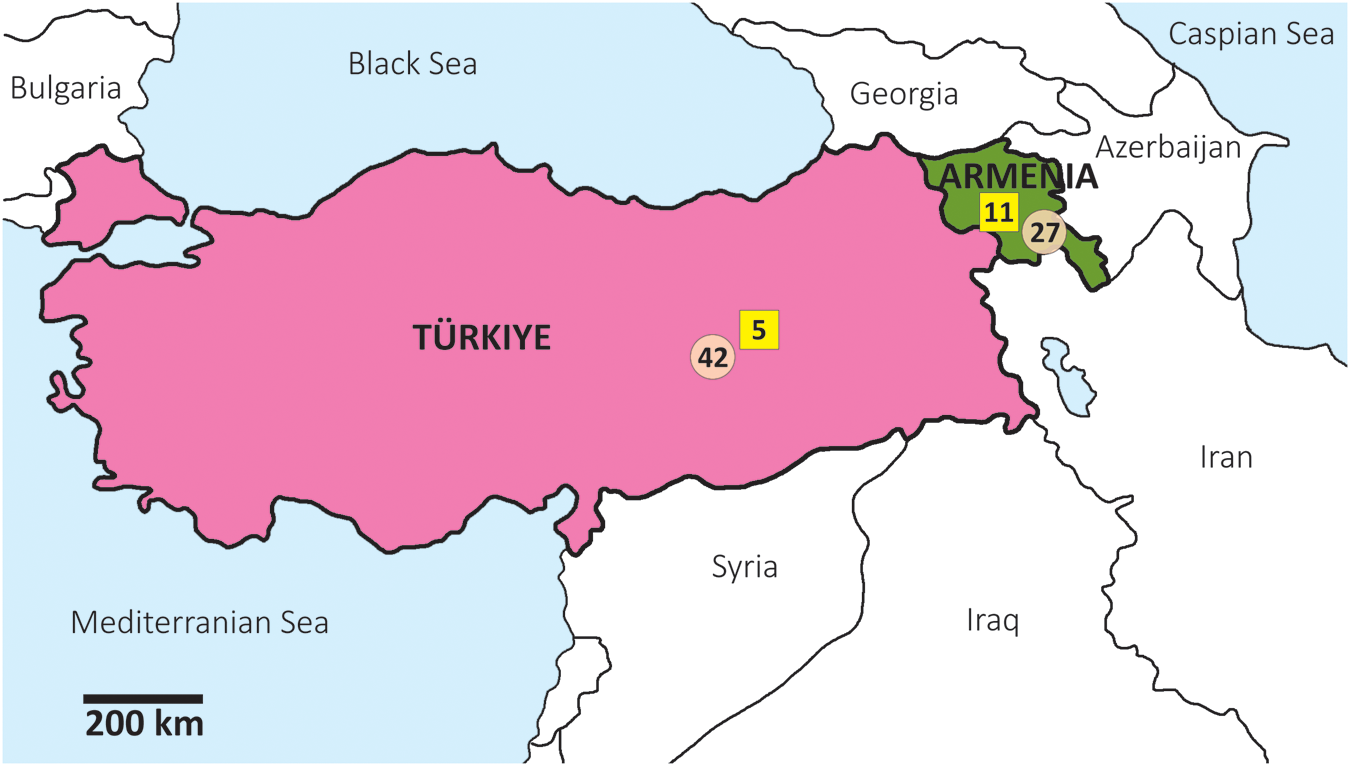
In this study, 85 parasite tissue samples (protoscoleces or cyst membranes) were analysed – 38 from Armenia and 47 from Türkiye (Figure 1; Table S1). From Armenia, 19 samples were from sheep, 8 from cattle and 11 from humans. From Türkiye, 23 samples were from sheep, 19 from cattle and 5 from humans.
Geographical locations of Echinococcus granulosus sensu stricto isolates from Armenia and Türkiye. The number of genotype G1 samples is represented in circles, and those of G3 in rectangles.

Figure 1 Long description
The map displays Türkiye and Armenia, highlighting the geographical locations of isolates. Türkiye is marked in pink and Armenia in green. Genotype G1 samples are represented by circles, with 42 samples in Türkiye and 11 in Armenia. Genotype G3 samples are represented by rectangles, with 5 samples in Türkiye and 27 in Armenia. The map includes surrounding regions such as the Black Sea, Mediterranean Sea and neighboring countries like Georgia, Azerbaijan, Iran, Syria and Iraq. A scale bar indicates a distance of 200 km.
DNA purification, PCR and sequencing
DNA was purified from protoscoleces or cyst membranes using the High Pure PCR Template Preparation Kit (Roche Diagnostics, Mannheim, Germany), following the manufacturer’s protocols. For PCR amplification, 12 primer pairs were used, yielding overlapping DNA fragments (Table S2). Initially, to assess sample quality and determine the genotype, the primer pair E11f–E11r was used. For samples that yielded high-quality sequences, the remaining 11 loci were then PCR amplified and sequenced. While most primer sequences have been published earlier (Kinkar et al., Reference Kinkar, Laurimäe, Simsek, Balkaya, Casulli, Manfredi, Ponce-Gordo, Varcasia, Lavikainen, Gonzále, Rehbein, Giessen, Sprong and Saarma2016; Laurimäe et al., Reference Laurimäe, Kinkar, Romig, Omer, Casulli, Umhang, Gasser, Jabbar, Sharbatkhori, Mirhendi, Ponce-Gordo, Lazzarini, Soriano, Varcasia, Rostami Nejad, Andresiuk, Maravilla, Gonzalez, Dybicz, Gawor, Šarkunas, Šnabel, Kuzmina and Saarma2018), primers S7f and S11f are novel and were designed as additional sequencing primers. Note that primers E9f3–E9r3 reported in Laurimäe et al. (Reference Laurimäe, Kinkar, Romig, Omer, Casulli, Umhang, Gasser, Jabbar, Sharbatkhori, Mirhendi, Ponce-Gordo, Lazzarini, Soriano, Varcasia, Rostami Nejad, Andresiuk, Maravilla, Gonzalez, Dybicz, Gawor, Šarkunas, Šnabel, Kuzmina and Saarma2018) fail to amplify the target region in E. granulosus s.s. due to a large non-coding region reported in Kinkar et al. (Reference Kinkar, Korhonen, Cai, Gauci, Lightowlers, Saarma, Jenkins, Li, Li, Young and Gasser2019) and were therefore not used in this study.
PCR was performed in 20 µL comprising 1× BD Advantage 2 PCR buffer (BD Biosciences, Franklin Lakes, NJ, USA), 0·2 mM dNTP, 0·25 μM of each primer, 1 U of Advantage 2 Polymerase mix (BD Biosciences) and 10–100 ng of template DNA. Negative controls were always included. PCR cycling conditions were: 95 °C for 1 min, followed by 10 cycles of 95 °C for 20 s, 55 °C for 45 s (annealing temperature reduced by −0·5 °C per cycle) and 68 °C for 2 min; followed by 25 cycles of 95 °C for 20 s, 50 °C for 45 s, 68 °C for 2 min; and with a final extension at 68 °C for 3 min. Of the PCR product, 10 µL was examined on a 1% agarose gel in 1× TAE buffer, and for sequencing, 10 µL was purified with FastAP/Exonuclease I (both 1 unit; Thermo Fisher Scientific, Waltham, MA, USA) by incubating at 37 °C for 30 min and then inactivating the enzymes at 80 °C for 15 min. Sequencing was performed at the Core Facility at the Institute of Genomics (University of Tartu, Estonia), using the same set of primers as for the initial PCR, and 2 additional primers S7f and S11f (Table S2), to cover sequence gaps. Both forward and reverse strands were sequenced.
Sequences were assembled using CodonCode v8.0.2, and chromatograms were inspected visually and corrected where necessary. Sequences were manually edited and aligned in BioEdit v7.2.5 (Hall, Reference Hall1999). All sequences were deposited in the GenBank database and are available under accession numbers PX908801-PX908869 (G1) and PZ091242-PZ091257 (G3) (Table S1).
Phylogenetic analyses
To evaluate the phylogenetic position of the G1 and G3 haplotypes from Armenia and Türkiye in a global context, previously published sequences of G1 and G3 were retrieved from GenBank. For phylogenetic analyses, the following datasets were used:
(1) Dataset 1: ‘Armenia and Türkiye of this study.’ G1 and G3 samples from Armenia (n = 38) and Türkiye (n = 47) from this study, total n = 85;
(2) Dataset 2: ‘Global G1.’ G1 samples from Armenia (n = 26) and Türkiye (n = 43) of this study, along with 211 sequences of G1 from Kinkar et al. (Reference Kinkar, Laurimäe, Acosta-Jamett, Andresiuk, Balkaya, Casulli, Gasser, van der Giessen, González, Haag, Zait, Irshadullah, Jabbar, Jenkins, Kia, Manfredi, Mirhendi, M’rad, Rostami-Nejad, Oudni-M’rad, Pierangeli, Ponce-Gordo, Rehbein, Sharbatkhori, Simsek, Soriano, Sprong, Šnábel, Umhang, Varcasia and Saarma2018b), total n = 280;
(3) Dataset 3: ‘Global G3.’ G3 samples from Armenia (n = 12) and Türkiye (n = 4) of this study, along with 39 G3 sequences from Kinkar et al. (Reference Kinkar, Laurimäe, Balkaya, Casulli, Zait, Irshadullah, Sharbatkhori, Mirhendi, Rostami-Nejad, Ponce-Gordo, Rehbein, Kia, Simsek, Šnábel, Umhang, Varcasia and Saarma2018c), total n = 55.
Alignment was performed with MAFFT online version (Katoh et al., Reference Katoh, Rozewicki and Yamada2019). Median-joining networks were constructed using the program Network v.10.1.00, with both indels and point mutations considered (Bandelt et al., Reference Bandelt, Forster and Rohl1999; http://www.fluxus-engineering.com, Fluxus Technology Ltd., 2004).
For Bayesian phylogenetic tree inference, the best-fit model of sequence evolution was estimated with PartitionFinder v2.1.1 (Guindon et al., Reference Guindon, Dufayard, Lefort, Anisimova, Hordijk and Gascuel2010; Lanfear et al., Reference Lanfear, Calcott, Ho and Guindon2012, Reference Lanfear, Frandsen, Wright, Senfeld and Calcott2016). Program BEAUti v1.8.4 was used to generate xml files used subsequently for BEAST 1.8.4 (Drummond et al., Reference Drummond, Suchard, Xie and Rambaut2012) to infer the phylogenetic trees. The exponential growth coalescent prior and a strict molecular clock were applied, given the intraspecific nature of the data (Drummond and Bouckaert, Reference Drummond and Bouckaert2015). The Markov Chain Monte Carlo chains were run for 10 million states, sampled every 1000 states, and 10% burn-in was discarded. Log files were analysed using the program Tracer v1.6 (Rambaut et al., Reference Rambaut, Suchard, Xie and Drummond2014). Phylogenetic trees were produced in TreeAnnotator v1.8.4 and visualized in FigTree v.1.4.3 (Rambaut, Reference Rambaut2014).
Population indices
For the analysis of population indices, the same 3 datasets were used as described above for the phylogenetic analyses. The number of haplotypes, haplotype diversity, nucleotide diversity and Tajima’s D (Tajima, Reference Tajima1989) were calculated using DnaSP v6.12.03 (Rozas et al., Reference Rozas, Ferrer-mata, Sánchez-delbarrio, Guirao-rico, Librado, Ramos-onsins and Sánchez-gracia2017). Haplotype diversity is the probability that 2 randomly sampled haplotypes are different. Nucleotide diversity is the average number of nucleotide differences per site between 2 randomly chosen DNA sequences. Tajima’s D tests whether the observed pattern of polymorphism in a set of DNA sequences is consistent with a neutral model of evolution.
Bayesian phylogeographical analysis
The Bayesian discrete phylogeographical approach was used to analyse phylogeographical diffusion (migration) directions (Lemey et al., Reference Lemey, Rambaut, Drummond and Suchard2009). This method allows for revealing ancestral locations from the provided set of samples and their locations and annotates the discrete location states to tree nodes. The analysis was performed essentially as described in Kinkar et al. (Reference Kinkar, Laurimäe, Acosta-Jamett, Andresiuk, Balkaya, Casulli, Gasser, van der Giessen, González, Haag, Zait, Irshadullah, Jabbar, Jenkins, Kia, Manfredi, Mirhendi, M’rad, Rostami-Nejad, Oudni-M’rad, Pierangeli, Ponce-Gordo, Rehbein, Sharbatkhori, Simsek, Soriano, Sprong, Šnábel, Umhang, Varcasia and Saarma2018b). Three independent runs were performed, and highly significant routes ((Bayesian factor)BF > 1000) were displayed.
Results
Genotype identification and genotype ratios
Of the 38 isolates from Armenia, 26 were identified as E. granulosus s.s. genotype G1 (14 from sheep, 6 cattle, 6 humans) and 12 as genotype G3 (5 sheep, 2 cattle, 5 humans) (Table S1). Of the 47 samples from Türkiye, 43 were identified as G1 (21 sheep, 18 cattle, 4 humans) and 4 as G3 (2 sheep, 1 cattle, 1 human). Among the analysed Armenian samples, the overall G1:G3 ratio was close to 2:1 (26/12), whereas among samples from Türkiye, the ratio was nearly 11:1 (43/4). In Armenia, G1:G3 ratios for humans and animals were 6:5 and 3:1, respectively, whereas in Türkiye, the respective ratios were 4:1 and 13:1.
Phylogenetic relations of G1 and G3 isolates from Armenia and Türkiye
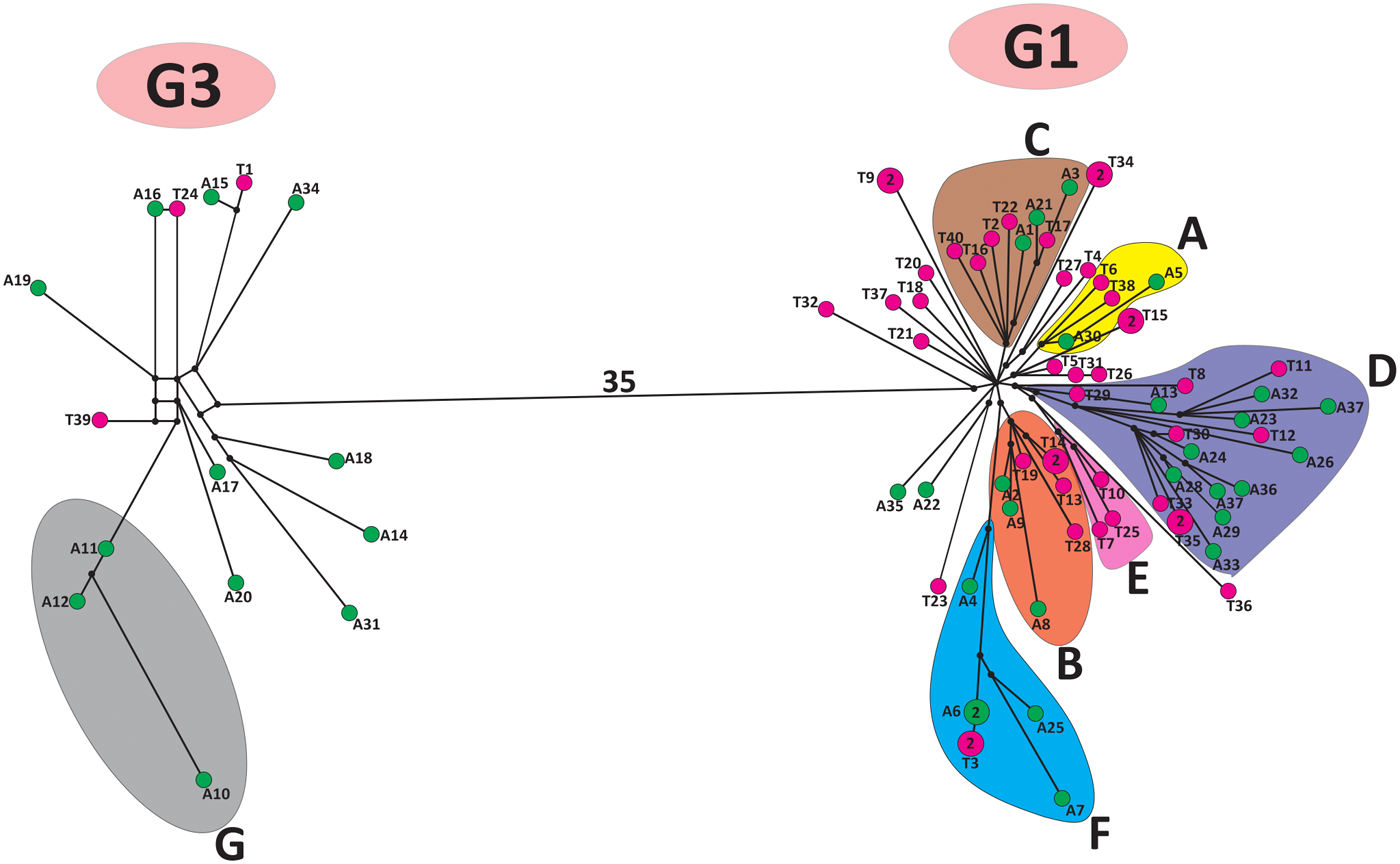
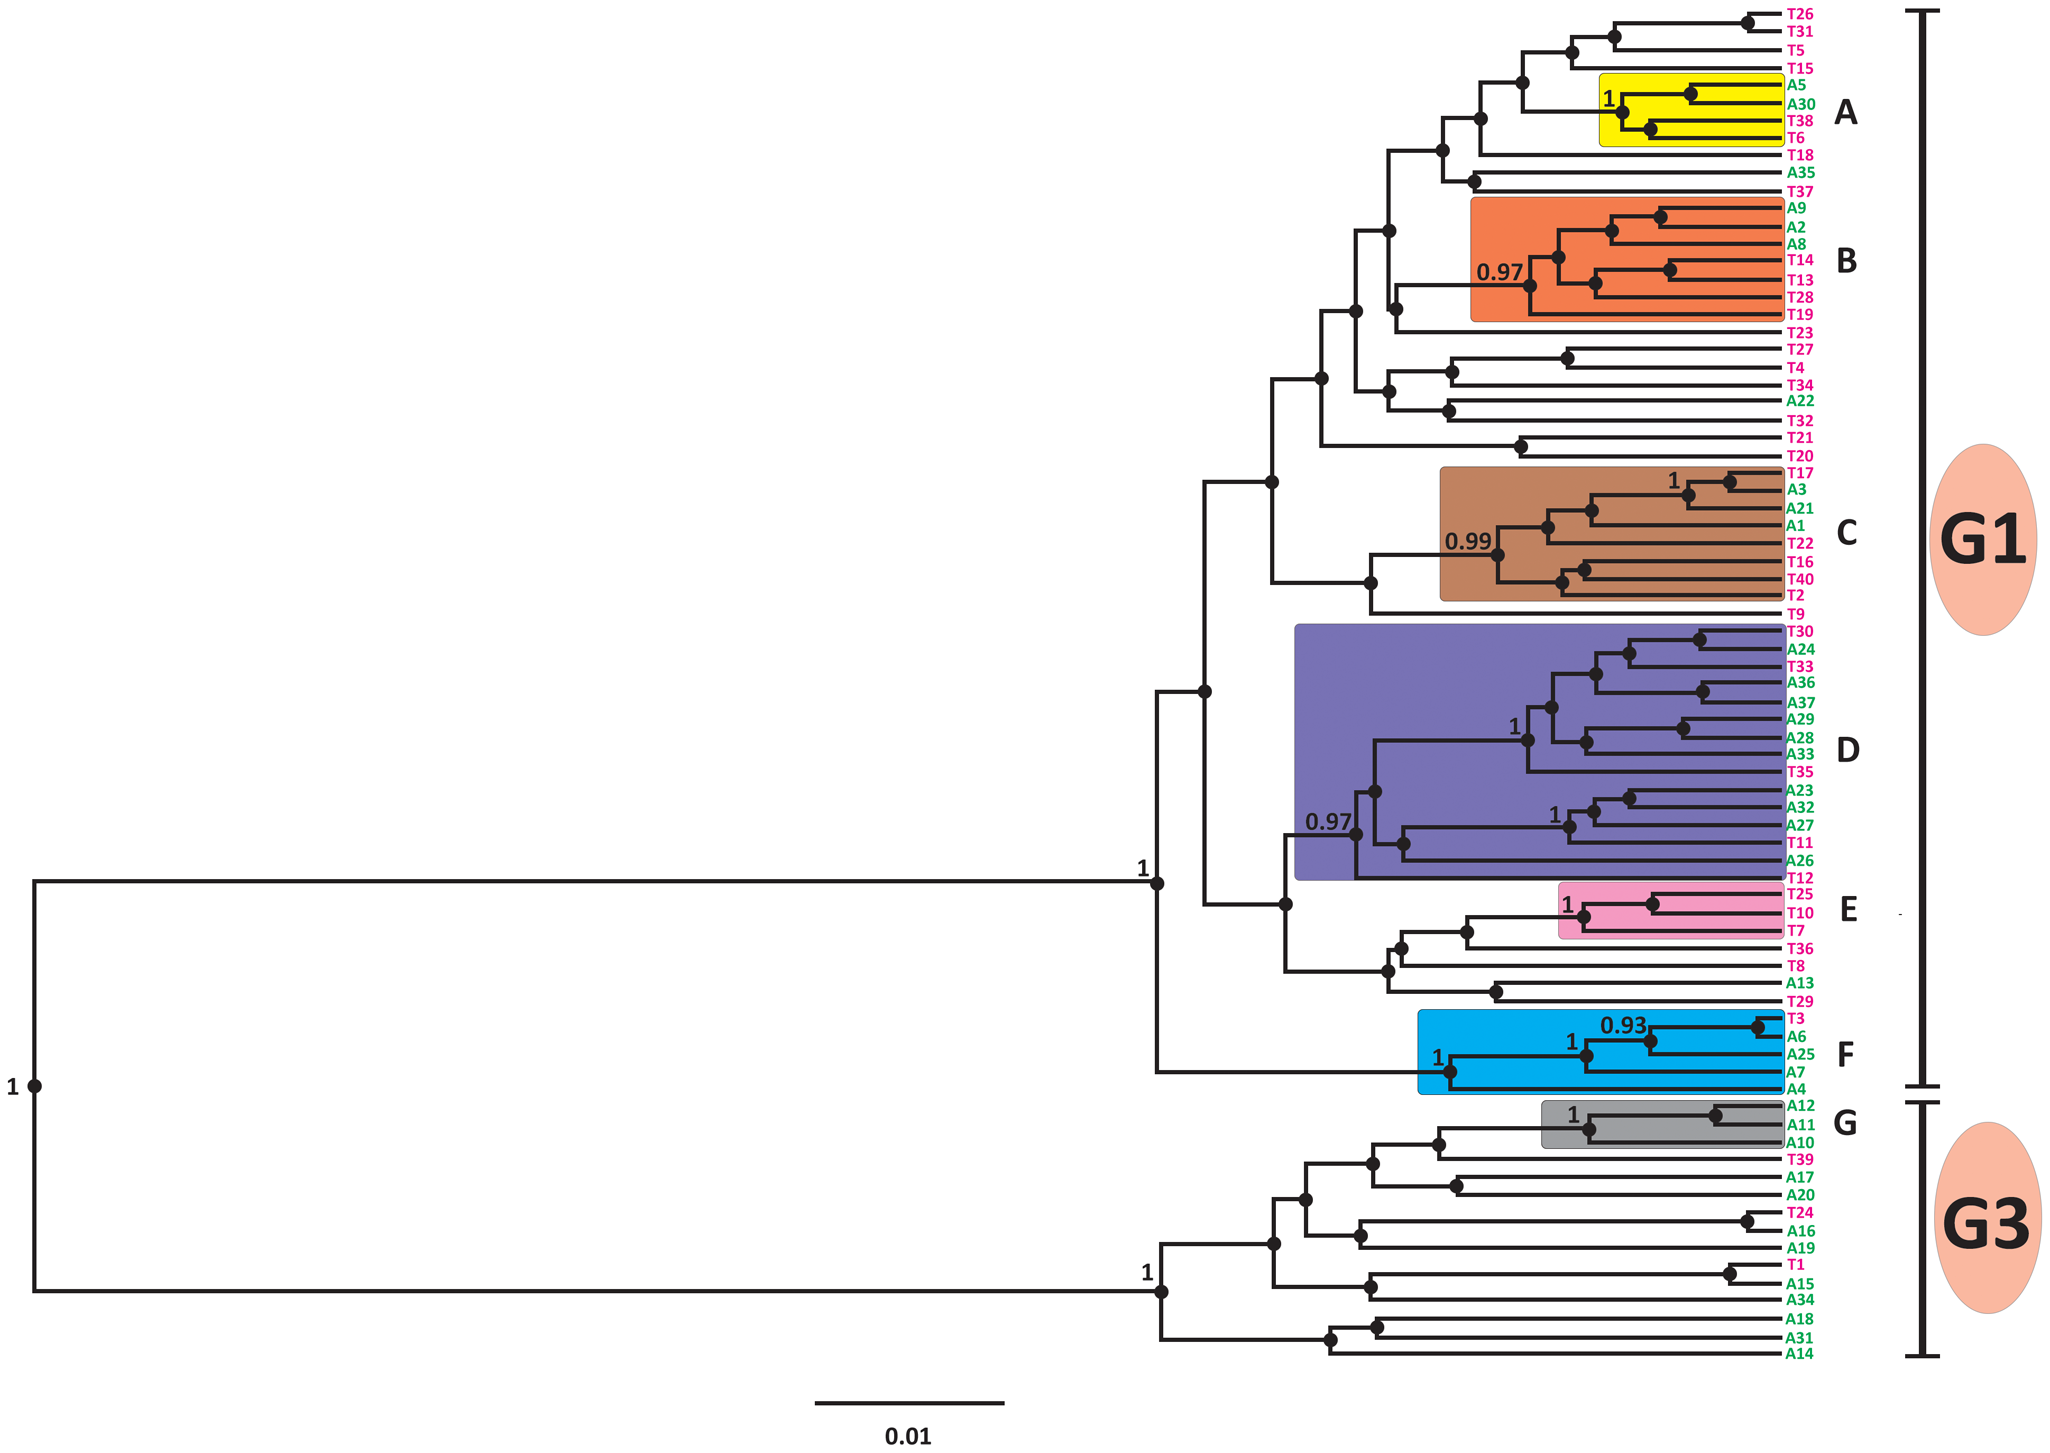
Analysis with all 12 primer pairs (Table S2) yielded a 12 319 bp sequence alignment (note that the complete mitogenome of G1 exceeds 17 kb; Kinkar et al., Reference Kinkar, Korhonen, Cai, Gauci, Lightowlers, Saarma, Jenkins, Li, Li, Young and Gasser2019). The median-joining phylogenetic analysis, based on the alignment of 85 sequences from Armenia and Türkiye (Dataset 1), produced a network with 2 major clades, one comprising sequences of G1 and the other of G3 (Figure 2). The division into G1 and G3 received maximum posterior probability value (1·00) by the Bayesian phylogenetic inference (Figure 3). The Bayesian analysis revealed 6 highly supported subclades of G1 (A–F in Figure 3) and 1 of G3 (subclade G), with the posterior probability values 0·97 or higher. Most subclades included haplotypes from both Armenia and Türkiye, except for the G1 subclade E, which comprises solely isolates from Türkiye (n = 3), and the G3 subclade G, which included samples only from Armenia (n = 3). The genetic diversity of G1 and G3 was very high. The vast majority of analysed isolates had a unique mtDNA sequence (Figure 2).
Median-joining network of Echinococcus granulosus sensu stricto G1 and G3 isolates from Armenia and Türkiye from this study (n = 85), based on 11 675 bp of mitochondrial genome sequences. The number of mutations between genotypes is depicted above the line. Haplotypes from Armenia are in green, and those from Türkiye are in purple (T: haplotypes of this study; TUR: haplotypes from previous studies). Haplogroups with very high support in the Bayesian phylogeny (see Figure 3) are circled and coloured differently. Small black dots are median vectors (i.e., Haplotypes not sampled or extinct).

Figure 2 Long description
The diagram represents a median-joining network of G1 and G3 isolates from Armenia and Türkiye, based on mitochondrial genome sequences. It features two main clusters labeled G1 and G3. The G3 cluster includes nodes representing haplotypes, connected by lines indicating mutational steps. A shaded region labeled G encompasses several nodes. The G1 cluster contains multiple subgroups labeled A, B, C, D, E and F, each enclosed in different shaded regions. Nodes within these subgroups represent haplotypes, connected by lines showing mutational relationships. A long line labeled 35 connects the G1 and G3 clusters, indicating the number of mutations between them. Small black dots represent median vectors, indicating unsampled or extinct haplotypes. The diagram does not use axes or units, focusing instead on genetic relationships and subgroup classifications.
Bayesian phylogenetic tree of Echinococcus granulosus sensu stricto G1 and G3 isolates from Armenia and Türkiye, based on 11 675 bp of mitochondrial genome sequences (n = 85). Haplotypes from Armenia are in green, and those from Türkiye are in purple (T: haplotypes of this study; TUR: haplotypes from previous studies). Haplogroups with high posterior probability values (>0·95) are depicted in rectangles with different colours.

Figure 3 Long description
The diagram is a Bayesian phylogenetic tree with a vertical orientation, depicting the evolutionary relationships of G1 and G3 isolates. The tree is divided into two main clades labeled G1 and G3, with G1 on the top and G3 on the bottom. Each clade is further divided into subclades labeled A to G. Subclades A, B, C, D and F are part of G1, while subclade G belongs to G3. The branches are horizontal and connect various nodes, representing evolutionary events. Haplotypes from Armenia are marked in green and those from Türkiye are marked in purple. Posterior probability values are indicated on the branches, with values greater than 0.95 highlighted within colored rectangles. The scale bar at the bottom represents genetic distance, marked as 0.01. The tree shows high genetic diversity among the isolates, with unique mitochondrial DNA sequences for most. The division into G1 and G3 clades is supported by a maximum posterior probability value of 1.00.
Diversity and neutrality indices
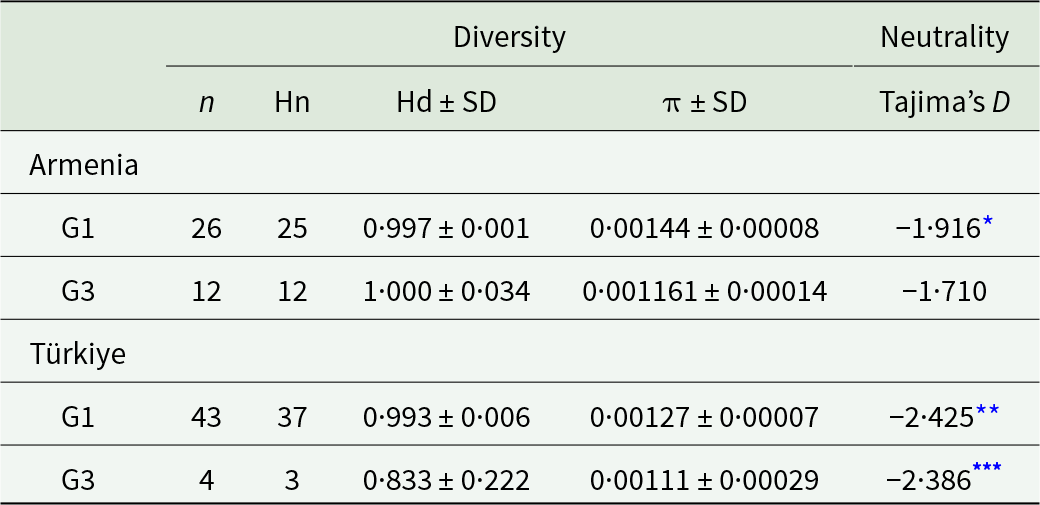
Samples with genotypes G1 and G3 from Armenia, and G1 from Türkiye exhibited high haplotype diversity values (Hd > 0·99), whereas G3 samples from Türkiye had a somewhat lower value (Hd = 0·83). The Tajima’s D neutrality indices were negative and statistically significant for G1 from Armenia and Türkiye, and G3 from Türkiye, suggesting rapid radiation (Table 1).
Diversity and neutrality indices for Echinococcus granulosus sensu stricto genotypes G1 and G3 from Armenia and Türkiye, based on analysis of mitochondrial DNA (11 675 bp)

Table 1 Long description
The table reports sample size, number of haplotypes, haplotype diversity with standard deviation, nucleotide diversity with standard deviation, and Tajima’s D for genotypes G1 and G3 in Armenia and Türkiye using mitochondrial DNA sequence data. Armenia G1 has 26 samples and 25 haplotypes with haplotype diversity 0.997 and nucleotide diversity 0.00144; Tajima’s D is negative at about minus 1.916. Armenia G3 has 12 samples and 12 haplotypes with haplotype diversity 1.000 and nucleotide diversity 0.001161; Tajima’s D is about minus 1.710. Türkiye G1 has 43 samples and 37 haplotypes with haplotype diversity 0.993 and nucleotide diversity 0.00127; Tajima’s D is about minus 2.425 and is marked as statistically significant. Türkiye G3 has 4 samples and 3 haplotypes with haplotype diversity 0.833 and nucleotide diversity 0.00111; Tajima’s D is about minus 2.386 and is marked as highly significant. Overall, haplotype diversity is very high in Armenia for both genotypes and in Türkiye for G1, but notably lower for Türkiye G3, and all Tajima’s D values are negative, with the most negative values in Türkiye. Comparisons involving Türkiye G3 should be interpreted cautiously because the sample size is very small and the uncertainty is large.
n, number of samples; Hn, number of haplotypes; Hd, haplotype diversity; π, nucleotide diversity; SD, standard deviation.
* Significant P-value (P ≤ 0·05).
** Significant P-value (P ≤ 0·01).
*** Highly significant P-value (P ≤ 0·0001).
Phylogenetic relations of G1 and G3 isolates from Armenia and Türkiye at a global scale, and migration routes
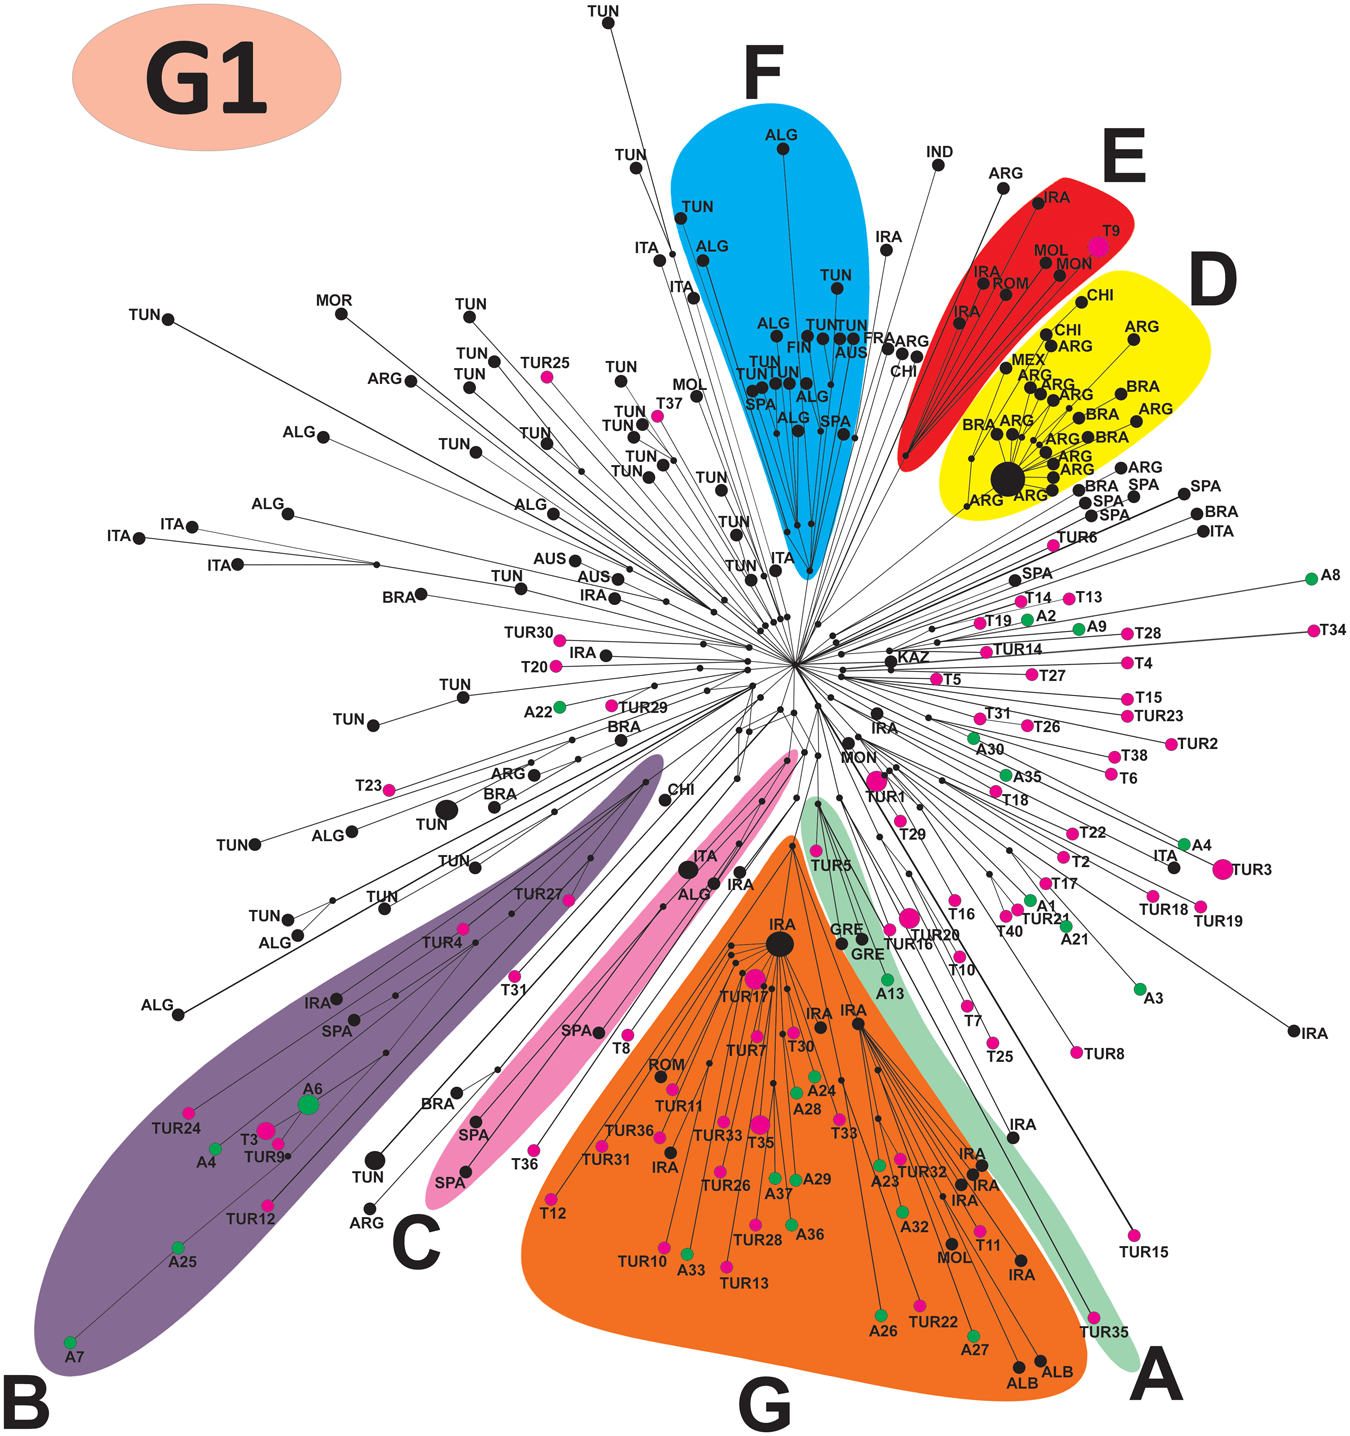
The global phylogenetic network of G1 based on Dataset 2 consisted of multiple haplogroups A–G (Figure 4), similar to that published in Kinkar et al. (Reference Kinkar, Laurimäe, Acosta-Jamett, Andresiuk, Balkaya, Casulli, Gasser, van der Giessen, González, Haag, Zait, Irshadullah, Jabbar, Jenkins, Kia, Manfredi, Mirhendi, M’rad, Rostami-Nejad, Oudni-M’rad, Pierangeli, Ponce-Gordo, Rehbein, Sharbatkhori, Simsek, Soriano, Sprong, Šnábel, Umhang, Varcasia and Saarma2018b). The haplotypes from Armenia and Türkiye in this study remained closely related and were distributed across multiple haplogroups. A relatively large haplogroup G comprised haplotypes from both Armenia and Türkiye, as well as representatives from geographically proximate Iran. Haplotypes of both Armenia and Türkiye were also present in haplogroups A and B, whereas a single haplotype from Türkiye clustered into haplogroup E, which also included haplotypes from Iran, Romania, Moldova and Mongolia. These haplogroups also had representatives originating from more distant countries, such as Albania, Romania, Greece, Moldova and Spain.
Global median-joining network of Echinococcus granulosus sensu stricto G1 isolates (total n = 280): from Armenia (n = 26) and Türkiye (n = 43) of this study, and 211 sequences of G1 from Kinkar et al. (Reference Kinkar, Laurimäe, Acosta-Jamett, Andresiuk, Balkaya, Casulli, Gasser, van der Giessen, González, Haag, Zait, Irshadullah, Jabbar, Jenkins, Kia, Manfredi, Mirhendi, M’rad, Rostami-Nejad, Oudni-M’rad, Pierangeli, Ponce-Gordo, Rehbein, Sharbatkhori, Simsek, Soriano, Sprong, Šnábel, Umhang, Varcasia and Saarma2018b). Haplotypes from Armenia (A) are in green, and those from Türkiye are in purple (T: haplotypes of this study; TUR: haplotypes from previous studies).

Figure 4 Long description
”The diagram is labeled G1 in the upper left corner. It displays a median-joining haplotype network of G1 isolates. The network contains multiple nodes connected by lines. Node size varies, with larger nodes indicating higher haplotype frequency or sample count. Lines connecting nodes represent mutational steps and hash marks on connecting lines indicate the number of mutational steps between haplotypes. Seven distinct haplogroups are visible, labeled A, B, C, D, E, F and G. Each haplogroup is enclosed in a shaded region. Haplogroup G is the largest cluster and occupies the lower central area of the network. It contains the greatest number of nodes, including haplotypes labeled with country codes such as ARM for Armenia, TUR for Turkiye and IRN for Iran. Haplogroup A is located in the lower right area and contains nodes labeled with multiple country codes. Haplogroup B is located in the left area and contains a smaller number of nodes. Haplogroup C is a narrow elongated cluster positioned between haplogroups B and G. Haplogroup D is located in the upper right and contains a dense grouping of nodes. Haplogroup E is adjacent to haplogroup D in the upper right area and includes nodes from multiple countries. Haplogroup F is positioned in the upper central.
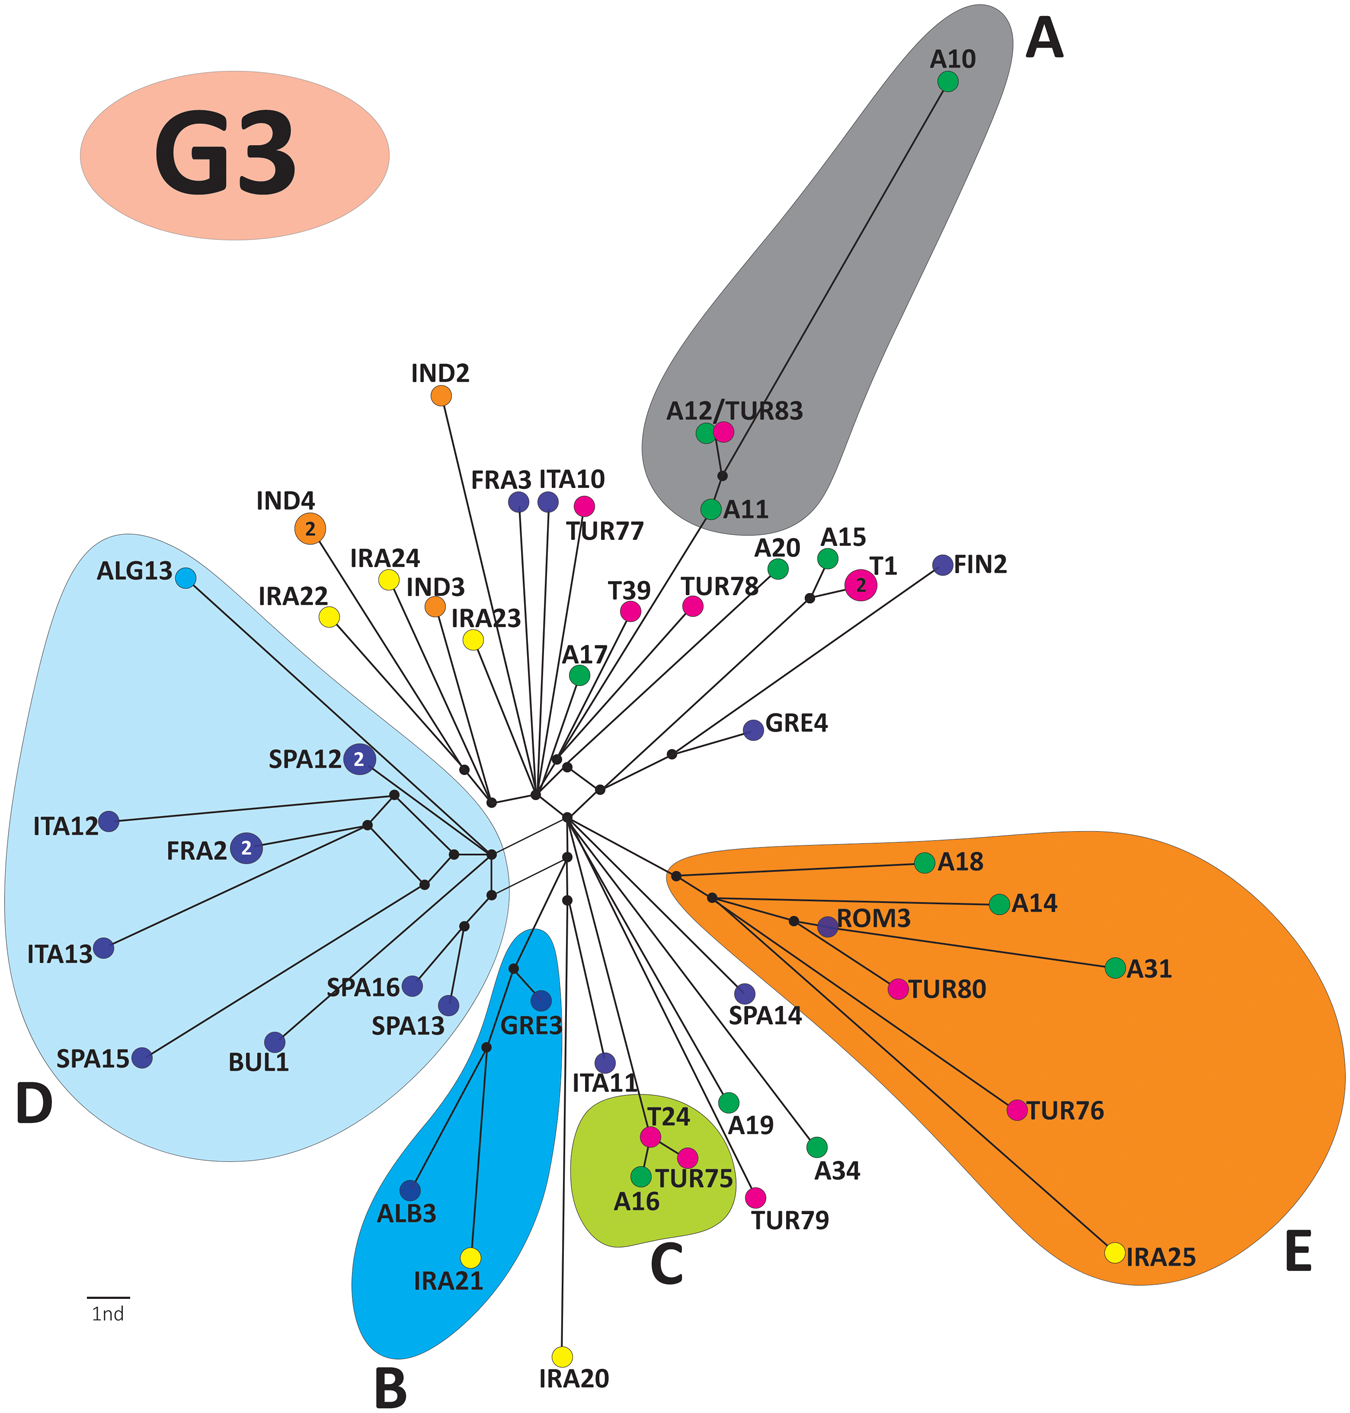
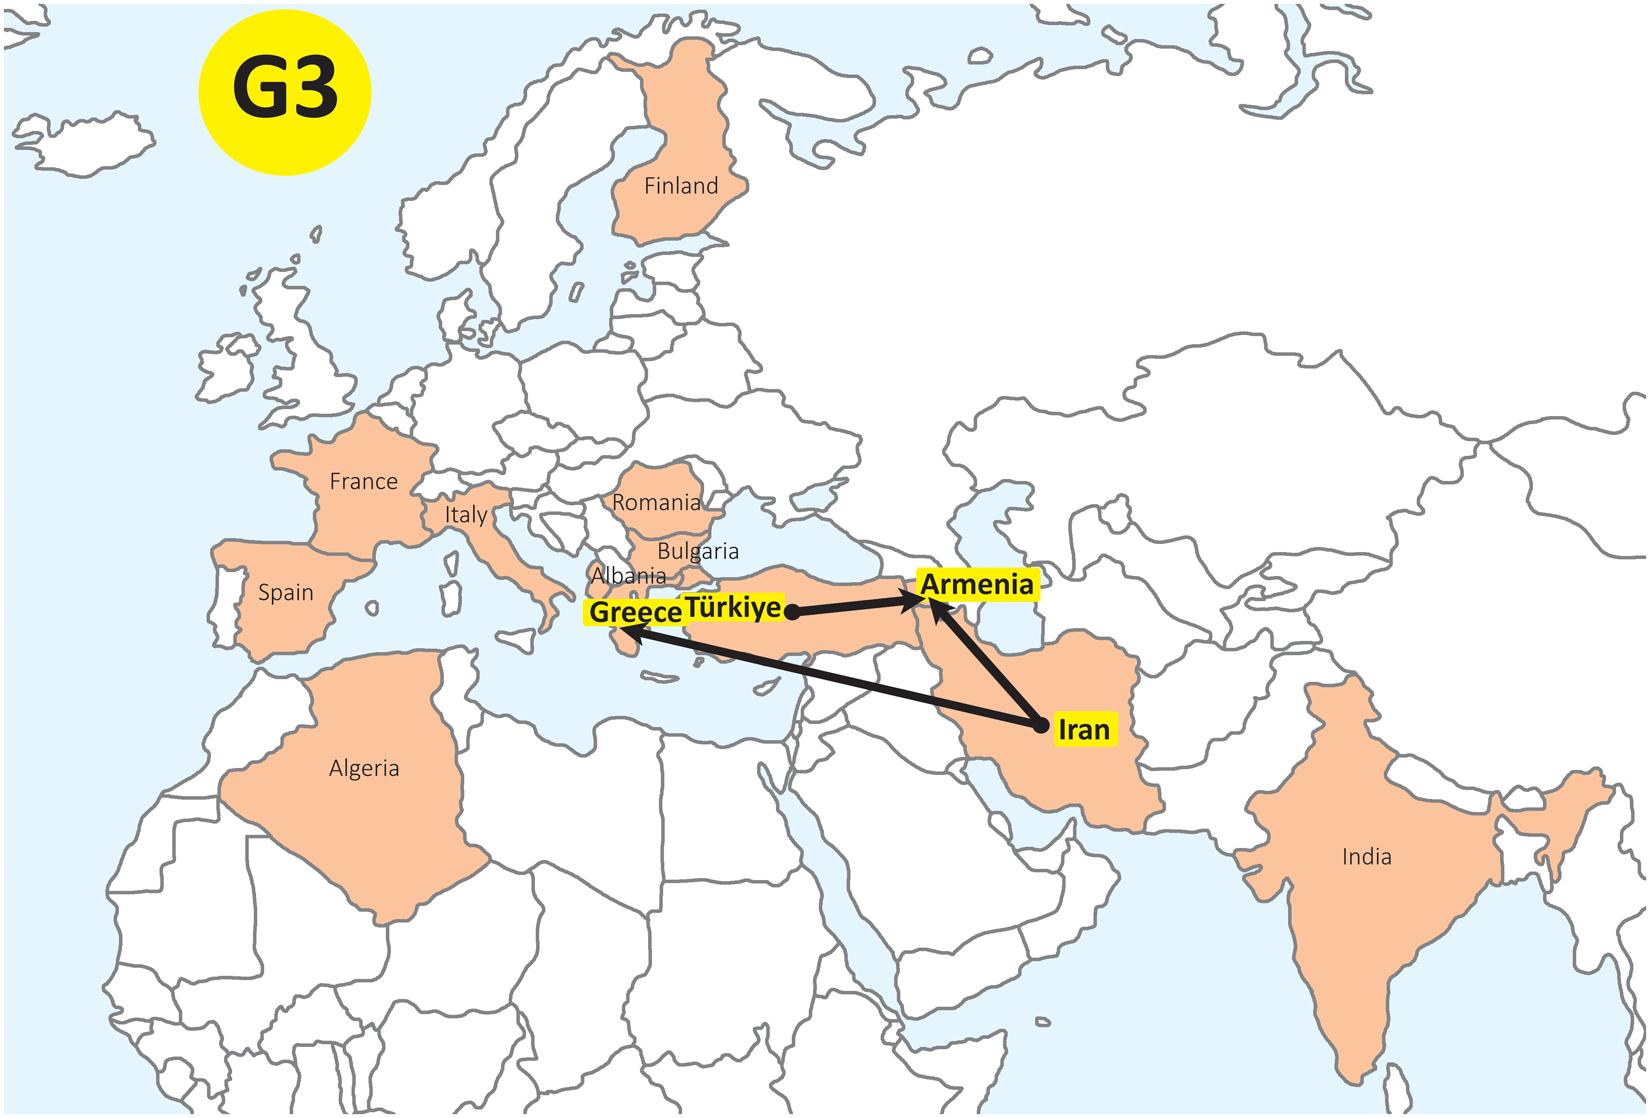
The global phylogenetic network of G3 (Dataset 3) comprised 5 well-supported haplogroups (A–E; Figure 5; see also Kinkar et al., Reference Kinkar, Laurimäe, Balkaya, Casulli, Zait, Irshadullah, Sharbatkhori, Mirhendi, Rostami-Nejad, Ponce-Gordo, Rehbein, Kia, Simsek, Šnábel, Umhang, Varcasia and Saarma2018c). Representatives of G3 from Armenia and Türkiye clustered into haplogroups A, C and E with representatives of other countries. However, haplogroups A and C contained isolates only from Armenia and Türkiye. The Bayesian phylogeographical analysis revealed several highly supported (BF > 1000) migration routes of G3 from Iran to Armenia, and from Türkiye to Armenia (Figure 6).
Global median-joining network of Echinococcus granulosus sensu stricto G3 isolates (total n = 55) from Armenia (n = 12) and Türkiye (n = 4) of this study, plus 39 G3 sequences from Kinkar et al. (Reference Kinkar, Laurimäe, Balkaya, Casulli, Zait, Irshadullah, Sharbatkhori, Mirhendi, Rostami-Nejad, Ponce-Gordo, Rehbein, Kia, Simsek, Šnábel, Umhang, Varcasia and Saarma2018c). The analysis is based on 11 675 bp of mitochondrial genome sequences. Haplotypes from Armenia are in green, and those from Türkiye are in purple (T: haplotypes of this study; TUR: haplotypes from previous studies).

Figure 5 Long description
The diagram is a phylogenetic network of G3 isolates, displaying five haplogroups labeled A to E. The network is centered with branches radiating outward to each haplogroup. Haplogroup A is shaded in gray and includes nodes such as A10, A11 and A12, with connections to TUR83 and other nodes. Haplogroup B is shaded in blue, containing nodes like ALG13, ITA12 and IRA20. Haplogroup C is shaded in green, featuring nodes TUR75 and A16. Haplogroup D is shaded in light blue, with nodes such as SPA16 and ITA19. Haplogroup E is shaded in orange, including nodes A18, ROM13 and IRA25. Each haplogroup is connected by lines indicating genetic relationships, with nodes marked by colored circles representing different geographic origins. The network visually represents the genetic diversity and relationships among the G3 isolates.
Major migration routes for Echinococcus granulosus sensu stricto genotype G3 isolates (n = 55), inferred from the Bayesian phylogeographical analysis. Black lines represent highly significant routes (BF > 1000). The analysis is based on samples from Armenia (n = 12) and Türkiye (n = 4) of this study, and 39 additional G3 sequences from 12 countries (Kinkar et al., Reference Kinkar, Laurimäe, Acosta-Jamett, Andresiuk, Balkaya, Casulli, Gasser, van der Giessen, González, Haag, Zait, Irshadullah, Jabbar, Jenkins, Kia, Manfredi, Mirhendi, M’rad, Rostami-Nejad, Oudni-M’rad, Pierangeli, Ponce-Gordo, Rehbein, Sharbatkhori, Simsek, Soriano, Sprong, Šnábel, Umhang, Varcasia and Saarma2018b).

Figure 6 Long description
A thematic regional map centered on Europe, the Mediterranean and western Asia, with north at the top. Text label: “G3” appears in a circular marker near the upper left. Highlighted areas: Several countries are filled to stand out from surrounding countries. These include Finland, France, Spain, Italy, Romania, Greece, Türkiye, Armenia, Iran, Algeria and India. Country labels visible on the map: Finland, France, Spain, Italy, Romania, Greece, Türkiye, Armenia, Iran, Algeria, India. Route symbols: Thick black lines connect labeled locations. The lines originate from the area labeled “Türkiye” and from the area labeled “Iran” and converge toward the area labeled “Armenia.” The lines are drawn with arrowheads indicating direction toward Armenia. Main connections shown: - Türkiye to Armenia. - Iran to Armenia.
Discussion
Echinococcus granulosus s.s. (G1/G3) appears to be the most abundant Echinococcus species infecting humans in Armenia and Türkiye. In this study, G1 was identified in 6 humans from Armenia and 4 from Türkiye, whereas G3 was found in 5 human patients in Armenia and 1 in Türkiye. In earlier studies involving human samples from Armenia and Türkiye, E. granulosus s.s. also prevailed (Gevorgyan et al., Reference Gevorgyan, Dinkel, Mackenstedt and Romig2006; Šnábel et al., Reference Šnábel, Altintas, D’amelio, Nakao, Romig, Yolasigmaz, Gunes, Turk, Busi, Hüttner, Ševcová, Ito, Altintas and Dubinský2009; Orsten et al., Reference Orsten, Boufana, Ciftci, Akinci, Karaagaoglu, Ozkuyumcu, Casulli and Akhan2018; Bakal et al., Reference Bakal, Celik, Simsek, Kesik and Kilinc2021; Hamamci et al., Reference Hamamci, Açıkgöz, Çetinkaya, Kılıç, Koçal, Karaaslan, Yetim and Yetim2023).
Note that based on the human samples analysed in this study, the G1:G3 ratio in Armenia was almost equal (6:5), suggesting that in terms of capability to infect humans, both G1 and G3 can be considered of high zoonotic importance. Although the ratio was 4:1 in favour of G1 in Türkiye, it seems to reflect the overall predominance of G1 in Türkiye, rather than the higher zoonotic potential of G1.
The highly different ratios of G1:G3 observed among all samples (humans and animals combined) analysed in this study from Armenia (2:1; 26/12) and Türkiye (11:1; 43/4) may indicate different historical migratory scenarios for G1 and G3. However, among samples published from Türkiye in earlier studies (Kinkar et al., Reference Kinkar, Laurimäe, Acosta-Jamett, Andresiuk, Balkaya, Casulli, Gasser, van der Giessen, González, Haag, Zait, Irshadullah, Jabbar, Jenkins, Kia, Manfredi, Mirhendi, M’rad, Rostami-Nejad, Oudni-M’rad, Pierangeli, Ponce-Gordo, Rehbein, Sharbatkhori, Simsek, Soriano, Sprong, Šnábel, Umhang, Varcasia and Saarma2018b, c), the ratio of G1:G3 was lower (5:1; 42/8). Combining the numbers of the current and earlier studies yielded the total ratio of G1:G3 in Türkiye 7:1 (85/12). Thus, the ratio in Türkiye is considerably more in favour of G1 than in Armenia. Interestingly, the Bayesian phylogeographical analysis revealed diffusion (migration) routes of G3 from Iran to Armenia, and from Türkiye to Armenia (Figure 6). In the present study, the G1:G3 ratio for the samples published previously from Iran was in favour of G1 by 4:1 (Kinkar et al., Reference Kinkar, Laurimäe, Acosta-Jamett, Andresiuk, Balkaya, Casulli, Gasser, van der Giessen, González, Haag, Zait, Irshadullah, Jabbar, Jenkins, Kia, Manfredi, Mirhendi, M’rad, Rostami-Nejad, Oudni-M’rad, Pierangeli, Ponce-Gordo, Rehbein, Sharbatkhori, Simsek, Soriano, Sprong, Šnábel, Umhang, Varcasia and Saarma2018b, c), which is somewhat higher than in Armenia (2:1), but not as high as in Türkiye (7:1). This suggests that Iran may have contributed more to the Armenian parasite population. Türkiye and Iran were part of an ancient domestication centre for ruminants (sheep, cattle and goats). Signs of domestication appeared around 12 000–11 000 years ago in the Fertile Crescent, which includes parts of contemporary Iraq, Iran, Syria and Türkiye (Zeder, Reference Zeder2025). Differences in the G1:G3 ratio could, at least partially, reflect the domestication and subsequent spread of ruminants infected with E. granulosus s.s. However, it is difficult to assess whether the differences in G1:G3 ratios can be attributed to historical or more recent processes, and to what extent to sampling. More samples and wider geographical coverage in this region are required to resolve this question.
Several haplogroups of G1 and G3, which all include haplotypes from both Armenia and Türkiye, also comprise haplotypes from other countries, such as Iran, Albania, Romania, Greece, Moldova and Spain (Figures 4 and 5). This close phylogenetic relationship is likely due to animal transportation/trade among countries of the former Ottoman Empire, which controlled much of West Asia, Southeast and Central Europe, and North Africa from the 14th to the early 20th centuries. The main migration routes of G3, as revealed in the Bayesian phylogeographical analysis, support the transportation/trade, as the highly supported diffusion routes were found from Türkiye to Armenia, from Iran to Armenia and from Iran to Greece. Thus, Iran and Türkiye appear to be the main G3 ‘donor’ countries for Armenia. However, we would like to emphasize that Bayesian phylogeographical analysis is sensitive to sampling and the results should be interpreted with caution. Therefore, the established diffusion routes, although highly supported, can be regarded as a hypothesis.
Genetic data is crucial for targeted surveillance and control efforts of E. granulosus s.l. Although short mtDNA sequences are often sufficient to identify the species and genotype of the parasite causing CE, long mitogenome sequences can provide more detailed information on the genetic variation of parasites, their phylogenetic relationships and migratory patterns in the region. As more such data accumulate and become available, the more potent the analytical power will grow. Moreover, the registration of CE and AE cases by national health systems should be improved in the future, as not all human cases are reported (Casulli et al., Reference Casulli, Abela-ridder, Petrone, Fabiani, Bobić, Carmena, Šoba, Zerem, Gargaté, Kuzmanovska, Calomfirescu, Rainova, Sotiraki, Lungu, Dezsényi, Ortiz, Karamon, Maksimov, Oksanen, Millon, Sviben, Shkjezi, Gjoni, Akshija, Saarma, Torgerson, Snabel, Antolova, Muhovic, Besim, Chereau, García, Chappuis, Gloor, Stoeckle, Müllhaupt, Manno, Santoro and Santolamazza2023) and a significant number of cases are merely reported as echinococcosis rather than identified as either CE or AE (Casulli et al., Reference Casulli, Abela, Petrone, Soba, Dezsényi, Karamon, Millon, Saarma, Antolová, Chappuis, Gloor, Stoeckle, Müllhaupt, Beck, Lagler, Lötsch, Auer, Hayette, Kolářová, Laivacuma, Šarkūnas, Sokolovas, Marcinkutė, Troell, Deibel, Jokelainen, Sulima, Krankowska, Roman, Joliat, Halkic, Bresson-hadni, Bednarek, Załęski, Paul, Yaqub, Jensenius, van der Giessen, Nabarro, Chiodini, Demonmerot, Knapp, Grüner, Kern, Peters, Santolamazza and Santoro2026).
As a future direction, analysing both the mitogenome and whole-genome nuclear data E. granulosus s.s. could provide crucial insights into genomic variation, population structure, selective pressures and potential drug targets across hosts and geographic regions, aided by the availability of high-quality, chromosome-scale reference genomes (Korhonen et al., Reference Korhonen, Kinkar, Young, Cai, Lightowlers, Gauci, Jabbar, Chang, Wang, Hofmann, Koehler, Li, Li, Wang, Yin, Yang, Jenkins, Saarma, Laurimäe, Rostami-Nejad, Irshadullah, Mirhendi, Sharbatkhori, Ponce-Gordo, Simsek, Casulli, Zait, Atoyan, de la Rue, Romig, Wassermann, Aghayan, Hasmik, Yang and Gasser2022).
Supplementary material
The supplementary material for this article can be found at https://doi.org/10.1017/S0031182026102170.
Data availability statement
The 11 675 bp mtDNA sequences of the E. granulosus s.s. G1 and G3 isolates are deposited in GenBank under accession numbers: G1 (PX908801-PX908869); G3 (PZ091242-PZ091257).
Author contributions
U.S.: study design, genetic and data analysis, original draft of the manuscript. MP, HA, LA, TL: genetic and data analysis. S.S., F.C., S.A.A., H.G., M.W., T.R: samples. US and AC: acquiring funding, project supervision. All authors critically reviewed the manuscript.
Financial support
The research has been financed by the Estonian Ministry of Education and Research, and the University of Tartu (grants PRG1209, TK215, and PLTOM25917), by funding from the European Union’s Horizon 2020 Research and Innovation programme under grant agreement No. 773830: One Health European Joint Programme (MEME project; https://onehealthejp.eu/jrp-meme/), and by the Higher Education and Science Committee of MESCR RA (Research project No. 23LCG-1F006).
Competing interests
The authors declare there are no conflicts of interest.
Ethical standards
Not applicable.


 Open access

