

Nationwide survey data permit estimation of water intake both as a nutrient (total water/moisture; see definitions in Table 1) and as a beverage (drinking water). The latter is of interest for a broad range of research. Nationally representative estimates of the intake of drinking water, combined with estimates of moisture intake from food and other beverages, were used in developing the Dietary Reference Intakes for total water for the USA and Canada( 1 ). In the literature, many studies consider drinking water in its role as a vehicle for water-borne nutrients, chemical contaminants and micro-organisms( Reference Ershow and Cantor 2 , Reference Mons, van der Wielen and Blokker 3 ); others focus on the benefits of consuming water rather than other beverages (e.g. reference ( Reference Stookey, Constant and Gardner 4 )).
Glossary of water terms used in the present paper
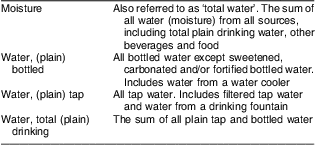
| Moisture | Also referred to as ‘total water’. The sum of all water (moisture) from all sources, including total plain drinking water, other beverages and food |
| Water, (plain) bottled | All bottled water except sweetened, carbonated and/or fortified bottled water. Includes water from a water cooler |
| Water, (plain) tap | All tap water. Includes filtered tap water and water from a drinking fountain |
| Water, total (plain) drinking | The sum of all plain tap and bottled water |
The US Department of Agriculture (USDA) and the US Department of Health and Human Services have a long history of collecting intake information on all types of water. The two Departments have partnered in dietary intake data collection since 2002, conducting the survey What We Eat in America (WWEIA) as the dietary intake interview component of the National Health and Nutrition Examination Survey (NHANES). The 24 h dietary recall method used in WWEIA is the USDA five-step Automated Multiple-Pass Method (AMPM)( Reference Moshfegh, Rhodes and Baer 5 ). The addition of the collection of drinking water intake data to the AMPM recall was initiated in WWEIA 2005–2006. Before 2005–2006, plain water intake data were collected after the 24 h recall via food-frequency type questions which asked the respondent to estimate the total amounts of tap and bottled water consumed the previous day. Based upon a comprehensive review of water consumption studies, an international panel concluded that a diary is the preferred method for collection of water intake data, but that if a diary is not feasible then a 24 h recall method – rather than an FFQ – is the best alternative for obtaining valid, complete water intake reports( Reference Mons, van der Wielen and Blokker 3 ).
Certain research questions require either comparing or combining data from multiple NHANES cycles. For example, trends analysis, by definition, compares variables of interest across time. The NHANES analytic guidelines strongly recommend that researchers who wish to analyse data for specific demographic sub-domains (e.g. by race/ethnicity within age/gender group) combine data from consecutive two-year cycles in order to produce estimates with greater statistical reliability( 6 ). Before performing analyses of these types, however, users are instructed to confirm that data items collected in all survey cycles included in the analysis are comparable in wording and methods. Because of the change in method, a comparison of the 2005–2006 estimates of drinking water intake with earlier estimates is of interest.
Although a few studies have analysed current US intake data collected using this new methodology( Reference Kant, Graubard and Atchison 7 – Reference Popkin 10 ), no study to date has reported intakes of total drinking, tap and bottled water for all age and gender groups.
The goals of the present study were twofold: for individuals aged ≥1 year, (i) to provide updated national estimates of total drinking, tap and bottled water collected in 2005–2006 using the AMPM; and (ii) to compare these estimates with estimates based on data collected in 2003–2004 using the old frequency-type questions.
Methods
Sample
Water intake estimates presented are based on data from 8437 individuals aged ≥1 year who provided one complete day of dietary recall data in WWEIA/NHANES 2005–2006( 11 ). Although more current data have become available (WWEIA/NHANES 2007–2008), the comparison of water estimates across survey cycles was carried out using the data sets immediately before and after the methodological change in order to minimize the effect of time on water consumption patterns. Earlier data used for comparisons are from 8249 individuals the same age interviewed in WWEIA/NHANES 2003–2004( 12 ).
The NHANES samples for both 2003–2004 and 2005–2006 were designed to be representative of the civilian, non-institutionalized US population, with oversampling of persons aged 12–19 years and ≥60 years, low-income persons, non-Hispanic blacks, Mexican Americans and pregnant women to improve accuracy of related estimates( 13 , 14 ). The data and accompanying documentation are available online for both surveys( 11 , 12 ). Breast-feeding children and pregnant and lactating females were excluded from all analyses.
Water intake data
In the present study, the term ‘total drinking water’ refers to the sum of tap water plus plain bottled water (i.e. bottled water without added sweetener or carbonation) that was consumed as a beverage. Water consumed as a component of another beverage or food (such as that contained in bottled drinks, used in brewing coffee or added when reconstituting condensed soup) is excluded.
Before and during WWEIA 2003–2004, intake information on tap and plain bottled water was collected after the 24 h recall, and information on sweetened water was collected during the 24 h recall( 12 , 15 ). In general, tap and plain bottled water questions resembled food-frequency questions in that the respondent was asked to give a single estimate of total consumption for the day (Table 2).
Drinking water questions and variables in What We Eat in America/National Health and Nutrition Examination Survey 2003–2004 and 2005–2006
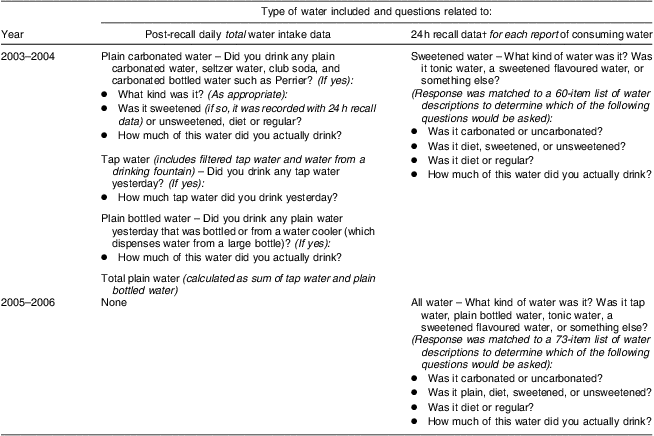
| Type of water included and questions related to: | ||
| Year | Post-recall daily total water intake data | 24 h recall data† for each report of consuming water |
| 2003–2004 | Plain carbonated water – Did you drink any plain carbonated water, seltzer water, club soda, and carbonated bottled water such as Perrier? (If yes): | Sweetened water – What kind of water was it? Was it tonic water, a sweetened flavoured water, or something else? |
| • What kind was it? (As appropriate): | (Response was matched to a 60-item list of water descriptions to determine which of the following questions would be asked): | |
| • Was it sweetened (if so, it was recorded with 24 h recall data) or unsweetened, diet or regular? | • Was it carbonated or uncarbonated? | |
| • How much of this water did you actually drink? | • Was it diet, sweetened, or unsweetened? | |
| Tap water (includes filtered tap water and water from a drinking fountain) – Did you drink any tap water yesterday? (If yes): | • Was it diet or regular? | |
| • How much tap water did you drink yesterday? | • How much of this water did you actually drink? | |
| Plain bottled water – Did you drink any plain water yesterday that was bottled or from a water cooler (which dispenses water from a large bottle)? (If yes): | ||
| • How much of this water did you actually drink? | ||
| Total plain water (calculated as sum of tap water and plain bottled water) | ||
| 2005–2006 | None | All water – What kind of water was it? Was it tap water, plain bottled water, tonic water, a sweetened flavoured water, or something else? |
| (Response was matched to a 73-item list of water descriptions to determine which of the following questions would be asked): | ||
| • Was it carbonated or uncarbonated? | ||
| • Was it plain, diet, sweetened, or unsweetened? | ||
| • Was it diet or regular? | ||
| • How much of this water did you actually drink? | ||
†In all survey years, for types of water collected during the 24 h recall, the interviewer asked for enough information to assign the appropriate USDA food code. Since 2002, the USDA Automated Multiple-Pass Method guides the interviewer through a detailed path of standardized probes that are specific to water (only sweetened water in 2002–2004; all types of water starting in 2005). In general, 24 h recall data include a USDA food code identifying the type of water consumed, the amount consumed, the amounts of nutrients provided, the time and name of the eating occasion, and whether the water was consumed in combination with other foods.
Starting in WWEIA 2005–2006, data on all types of water are collected during the 24 h recall in the same manner as for all other beverages and foods( Reference Moshfegh, Rhodes and Baer 5 , 11 , 16 ). Item-specific information (such as type, amount, time and name of eating occasion, etc.) that is obtained about foods and non-water beverages is now also captured for drinking water.
Statistical analyses
Analyses were carried out using the statistical software packages SAS release 9·1·3 (SAS Institute, Cary, NC, USA) and SUDAAN release 9·0 (Research Triangle Institute, Research Triangle Park, NC, USA). SUDAAN was used to adjust for survey design effects resulting from NHANES’ complex, multistage, probability sampling( 6 , 17 , 18 ).
Two-sided t tests were used to detect differences between 2003–2004 and 2005–2006 estimates for the following variables: (i) percentage of individuals reporting any plain water; (ii) mean intake of total plain water; (iii) percentages reporting specific water types (tap, bottled); and (iv) mean intake of each water type. Dietary sample weights were applied in all analyses to produce nationally representative estimates.
Results
The percentages of individuals reporting total drinking water, tap water and plain bottled water on any given day in 2003–2004 and 2005–2006 are shown in Table 3. In 2005–2006, 76·9 % of individuals aged ≥1 year in the USA reported drinking some water. For the all-inclusive group of individuals aged ≥1 year, all of the subgroups of males aged ≥14 years and females aged ≥71 years, percentages reporting total drinking water were significantly lower in 2005–2006 than in 2003–2004 (P < 0·0 0 1). In many of these age/gender groups, this decrease was driven by lower percentages reporting tap water in 2005–2006. The percentage of individuals reporting plain bottled water did not differ significantly between the two survey cycles.
Percentages reporting total plain drinking water, tap water and plain bottled water, individuals aged ≥1 year, What We Eat in America/National Health and Nutrition Examination Survey 2003–2004 and 2005–2006, 1 dayFootnote †
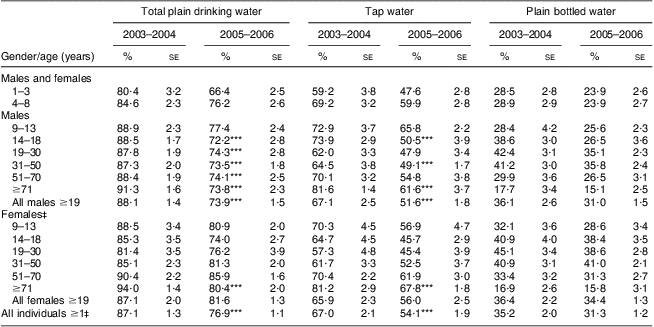
| Total plain drinking water | Tap water | Plain bottled water | ||||||||||
| 2003–2004 | 2005–2006 | 2003–2004 | 2005–2006 | 2003–2004 | 2005–2006 | |||||||
| Gender/age (years) | % | se | % | se | % | se | % | se | % | se | % | se |
| Males and females | ||||||||||||
| 1–3 | 80·4 | 3·2 | 66·4 | 2·5 | 59·2 | 3·8 | 47·6 | 2·8 | 28·5 | 2·8 | 23·9 | 2·6 |
| 4–8 | 84·6 | 2·3 | 76·2 | 2·6 | 69·2 | 3·2 | 59·9 | 2·8 | 28·9 | 2·9 | 23·9 | 2·7 |
| Males | ||||||||||||
| 9–13 | 88·9 | 2·3 | 77·4 | 2·4 | 72·9 | 3·7 | 65·8 | 2·2 | 28·4 | 4·2 | 25·6 | 2·3 |
| 14–18 | 88·5 | 1·7 | 72·2*** | 2·8 | 73·9 | 2·9 | 50·5*** | 3·9 | 38·6 | 3·0 | 26·5 | 3·6 |
| 19–30 | 87·8 | 1·9 | 74·3*** | 2·8 | 62·0 | 3·3 | 47·9 | 3·4 | 42·4 | 3·1 | 35·1 | 2·3 |
| 31–50 | 87·3 | 2·0 | 73·5*** | 1·8 | 64·5 | 3·8 | 49·1*** | 1·7 | 41·2 | 3·0 | 35·8 | 2·4 |
| 51–70 | 88·4 | 1·9 | 74·1*** | 2·5 | 70·1 | 3·2 | 54·8 | 3·8 | 29·9 | 3·6 | 26·5 | 3·1 |
| ≥71 | 91·3 | 1·6 | 73·8*** | 2·3 | 81·6 | 1·4 | 61·6*** | 3·7 | 17·7 | 3·4 | 15·1 | 2·5 |
| All males ≥19 | 88·1 | 1·4 | 73·9*** | 1·5 | 67·1 | 2·5 | 51·6*** | 1·8 | 36·1 | 2·6 | 31·0 | 1·5 |
| Females‡ | ||||||||||||
| 9–13 | 88·5 | 3·4 | 80·9 | 2·0 | 70·3 | 4·5 | 56·9 | 4·7 | 32·1 | 3·6 | 28·6 | 3·4 |
| 14–18 | 85·3 | 3·5 | 74·0 | 2·7 | 64·7 | 4·5 | 45·7 | 2·9 | 40·9 | 4·0 | 38·4 | 3·5 |
| 19–30 | 81·4 | 3·5 | 76·2 | 3·9 | 57·3 | 4·8 | 45·4 | 3·9 | 45·1 | 3·4 | 38·6 | 2·8 |
| 31–50 | 85·1 | 2·3 | 81·3 | 2·0 | 61·7 | 3·3 | 52·5 | 3·7 | 40·9 | 3·1 | 41·0 | 2·1 |
| 51–70 | 90·4 | 2·2 | 85·9 | 1·6 | 70·4 | 2·2 | 61·9 | 3·0 | 33·4 | 3·2 | 31·3 | 2·7 |
| ≥71 | 94·0 | 1·4 | 80·4*** | 2·0 | 81·2 | 2·9 | 67·8*** | 1·8 | 16·9 | 2·6 | 15·8 | 3·1 |
| All females ≥19 | 87·1 | 2·0 | 81·6 | 1·3 | 65·9 | 2·3 | 56·0 | 2·5 | 36·4 | 2·2 | 34·4 | 1·3 |
| All individuals ≥1‡ | 87·1 | 1·3 | 76·9*** | 1·1 | 67·0 | 2·1 | 54·1*** | 1·9 | 35·2 | 2·0 | 31·3 | 1·2 |
*** Percentage was significantly different from that reporting the same type of water in 2003–2004 (P < 0·001).
† Sample weighted to be representative of the US population.
‡ Excludes pregnant and lactating females.
The mean total drinking water intake of adults aged ≥19 years in 2005–2006 was slightly more than 1 litre/person per d (Table 4); this mean value is based on both reporters and non-reporters of water consumption. About 60 % of that amount was tap water and about 40 % was bottled water. For total plain drinking water, no differences between 2003–2004 and 2005–2006 were found in mean intakes per person. Men aged ≥71 years had a lower mean intake of tap water in 2005–2006 than in 2003–2004 (0·51 litre v. 0·81 litre; P = 0·0002). There were no significant differences in estimates of plain bottled water intake per person for any of the age/gender groups.
Mean intakes of total plain drinking water, tap water and plain bottled water, individuals aged ≥1 year, What We Eat in America/National Health and Nutrition Examination Survey 2003–2004 and 2005–2006, 1 dayFootnote †
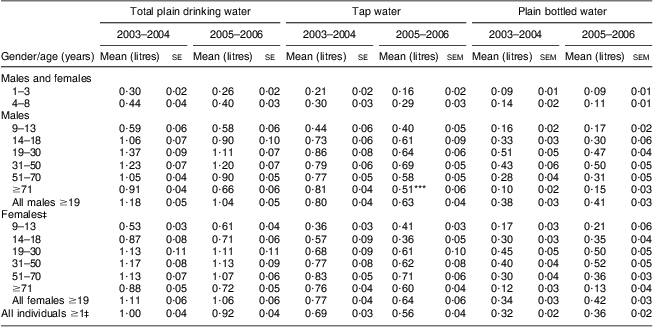
| Total plain drinking water | Tap water | Plain bottled water | ||||||||||
| 2003–2004 | 2005–2006 | 2003–2004 | 2005–2006 | 2003–2004 | 2005–2006 | |||||||
| Gender/age (years) | Mean (litres) | se | Mean (litres) | se | Mean (litres) | se | Mean (litres) | sem | Mean (litres) | sem | Mean (litres) | sem |
| Males and females | ||||||||||||
| 1–3 | 0·30 | 0·02 | 0·26 | 0·02 | 0·21 | 0·02 | 0·16 | 0·02 | 0·09 | 0·01 | 0·09 | 0·01 |
| 4–8 | 0·44 | 0·04 | 0·40 | 0·03 | 0·30 | 0·03 | 0·29 | 0·03 | 0·14 | 0·02 | 0·11 | 0·01 |
| Males | ||||||||||||
| 9–13 | 0·59 | 0·06 | 0·58 | 0·06 | 0·44 | 0·06 | 0·40 | 0·05 | 0·16 | 0·02 | 0·17 | 0·02 |
| 14–18 | 1·06 | 0·07 | 0·90 | 0·10 | 0·73 | 0·06 | 0·61 | 0·09 | 0·33 | 0·03 | 0·30 | 0·06 |
| 19–30 | 1·37 | 0·09 | 1·11 | 0·07 | 0·86 | 0·08 | 0·64 | 0·06 | 0·51 | 0·05 | 0·47 | 0·04 |
| 31–50 | 1·23 | 0·07 | 1·20 | 0·07 | 0·79 | 0·06 | 0·69 | 0·05 | 0·43 | 0·06 | 0·50 | 0·05 |
| 51–70 | 1·05 | 0·04 | 0·90 | 0·05 | 0·77 | 0·05 | 0·58 | 0·05 | 0·28 | 0·04 | 0·31 | 0·05 |
| ≥71 | 0·91 | 0·04 | 0·66 | 0·06 | 0·81 | 0·04 | 0·51*** | 0·06 | 0·10 | 0·02 | 0·15 | 0·03 |
| All males ≥19 | 1·18 | 0·05 | 1·04 | 0·05 | 0·80 | 0·04 | 0·63 | 0·04 | 0·38 | 0·03 | 0·41 | 0·03 |
| Females‡ | ||||||||||||
| 9–13 | 0·53 | 0·03 | 0·61 | 0·04 | 0·36 | 0·03 | 0·41 | 0·03 | 0·17 | 0·03 | 0·21 | 0·06 |
| 14–18 | 0·87 | 0·08 | 0·71 | 0·06 | 0·57 | 0·09 | 0·36 | 0·05 | 0·30 | 0·03 | 0·35 | 0·04 |
| 19–30 | 1·13 | 0·11 | 1·11 | 0·11 | 0·68 | 0·09 | 0·61 | 0·10 | 0·45 | 0·05 | 0·50 | 0·05 |
| 31–50 | 1·17 | 0·08 | 1·13 | 0·09 | 0·77 | 0·08 | 0·62 | 0·08 | 0·40 | 0·04 | 0·52 | 0·05 |
| 51–70 | 1·13 | 0·07 | 1·07 | 0·06 | 0·83 | 0·05 | 0·71 | 0·06 | 0·30 | 0·04 | 0·36 | 0·03 |
| ≥71 | 0·88 | 0·05 | 0·72 | 0·05 | 0·76 | 0·04 | 0·60 | 0·04 | 0·12 | 0·03 | 0·13 | 0·04 |
| All females ≥19 | 1·11 | 0·06 | 1·06 | 0·06 | 0·77 | 0·04 | 0·64 | 0·06 | 0·34 | 0·03 | 0·42 | 0·03 |
| All individuals ≥1‡ | 1·00 | 0·04 | 0·92 | 0·04 | 0·69 | 0·03 | 0·56 | 0·04 | 0·32 | 0·02 | 0·36 | 0·02 |
*** Mean value was significantly different from that for the same type of water in 2003–2004 (P < 0·001).
† Sample weighted to be representative of the US population. Includes both reporters and non-reporters of water.
‡ Excludes pregnant and lactating females.
Discussion
Twenty-four hour recalls are preferable to FFQ for obtaining valid, complete water intake reports( Reference Mons, van der Wielen and Blokker 3 ). USDA's AMPM (the 24 h recall method used in WWEIA) has been called the ‘current state-of-the-art 24-hour dietary recall instrument’( Reference Thompson and Subar 19 ). Although the validity of the AMPM as a collection instrument for intakes of drinking water per se has not been tested, research has shown that the AMPM estimates energy intakes more accurately than FFQ do( Reference Blanton, Moshfegh and Baer 20 ). As shown by validation in doubly labelled water studies, the AMPM yields very accurate, unbiased energy estimates for highly motivated subjects( Reference Blanton, Moshfegh and Baer 20 ), although reporting bias is still possible among less motivated respondents and individuals classified as overweight or obese( Reference Moshfegh, Rhodes and Baer 5 ).
The AMPM addresses the known issue of under-reporting in intake surveys, having undergone extensive methodological testing to enhance food recall and thus minimize forgotten food items( Reference Moshfegh, Rhodes and Baer 5 , Reference Raper, Perloff and Ingwersen 21 ). Starting in 2005–2006, specific mentions (probes) of water were incorporated into AMPM questions in order to encourage respondents to remember to report it. Water is included in both the introductory question (‘Please tell me everything you had to eat and drink .. even snacks, coffee, soft drinks, water [italics added], and alcoholic beverages’) and the final question (‘Do you remember anything else you drank, including water (italics added) …’) of the AMPM( 16 ). Portion estimation aids including household cups, mugs and glasses and a detailed USDA Food Model Booklet are employed to help respondents estimate amounts consumed, a technique recommended to enhance water intake accuracy( Reference Mons, van der Wielen and Blokker 3 ). Additional features of the AMPM that encourage complete reporting are its administration by trained interviewers and the collection of the first day's intake (as used in the present analysis) in person( 11 , 12 ).
For all of these reasons, it is reasonable to consider the current method of collecting drinking water intake data preferable to earlier methods.
The mean intake of bottled water by all individuals aged ≥2 years did not differ significantly between 2003–2004 (0·32 litre) and 2005–2006 (0·36 litre). However, the magnitude of the non-significant difference between those intakes (+0·04 litre/d) aligns well with that of the apparent increasing trend in bottled water consumption in the USA based on disappearance data( 22 ).
Decreases were found in the percentages of individuals reporting tap water in several age/gender groups and in the mean intake of tap water by males aged ≥71 years. Although it is possible that a real change in tap water intake occurred between 2003–2004 and 2005–2006, the cross-sectional, observational nature of the present study makes it impossible to distinguish secular trends from artefacts related to methodological changes. Increased sales of unsweetened carbonated (sparkling), flavoured and enhanced waters during this time period( 23 ) are unlikely to explain the lower percentages reporting tap water in 2005–2006, since the number of WWEIA respondents who reported these kinds of water was very low in both 2003–2005 and 2005–2006. Environmental factors could explain some of the observed differences in reporting between the survey periods. For example, a drought in the Southeast USA during 2005 through the winter of 2007( Reference Manuel 24 ) may have caused changes in drinking water consumption behaviour in that region during the 2005–2006 data collection. As to whether the method change might explain the differences in intake estimates, the AMPM's demonstrated performance in collecting complete food intake data( Reference Moshfegh, Rhodes and Baer 5 ) makes it highly unlikely that collecting water data via the AMPM would result in increased under-reporting. Rather, the opposite is more likely: namely, that less over-reporting of tap water intakes occurred in 2005–2006 when all water data were collected via AMPM than in the earlier survey period when they were collected via FFQ-type questions.
One conclusion that can be drawn from the differences in percentages of individuals reporting water and in mean water intakes between 2003–2004 and 2005–2006 is that it may be inappropriate to combine data from older survey cycles with newer data, at least for some age/gender groups. Trends analysis of water intake data may be contraindicated as well, given the (possible) impact of this methodological change. The findings of the present study illustrate the importance of careful examination of survey variables before either conducting trends analysis or combining data from multiple WWEIA/NHANES survey cycles. Despite these caveats, these data provide benchmark estimates of drinking water intake in the USA; invaluable information that is appropriate to use to address a myriad of research questions.
Researchers should note the analytic benefits afforded by the new method of collecting water data using the AMPM. Among these benefits, the most evident is that the WWEIA/NHANES total nutrient intake data files now include drinking water's contribution not only to moisture, but also to the nutrients Ca, Cu, Mg, Na and Zn. Additionally, this methodological change has greatly extended the array of variables that are available for analyses involving water beyond its nutrient contributions. Data for each report of tap or plain bottled water now include a USDA food code identifying the type of water consumed, the amount (in grams) consumed on that occasion, the intake day of the week, the main language in which the interview was conducted, the time each eating occasion began, the name by which the respondent referred to the eating occasion (breakfast, snack, etc.), whether the water was consumed at home or not, and (for bottled water only) where it was obtained( 11 ). This additional information provides new possibilities for examining water consumption patterns.
Acknowledgements
This contribution is the work of US Government employees and is not subject to copyright protection in the USA. The funding source for this study was the USDA. The contents of this publication do not necessarily reflect the views or policies of USDA, nor does mention of trade names, commercial products or organizations imply endorsement from the US Government. None of the authors had a conflict of interest. R.S.S. contributed to the concept, design, analysis, interpretation of results and writing of the manuscript; C.W.E. contributed to the concept, literature review, interpretation of results, creation of tables and writing of the manuscript; J.D.G. contributed to the design and analysis and conducted the programming; A.J.M. contributed to the concept and design of the study. All co-authors reviewed and critiqued multiple drafts of the manuscripts.


