





1. Introduction
Elongated streaks of the streamwise velocity have long been recognised as important features of wall-bounded turbulence (Kline et al. Reference Kline, Reynolds, Schraub and Runstadler1967), and it was soon proposed that their instability is the cause of the intermittent ‘bursting’ that was later shown to be a dominant contributor to the cross-stream transfer of momentum and to the generation of turbulent drag (Lu & Willmarth Reference Lu and Willmarth1973). While this causal relation was initially hypothetical, detailed mechanisms were eventually suggested (Swearingen & Blackwelder Reference Swearingen and Blackwelder1987), and more concrete evidence appeared. For example, Jiménez & Moin (Reference Jiménez and Moin1991) showed that a minimal self-sustaining unit of plane Poiseuille turbulence consists of a streak that is infinitely long when compared with the minimal computational box, and a pair of shorter quasi-streamwise vortices, whose intensity evolves in counter-phase with the streak. The kinematics of this unit was made clearer in plane Couette flow by Hamilton, Kim & Waleffe (Reference Hamilton, Kim and Waleffe1995), and eventually became codified in a turbulence regeneration cycle in which the vortices generate the streaks by deforming the mean velocity profile, and the streaks create the vortices by some sort of instability (Jiménez Reference Jiménez1994; Hamilton et al. Reference Hamilton, Kim and Waleffe1995). Flores & Jiménez (Reference Flores and Jiménez2010) extended minimal simulations to the logarithmic layer and, by analogy with the viscous-layer results, concluded that a similar regeneration cycle is active across the shear-dominated part of the channel, with the streamwise vortices substituted by more generic transient bursts mainly involving the cross-stream velocities, as in figure 1(a). Although seldom made explicit, it was usually implied that the arrows in this figure represent time. Reduced dynamical models by Waleffe (Reference Waleffe1997) and others also typically include infinitely long streaks and shorter vortices, and Jiménez & Pinelli (Reference Jiménez and Pinelli1999), by modifying different terms of the evolution equations in turbulent channels at low Reynolds numbers, showed that both components are required. Damping the streaks leads to the decay of the vortices, and vice versa, and the result in both cases is laminarisation of the flow. Exact travelling waves and other exact solutions that mimic the near-wall structures also include an infinitely long streak of the streamwise velocity and quasi-streamwise vortices (Nagata Reference Nagata1990; Kawahara, Uhlmann & van Veen Reference Kawahara, Uhlmann and van Veen2012).
(a) The classical self-supporting cycle of wall turbulence. (b) An alternative model in which the burst is self-contained and generates streaks as by-products. (c) Correlation length,  $L_{cor}$, of the three velocity components, defined by the region of the two-point velocity correlation function at a given height in which the correlation $C_{**}>0.1$ and the asterisk stand for any of the three velocity components. Black, streamwise velocity; red, wall-normal; blue, spanwise. Solid lines are streamwise correlations, and dashed lines are spanwise. (d,e) Two-dimensional wall-parallel premultiplied spectra, $\varPhi _{**}=k_x k_z E_{**}$, plotted against the streamwise and spanwise wavelengths, $\lambda_x$ and $\lambda_z$. Colours as in (c). Contours contain 50 % and 90 % of the spectral mass. The vertical dashed lines are the limits of the damping in the simulations D10, D20 and D30 in table 1, from right to left. (d) Averaged over the buffer layer, $y^{+}\in (0, 60)$. (e) Averaged over the outer layer, $y/h\in (0.4, 0.7)$. (c–e) Are from F00 in table 1.

Although no linear instability of the mean velocity profile is known for wall-bounded turbulence (Reynolds & Tiederman Reference Reynolds and Tiederman1967), each of the branches of the regeneration cycle in figure 1(a) can be modelled by transient, non-modal, linear amplification processes. The bursts generate the streaks by linear advection of the mean profile, and the bursts are amplified by the shear, through a tilting process in which eddies at different distances from the wall are reinforced when they overtake each other (Orr Reference Orr1907; Jiménez Reference Jiménez2013). The optimum transient growth of linearised perturbations of the mean velocity profile results in streaks and bursts compatible with those observed in experiments Butler & Farrell (Reference Butler and Farrell1993), del Álamo & Jiménez (Reference del Álamo and Jiménez2006), Jiménez (Reference Jiménez2013), while Vaughan et al. (Reference Vaughan, Farrell, Ioannou and Gayme2015), among others, have presented plausible self-sustaining models of wall turbulence based on time-dependent infinitely long streaks. All these mechanisms are nonlinear in the sense of requiring initial perturbations of sufficiently high amplitude to self-sustain. Bursts are essentially linear and grow by drawing energy from the mean shear (Jiménez Reference Jiménez2013), but infinitesimally small initial perturbations only create infinitesimally weak bursts, which then result in infinitesimally weak streaks. Only sufficiently strong streaks are unstable (Schoppa & Hussain Reference Schoppa and Hussain2002), and no linear self-sustaining mechanism is known.
Bursts and streaks have been extensively studied in turbulence simulations, both in the viscous and in the logarithmic layer. Down- and up-drafts (the sweeps and ejections that form the bursts) are statistically found in pairs consistent with the short quasi-streamwise rollers that substitute the above-mentioned vortices outside the buffer layer. They sit at the interface between longer high- and low-velocity streaks (Lozano-Durán, Flores & Jiménez Reference Lozano-Durán, Flores and Jiménez2012). Their lifetime is controlled by the shear of the mean velocity profile (Lozano-Durán & Jiménez Reference Lozano-Durán and Jiménez2014b) and, when their evolution is conditionally averaged with respect to the maximum intensity of the burst, the progressive tilting of the Orr mechanism is clearly seen (Encinar & Jiménez Reference Encinar and Jiménez2020). Jiménez (Reference Jiménez2018) reviews these observations and their relation with theory.
Considering the above evidence, it may be surprising that the rest of this paper is dedicated to showing that long streaks are not essential features of wall-bounded turbulence, which can be maintained by short fluctuations of the streamwise velocity presumably associated with the bursts themselves, and that the relation between bursts and streaks is closer to that in figure 1(b), with a self-contained burst that only generates the observed longer streaks as by-products. Although whether flows without long streaks can be described as ‘wall turbulence’ may be debatable, as for most of the artificial systems used to analyse turbulence, we will show that the structure of the transverse velocity components of the remaining short scales differs little from unmodified flows. There are three related questions in this respect. The first one, whether infinitely long streaks can become unstable at streamwise wavelengths comparable to the observed bursts, has been amply answered in the affirmative by the authors mentioned above, and by many others. The second question is whether this ‘direct cascade’, from long streaks to shorter bursts, is a necessary part of the turbulent cycle, and the third one is whether, even if this downward cascade is shown not to be a required part of the cycle, it still is an important ingredient of turbulence dynamics. We argue below that the answer to the second question is negative, and that the third question is probably only true to the extent that similarly sized fluctuations of the three velocity components must be present in self-sustained bursts, because bursts exclusively involving velocities in the cross-plane are equivalent to unforced two-dimensional turbulence and must decay. A fourth question, related to the ‘inverse cascade’ by which short bursts may create long streaks, will be left unanswered.
In fact, the evidence for a close connection between the bursts and the much longer streaks is not strong. Figure 1(c) shows that their dimensions are very different. The same-height correlation lengths in the figure underestimate the actual dimensions, which increase when correlations at different heights are taken into account (Sillero, Jiménez & Moser Reference Sillero, Jiménez and Moser2014), but the ratio among structures is not modified. If we denote the streamwise, wall-normal and spanwise directions by  $x$,
$x$,  $y$ and $z$, respectively, and the corresponding velocity components by $u$,
$u$,  $v$ and $w$, the three-dimensional correlations of the transverse velocities, $v$ and $w$, are approximately isotropic in the cross-plane, with dimensions $\varDelta _z/y\approx 1.5$, and only moderately elongated streamwise, $\varDelta _x/y\approx 3$. The correlation of the streamwise velocity is much more elongated, with spanwise dimensions similar to those of the transverse velocities, but with $\varDelta _x/y\approx 15$–30. The same difference emerges from spectra (see figure 1d,e) and from the structural analysis of the bursts by Lozano-Durán et al. (Reference Lozano-Durán, Flores and Jiménez2012). On the other hand, when the thresholding methods used for bursts are applied to the fluctuations of $u$, their dimensions are only $\varDelta _x/y \approx 10$ (see figure 22 in Jiménez Reference Jiménez2018), suggesting that the correlations of $u$ represent a higher level of organisation of shorter units, each of them presumably associated with a burst or a group of bursts. Moreover, the $u$ correlations of boundary layers are two or three times shorter than channels, but the two flows have very similar statistics below the outer intermittent region (Sillero et al. Reference Sillero, Jiménez and Moser2014), and, if we denote by $h$ the channel half-width or other suitable flow thickness, the longest $u$ correlations in channels have $\varDelta _x/h\approx 7$–15, while Moser, Kim & Mansour (Reference Moser, Kim and Mansour1999) and Lozano-Durán & Jiménez (Reference Lozano-Durán and Jiménez2014a) showed that shorter computational boxes, with lengths $L_x=2{\rm \pi}$, give good statistics.
However, all these simulations, which are typically spectral, contain the  $k_x=0$ longitudinal wavenumber that corresponds to an infinitely long streamwise wavelength, and it could be argued that these infinitely long features are responsible for maintaining the flow, as in some of the theoretical models mentioned above. This was explicitly tested by Jiménez & Pinelli (Reference Jiménez and Pinelli1999), who forcibly zeroed all the Fourier components with $k_x=0$ of the wall-normal vorticity, preventing the formation of infinitely long spanwise inhomogeneities of $u$. The flow laminarised in a computational box with $L_x^{+} =500$, where the ‘ $+$’ superscript denotes wall units defined from the friction velocity, $u_\tau$, and from the kinematic viscosity $\nu$. Repeating the experiment in a longer box $(L_x^{+}=1200)$ failed to laminarise the flow, which could only be done by zeroing the first two wavenumbers ( $k_x=0$ and $k_x=2{\rm \pi} /L_x$), thus only retaining uniform streaks with $\lambda^+_x = 2{\rm \pi}/k^+_x \le600$. These experiments were performed at low Reynolds numbers, $h^{+}\approx 180$, and were interpreted to mean that features of at least this length are required for the survival of the near-wall buffer region.
The present paper revisits the experiments of Jiménez & Pinelli (Reference Jiménez and Pinelli1999), which can now be performed at higher Reynolds numbers and in larger boxes, and analysed in the context of the structural information gained since then. The numerical details are given in § 2, results are presented in § 3 and are discussed and summarised in § 4.
2. Numerical experiments
We analyse simulations of pressure-driven incompressible turbulent channels between flat plates separated by a distance  $2h$, in doubly periodic computational boxes whose streamwise and spanwise periods are $L_x$ and $L_z$, respectively. The code is Fourier-spectral in $(x,z)$ and Tchebychev-spectral in $y$, and follows closely Kim, Moin & Moser (Reference Kim, Moin and Moser1987). More details are found in del Álamo & Jiménez (Reference del Álamo and Jiménez2003), whose simulation at $Re_\tau \equiv h^{+}\approx 550$ is used here as a reference. The code integrates evolution equations for $\nabla ^{2} v$ and for the wall-normal vorticity, $\omega _y$, from where other variables are obtained using continuity. The volume flux per unit span, $2hU_b$, is kept constant. To control the spanwise inhomogeneity of the streamwise velocity, the variable to be modified is $\omega _y$, which is approximately equal to $\partial _z u$ for long and narrow features. Following Jiménez & Pinelli (Reference Jiménez and Pinelli1999), this is implemented by explicitly zeroing at each time step all the long harmonics of the Fourier expansion $\omega _y (x,y,z) =\sum \sum \widehat \omega _y (k_x,y,k_z) \exp [{{\rm i}} (k_x x +k_z z)]$, so that
 \begin{equation} \widehat\omega_y (k_x,y,k_z) \to 0,\quad \mbox{for all}\ k_z,\enspace {\rm and}\enspace k_x< 2{\rm \pi}/\lambda_{xf}. \end{equation}
This includes the infinitely long modes with  $k_x=0$. A few simulations were run in which the damping is only applied above or below a given distance from the wall, $y_f$:
 \begin{equation} \widehat\omega_y (k_x,y,k_z) \to \widehat\omega_y (k_x,y,k_z) F(y), \quad\mbox{for all}\ k_z,\enspace {\rm and}\enspace k_x< 2{\rm \pi}/\lambda_{xf}, \end{equation}
with
 \begin{equation} F(y)=\frac{1}{2} \left[1\pm\tanh\frac{y-y_f}{\sigma_f}\tanh\frac{2-y-y_f}{\sigma_f}\right],\quad y\in (0,2). \end{equation}
The plus sign damps the vorticity below  $y_f$, and the minus sign damps it above that level. In our simulations, $y_f=0.2$ and the smoothing length $\sigma _f=0.05$. No modification is applied to the $\nabla ^{2}v$ equation. Other numerical parameters are summarised in table 1, and some wavelength limits are overlaid on the spectra in figure 1(d,e). It should be noted that, because of the choice of simulation variables, arbitrarily manipulating them respects continuity.
Parameters of the large-box simulations. The size of the doubly periodic computational box is  $L_x\times L_z=(8{\rm \pi} \times 4{\rm \pi} )h$, and $U_bh/\nu =10^{4}$, where $U_b$ is the bulk velocity. All simulations use the same collocation grid ( $1536\times 257\times 1536$ in $x,y,z$) with the collocation resolution $\Delta x,\, \Delta y,\, \Delta z$ given in the table. The friction Reynolds number is measured at the end of each simulation, and $\lambda _{xf}$ is the longest undamped wavelength. Wall units for D30 are based on D20.

The damping of the vorticity is equivalent to a body force (or torque) acting in planes parallel to the wall, but because of homogeneity, and because it acts on velocity derivatives rather than on the velocities themselves, its average cancels over time. The total stress profile of all the simulations discussed below is linear.
3. Results
The temporal evolution of the  $L_2$ norm of two velocity components of the damped simulations is given in figure 2, normalised with the equilibrium values of an undamped reference simulation at the same nominal Reynolds number (del Álamo & Jiménez Reference del Álamo and Jiménez2003, F00). The damped cases initially decay, but later recover and stabilise at a lower friction Reynolds number than the reference. Case D30 laminarises completely, and does not recover. Figure 3 shows wall-parallel sections of the streamwise velocity in the buffer $(y^{+}=15)$ and outer $(y/h\approx 0.35)$ regions of the reference case and of two surviving damped cases, D10 and D20.
Temporal evolution of the box-averaged velocity fluctuation intensities,  $u'$ and $v'$, in the full-box simulations in table 1, normalised with the equilibrium values, $u'_{eq}$ and $v'_{eq}$, in del Álamo & Jiménez (Reference del Álamo and Jiménez2003). (a) Streamwise velocity. (b) Wall-normal velocity. Solid red line, D10; solid blue, D15; solid green, D20; solid magenta, D30; dashed red, D10out; solid black, D10in.

Wall-parallel sections of the streamwise velocity. The flow is from left to right, and all normalisations use the friction velocity from del Álamo & Jiménez (Reference del Álamo and Jiménez2003). Each panel contains one fourth of the computational plane. (a,b) Undamped, F00. (c,d) D10. (e, f) D20. The distance from the origin to the vertical dashed line is  $\lambda _{xf}$. (a,c,e) $y^{+}=15$. (b,d, f) $y/h=0.346$.

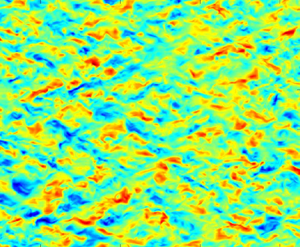
Case D20 contains a mixture of laminar and turbulent patches, reminiscent of transition, which persists for as long as the case was run. Case D10, which filters only wavelengths longer than  $\lambda _x\approx 2.5h$, stays turbulent, but with a very different organisation from the nominal case, whose streaky structure is substituted by a rhomboidal pattern. This organisation is easy to rationalise, because the damping ensures that the streamwise average of the velocity fluctuations vanishes over streamwise distances longer than $\lambda _{xf}$, so that a positive fluctuation has to be followed by a negative one. But the most interesting aspect of figure 3(c,d) is that the spanwise wavelength of the velocity is approximately the same as in the nominal case, so that the angle of the rhombuses increases as this wavelength increases with the distance from the wall. It is intriguing that a weaker, but similar, rhomboidal pattern with an angle close to $45^{\circ }$ is observed in the spanwise velocity of natural flows (Sillero et al. Reference Sillero, Jiménez and Moser2014). If the above explanation applied to it, it would imply that the mean value of $w$ tends to cancel over streamwise distances of the order of its spanwise scale. This is consistent with the lack of long tails in its spectrum (Jiménez Reference Jiménez2018), and may be linked to the streak meandering discussed by Hutchins & Marusic (Reference Hutchins and Marusic2007). It also has the right dimensions to be related to the bursts described in the introduction.
The mean and fluctuation velocity profiles of the damped simulations are shown in figure 4, compared with the reference case. In all cases except the transitional D20, the streamwise fluctuations are weaker than the reference case, while the wall-normal ones are stronger. Although not shown, the behaviour of  $w$ follows the same trend as $v$. This is characteristic of controlled flows, because the relative magnitudes of $u$ and $v$ have to adjust themselves to generate the tangential Reynolds stress used to define wall units. It is clear from the mean velocity profiles in figure 4(a) that D20 is basically laminar above $y^{+}\approx 200$, with no trace of a logarithmic layer, but the behaviour of D10 is interesting. When the whole channel is damped, as in D10, the mean velocity can be described as a logarithm with a low von Kármán constant, reflecting the missing Reynolds stresses. The same is true when only the outer layer is filtered, as in D10out, whose red dashed line is difficult to distinguish from the solid line of D10. However, when only the inner layer is filtered, as in the black solid line of D10in, the mean velocity and the fluctuation profile of $u'$ tend to recover their turbulent behaviour in the undamped layer above $y/h=0.3\ (y^{+}\approx 150)$. This supports the idea that the large scales of the outer part of the channel are not driven by the wall.


The premultiplied spectra in figure 1(b,c) suggest that the behaviour of the flow depends on how much of the  $v$ spectrum is damped. Case D10 barely modifies $\varPhi _{vv}$, either in the buffer or in the outer layer, but D20 damps a large fraction of $v$, especially in the outer layer where figure 4 shows that turbulence has died. The streamwise velocity spectrum, $\varPhi _{uu}$, is heavily damped in both cases, but it does not appear to have a strong effect on $v$ (or in $w$). This is confirmed by figure 5, which compares spectra of damped and undamped simulations. In figure 5(a–c), $\varPhi _{uu}$ is heavily truncated in D10, but the remaining part agrees well with a truncated version of the undamped spectrum. Up to a point, the same is true of $\varPhi _{vv}$, most likely because its truncation is minor. The truncation of $\varPhi _{vv}$ in the near-wall region of D20 is also moderate, but all the spectra are heavily distorted in the outer layer of D20 in figure 5(e), where half of $\varPhi _{vv}$ is damped. In fact, although the contours in these figures are chosen to represent a fixed fraction of the fluctuation energy (75 %), figure 4 shows that the outer spectra in figure 5(e) correspond to weak residual fluctuations, which are not turbulent. Another interpretation of these spectra, especially clear from the $(\lambda _x, y)$ projections in figure 5(c, f), is that turbulence requires that the fluctuations of $u$ be longer than those of $v$, but only by a small factor of two or three.
Premultiplied energy spectrum. The dashed contours are F00. The solid contours are damped cases. The damped region is in grey, and spectral contours contain 75 % of the spectral mass. Black lines,  $\varPhi _{uu}$; red lines, $\varPhi _{vv}$. (a–c, g–i) D10. (d–f) D20. (a,b,d,e) $k_xk_z E$. (g,h) $-E_{uv}/(E_{uu} E_{vv})^{1/2}$. Contours 0.1 and 0.4. Solid lines are D10; dashed lines are F00. (a,d,g) Averaged over the buffer layer, $y^{+}\le 60$, as in figure 1(b). (b,e,h) Averaged over the outer layer, $y/h\in (0.4,0.7)$, as in figure 1(c). (c, f) Isocontours of $k_x E_{**}(k_x,y)/* '^{2}(y)$, vs wavelength and distance from the wall (one of the contours is filled for clarity). (i) Streamwise correlation length, $L_{cor,x}$, of the three velocity components, defined by the region of the two-point velocity correlation function at a given height in which $C_{**}>0.1$. Black, streamwise velocity; red, wall-normal; blue, spanwise. Solid lines are D10, and dashed lines are F00 that has been filtered to the same wavenumber as D10.

While these spectra suggest that filtering the long wavelengths of  $\omega _y$ has relatively little effect on $v$, it is interesting to compare the shorter surviving scales with those at similar wavelengths in a full channel. This is difficult in absolute terms, because it is unclear which $u_\tau$ to use for individual wavenumbers, but a simple dimensionless indicator of flow ‘sanity’ is the structure parameter formed by the $u\unicode{x2013}v$ co-spectrum normalised with the spectra of $u$ and $v$. This is shown in figure 5(g,h) for D10. The long wavelengths that have been damped lose all correlations, and do not contribute to the tangential Reynolds stress, but the structure parameter of the undamped wavelengths is essentially unchanged with respect to the full channel, even near the edge of the damped region. Figure 5(i) shows streamwise correlation lengths for the damped channel and for a full one in which the damped wavenumbers have been zeroed during postprocessing. It should be compared with the unfiltered results in figure 1(c). The size of the transverse velocities has changed little, but the long streamwise correlations of $u$ have disappeared. There is very little effect on the spanwise correlation lengths (not shown). The implication is that, while damping the transverse velocities (and therefore the bursts) kills turbulence at the damped wavenumbers, the large difference between the length of $u$ and $v$ (and $w$) in nominal turbulence is not required for its survival.
To explore the dependence on the Reynolds number, and since the previous results suggest that features longer than  $\lambda _x \approx h$ do not have a strong effect on the dynamics of the structures in the core of the spectrum, two sets of simulations were run in the relatively small boxes used by Jiménez (Reference Jiménez2013) to study the logarithmic layer (case F950 in table 2). According to Flores & Jiménez (Reference Flores and Jiménez2010), turbulence in these boxes should be healthy below $y\approx 0.3 h,\ L_z \approx 0.24 h$. The first set of simulations, detailed in table 2, are damped ones in which the first few wavenumbers are zeroed. The second set are undamped versions of F950 in which the streamwise length of the box is progressively shrunk until turbulence is no longer sustained. This second set of simulations retains the $k_x=0$ mode, and are represented by solid symbols in figure 6(a).
Parameters of the small-box simulations. The size of the doubly periodic computational box is  $L_x\times L_z=({\rm \pi} h/2\times {\rm \pi}h/4)$, and $U_bh/\nu =19\,340$, where $U_b$ is the bulk velocity. All simulations use the same collocation grid ( $192\times 385\times 192$ in $x,y,z$). The friction Reynolds number is averaged over the last half of each simulation, and $\lambda _{xf}$ is the longest undamped wavelength. Wall units for D950-2 are based on D950-1.

(a) Decay of the friction Reynolds number with the streamwise wavelength. Red triangles and blue circles are cases in tables 1 and 2, respectively, plotted vs  $\lambda _{xf}^{+}$; solid squares are undamped channels with the same parameters as F950 in table 2, but with shorter boxes, plotted against $L_x^{+}$. The arrows mark cases that laminarise, scaled in the wall units of the closest surviving simulation. (b) Temporal evolution of the band-averaged $v$ fluctuation intensity, normalised with its temporal mean, and offset for clarity. Top line is F950, and bottom line is D950-0. Symbols mark the snapshots in figure 7. (c) Dashed lines are $C(v'^{2}_b, v'^{2}_b)$, and solid lines at $C(v'^{2}_b, u'^{2}_b)$. Black is F950; red is D950-0. Time in (b,c) is normalised with the mean shear in the averaging band, $S_b$.

The open symbols in this figure summarise the behaviour of the damped boxes, compared with the corresponding undamped simulations. As the damping becomes more severe and the Reynolds stress from the damped scales disappears, the friction Reynolds number decreases with respect to its undamped value,  $Re_{\tau\infty}$, and the flow laminarises for $\lambda _{xf}^{+} \lesssim 400$. We have already mentioned that Jiménez & Pinelli (Reference Jiménez and Pinelli1999) were able to sustain turbulence for $\lambda _{xf}^{+}\gtrsim 600$, but not for shorter wavelengths. This is also the limit found by Jiménez & Moin (Reference Jiménez and Moin1991) for the $L_x^{+}$ of minimal channels at $L_z^{+} \approx 100,\ Re_{\tau }\approx 180$, suggesting that the flow only fully laminarises when the box is too short even for the smallest structures in the buffer layer. This is confirmed by the collapse of figure 6(a) in wall units, although the limit at the higher Reynolds number of the present simulations is closer to $\lambda _{xf}^{+}\approx 450$. On the other hand, the behaviour of damped and undamped boxes is different. The undamped simulations represented by the solid symbols in figure 6(a) retain their infinitely long structures and the associated Reynolds stress, and the figure shows very little degradation of $Re_\tau$ until they laminarise for very short $L_x$. The limit of short and wide channels has been extensively explored by Toh & Itano (Reference Toh and Itano2005) and coworkers, who also find little degradation for boxes longer than $L_x^{+} \approx 260$ at $Re_{\tau }= 137$. Figure 6(a) confirms that a similar limit holds at higher Reynolds number. It may be significant that the undamped limit is shorter than the damped one by a factor of approximately two, which would confirm the similar suggestion from the spectra in figure 5.
An advantage of small boxes is that the uppermost band of wall distances for which turbulence remains healthy is essentially minimal for the energy-containing eddies, and their temporal evolution can be studied by tracking band-averaged integral quantities. For the rest of this section we will use fluctuation intensities averaged over  $y/h\in (0.15-0.3)$, denoted by a ‘ $b$’ subscript.
Figure 6(b) displays the temporal behaviour of  $v'_b$ in cases F950 and D950-0 of table 2, which only differ by the zeroing in the latter of $k_x=0$. Both quantities burst intermittently with an approximately similar period, and with an amplitude that is only slightly larger in the undamped case. The temporal evolution can be quantified by the temporal correlation, which is defined for any two variables $a$ and $b$ as
 \begin{equation} C(a,b; t) = \frac{\langle a(s) b(s+t)\rangle_s}{(\langle a^{2}\rangle_s \langle b^{2}\rangle_s)^{1/2}}, \end{equation}
where the average  $\langle \rangle _s$ is taken over time and over the two sides of the channel.
Figure 6(c) shows correlations of  $u'^{2}_b$ and $v'^{2}_b$, and should be compared with figure 6 in Jiménez (Reference Jiménez2013). The correlation $C(v'^{2}_b, v'^{2}_b)$ is symmetric and agrees very well for the two flows, again suggesting that the dynamics of $v$ is unaffected by damping longer $u$ structures. Jiménez (Reference Jiménez2013) shows that this evolution represents well an Orr (Reference Orr1907) burst. As mentioned in the introduction, such bursts also typically involve $u'_b$, but the correlation $C(v'^{2}_b, u'^{2}_b)$ is not necessarily symmetric, and depends on the location of the burst with respect to pre-existing $u$ fluctuations. In agreement with Jiménez (Reference Jiménez2013), $C(v'^{2}_b,u'^{2}_b)$ is tilted towards negative times in F950, suggesting that the streak weakens as the burst develops (curiously, in apparent contradiction with the idea that bursts generate the streaks, but see figure 7(c) in Encinar & Jiménez Reference Encinar and Jiménez2020). This is not substantially changed for the damped flow.
Snapshots of flow fields in small boxes are presented in figure 7. Figure 7(a–c) are the undamped case F950, and figure 7(d–f) are D950-0. The figures map the distance from the wall of the  $U^{+}=18$ isosurface, which has been chosen because its average position is $y^{+}\approx 100$ in both flows. In practice, it ranges over $y^{+}\in (15\unicode{x2013}200)$, and the colour code is uniform among panels. The three snapshots in each flow are chosen to span a ‘burst’ of $v'_b$, with its peak at the central panel. Red areas are low-velocity regions, and it is interesting that the maps of D950-0 show the same rhomboidal pattern as the large-box damped flows in figure 3(c–f). The burst in figure 7(e) forms when the symmetry of the rhombuses is broken and one orientation dominates over the other. It is tempting to see a similar process in the undamped flow fields, where the breakdown takes places as the tail of the streak ‘catches up’ with itself, although it should be remembered that these snapshots cover a spatially periodic domain, and that their behaviour may partly be an artefact of periodicity.
Wall-parallel views of small-box simulations. Colours are distance from the wall of the  $U^{+}=18$ isosurface. Flow is from the bottom upwards, and lengths are in wall units. (a–c) F950. Time between consecutive frames, $u_\tau \Delta t/h\approx 0.52$. (d–f) D950-0. Time between consecutive frames, $u_\tau \Delta t/h\approx 0.30$.

4. Discussion and conclusions
This note can be seen as a further step in the simplification of minimal models for wall turbulence. We have shown that there are turbulence states in which bursting takes place without long structures of the streamwise velocity, while the undamped wavelengths burst in essentially the same way as in unmodified flows. This suggests that the long correlations of the streamwise velocity found in the latter are not central to the dynamics, and that models are possible in which the reference to streaks in figure 1(a) is absent. Our results can even be understood to mean that streaks are not required for the maintenance of wall-bounded turbulence, since there is little that can be interpreted as a streak in figures 3(c–f) or 7(d–f). In fact, the length limits in figure 6(a) imply that the minimal dimensions of the fluctuations of  $u$ are $\lambda _x^{+}\times \lambda _z^{+}\approx 450 \times 100$, which is much closer to a minimal burst than to an elongated streak. The spectra in figure 5 show that the damped wavenumbers do not contribute to the tangential Reynolds stress, leading to a lower effective $Re_\tau$, but that the undamped modes of the manipulated simulations are little affected by the absence of the longer wavelengths. This is particularly clear in the agreement of the dimensionless spectral structure parameters in figure 5(g,h).
This suggests that the classical sketch of the self-sustaining process in figure 1(a) may be substituted by the (solid) one-loop process in figure 1(b), at least in the manipulated flows. The dashed arrow in this figure reflects that, in this model, the long streaks found in natural flow would be by-products of the shorter bursts. This opens the question of how bursts are restarted, because, as was the case of figure 1(a), the new figure portrays a transient process. The hope is that the new system might be easier to model than the previous one, because one of the components of the latter is missing. A second question is what the role of the long streaks in maintaining turbulence may be. It is unlikely that they have none, because they generate Reynolds stresses at their wavelengths, and the decay of  $Re_\tau$ in figure 6(a) shows that their contribution to the total stress is substantial (see also Liu, Adrian & Hanratty Reference Liu, Adrian and Hanratty2001). What we have shown is that they are not essential components of the bursting cycle, which continues relatively undisturbed when they are removed. But they are present in unmodified flows, and may participate in some other important process. The geometrical collocation of bursts with the interface between streaks is well documented (Lozano-Durán et al. Reference Lozano-Durán, Flores and Jiménez2012), and the asymmetry of the $C(v'^{2}_b, u'^{2}_b)$ correlation in figure 6(c) suggests that, in unmodified flows, bursts appear within streaks that later weaken. Lastly, the related ‘reverse-cascade’ question of how short transient bursts create long and long-lasting streaks, remains open.
Funding
This work was supported by the European Research Council under the Caust Grant ERC-AdG-101018287.
Declaration of interests
The author reports no conflict of interest.


 Open access

