

Consumption of trans fatty acids (TFA) has been linked to a range of cardiovascular risk factors, including systemic inflammation, endothelial dysfunction and adverse effects on blood lipid proteins(Reference Lopez-Garcia1–Reference Micha and Mozaffarian5). Due to the deleterious effects on health, the Institute of Medicine has recommended that TFA intake be as low as possible in the context of a balanced diet(6). Historically, partially hydrogenated vegetable oil (PHVO) has been the leading source of TFA in the American diet(Reference Micha and Mozaffarian5, Reference Allison, Egan and Barraj7). The use of PHVO increased dramatically in the 1960s and 1970s in margarines and processed foods, perceived at that time as a seemingly more healthful alternative to SFA from animal fats and some plant oils(Reference Unnevehr and Jagmanaite8). PHVO quickly became ubiquitous in the food supply, contributing to the shelf-life, texture, taste and overall quality of many packaged foods, ranging from margarines and cereals to snack foods and bakery products.
In the USA, the final rule mandating labelling of the TFA content in packaged foods was published on 11 July 2003 with an implementation deadline of 1 January 2006. The final rule made provisions for food manufacturers to make a ‘0 g trans fat’ front-of-pack declaration of amount, provided that the food contained less that 0·5 g of TFA per serving (the lowest level of quantification as determined by current analytical methods)(9). The Food and Drug Administration (FDA) had estimated that three years after implementation, trans fat labelling would lead to the prevention of 600 to 1200 cases of CHD and 240 to 480 deaths each year, with an estimated annual saving of $US 900 million to $US 1·8 billion in medical costs, lost productivity, and pain and suffering(Reference Moss10). The FDA based reductions in costs and health risks largely on the reduction of trans fat intake due to the reformulation of margarines and decreased consumption based on consumer choice. The final rule explicitly stated that the FDA did not anticipate a significant reduction in trans fat content in other food groups which contained PHVO(9).
Although it is clear from previous research that mandatory labelling has led to the reduction of TFA in a wide range of food products(Reference Unnevehr and Jagmanaite8, Reference Mozaffarian, Jacobson and Greenstein11–Reference Eckel, Borra and Lichtenstein14), the rapidity and scope of food innovations have been a major challenge to measuring the extent of changes in the US food supply(Reference Ratnayake, L'Abbe and Mozaffarian12, Reference Satchithanandam, Oles and Spease15). The food industry has acknowledged that there is no standard, all-purpose oil that can replace PHVO in all products and has recognized that the optimal blend of replacement fats and oils may vary greatly even among foods within the same category(Reference Eckel, Borra and Lichtenstein14). A central concern of removing TFA from processed foods is what alternative ingredients will be used and what the effect will be on the nutritional quality of the food.
While previous studies have focused on a limited number of product reformulations, the present research uses data from a food innovation database to measure aggregate changes in a large number of chip and cookie product introductions over several years. The objectives of the present study include: (i) to construct a timeline to measure pre/post changes in food products; (ii) to analyse what changes, if any, have occurred in the lipid ingredients used in chip and cookie product introductions; (iii) to determine if there has been a significant change in saturated fat profiles; and (iv) to measure the change in average reported TFA content and use of ‘0 g trans fat’ declarations.
Methodology
Recognizing that food manufacturers may be influenced by a complex combination of factors when deciding when and how to respond to stakeholder concerns and regulatory actions about trans fat, a great deal of sensitivity was given in the present study to the task of selecting a time frame within which to conduct a pre/post analysis of the trans fat labelling policy. Several factors were considered including dates of FDA notices and rules in the Federal Register, publication of key documents from the Institute of Medicine, city and state actions on trans fats, media attention surrounding the issue, and the time lags in developing and marketing reformulations.
Media data
The LexisNexis Academic database was queried to gauge media coverage of trans fats in major national and regional US newspapers and wire services from 1999 to 2009. Search terms included the phrases ‘trans fatty acid’, ‘trans fat’ and ‘partially hydrogenated’. Results were categorized by year and graphed with a timeline of policy changes.
Based on the results of the LexisNexis search and summary statistics from the product innovation data set to be discussed below, the years 2001 and 2002 were selected to represent ‘pre’ labelling and the years 2008 and 2009 were selected to represent ‘post’ labelling.
Product data
A real-time food innovation resource, the Mintel Global New Product Database (GNPD), was used to analyse packaged food products released in the USA from 2001 to 2009. All key retail distribution channels are monitored by Mintel's shopper network, including supermarkets, drug stores, natural food stores/health shops, gas stations, convenience stores and other independent outlets. GNPD also gathers data on product innovations through trade shows, press releases and company tracking(16). Product-level observations included ingredient and nutrition information retrieved from food labels.
Chip and cookie introductions were specifically chosen to examine the impact of the policy intervention on ingredient and nutrient profiles, because these products are common in the US diet and are among the major sources of artificial trans fats(9). Previous research suggests that the replacement of trans fats in these categories is more challenging than in other categories, such as margarine. Indeed, the FDA stated in its final ruling that these types of multi-ingredient products were the least likely to be reformulated(9, Reference Eckel, Borra and Lichtenstein14). ‘Cookie’ introductions included all foods classified under the sweet biscuit/cookie subcategory in GNPD, including all types of cookies, sweet biscuits or rice cakes and cookie/sweet spread combinations. ‘Chip’ introductions included all foods classified under the savoury/salty snack subcategory in GNPD, including chips, pretzels, snack mixes and cracker/savoury spread combinations, with the exception of popcorn products, which were considered to be significantly different from chips. All innovations with popcorn as one of the first five ingredients were removed.
Complete observations (with ingredient information, n 5012) were searched for the use of several common food oil or fat ingredients including: partially hydrogenated oils, butter/butter oil, canola oil, rapeseed oil, cocoa butter, coconut oil, corn oil, cottonseed oil, olive oil, palm oil, palm kernel oil, peanut oil, safflower oil and sunflower oil. If a single food product contained more than one type of oil or listed several oils the product ‘may contain’, all types of oil were reported in the results. PHVO was used as a secondary measure of TFA content, to gauge the use of artificial TFA prior to mandatory labelling. The share of products containing each type of oil was calculated by year for each subcategory. The percentage change in use from 2001 to 2009 was also calculated for the seven most common oils in each subcategory.
Statistical analyses
Innovation-level nutrition information was run through a database macro and manually cleaned to separate information on serving size, total fat, saturated fat and trans fat contents. The FDA allows some flexibility in reported serving sizes and permits manufacturers to print nutrition information in terms of amounts that may reasonably be consumed. Therefore, fat contents were standardized to a 30 g serving (the reference amount for chip and cookie products)(17) to control for variations in serving size. Standardized saturated fat content per serving (satfat) and the ratio of saturated fat to total fat content (satratio) were used to analyse changes in nutrition profiles.
Statistical analyses were conducted in two parts. First, Pearson correlation coefficients were calculated for satfat and satratio variables v. time for both categories. If the linear correlation was significant (P < 0·05), then one-way ANOVA with Scheffé post hoc testing (α = 0·02) was conducted, comparing products introduced from 2001–2002 (pre-labelling) to products introduced in 2008–2009 (post-labelling). Descriptive statistics were tabulated by category based on trans fat content and use of PHVO. Outliers, defined as observations that have values larger or smaller than three standard deviations from the mean, did not have a significant impact on results and were not removed. All analyses were conducted using the statistical software package SPSS Statistics 16·0 (IBM, Chicago, IL, USA).
Results
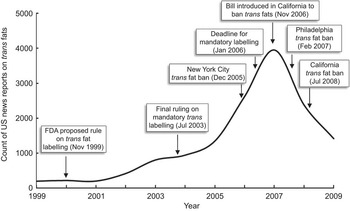
The LexisNexis search of major US news publications from 1999 to 2009 for the terms ‘trans fatty acid’, ‘trans fat’ and ‘partially hydrogenated’ returned 14 517 observations (Fig. 1). Media attention regarding trans fat began to climb steadily starting in 2002, but did not peak until 2007, well after the FDA's final ruling in 2003 and even a year after the effective date of mandatory labelling on 1 January 2006. The media momentum seemed to correspond more closely to local and state trans fat policy developments rather than federal regulations.
Trend of trans fat US media reports by year and timeline of trans fat policy developments
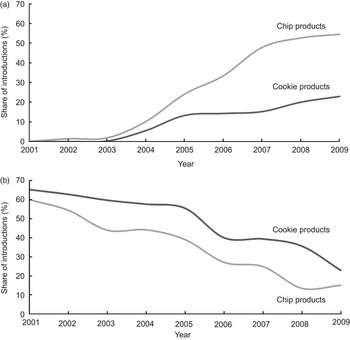
Mirroring the trend of media attention, the share of product introductions touting a ‘0 g trans fat’ declaration grew steadily in both chips and cookies beginning in 2003 (Fig. 2a). After 2005, the use of such declarations appeared to rise steadily in chip introductions until 2007, while the use of ‘0 g trans fat’ declarations in cookie introductions stayed relatively flat between 2005 and 2009. The use of these declarations was much greater in chips than in cookies. This is reasonable considering a greater share of chips did not contain PHVO. This difference may also have been related to the difficulty of reformulating cookie products, relative to chip products, as suggested by the literature(Reference Ratnayake, L'Abbe and Mozaffarian12). In addition, in both categories the share of products using such a declaration was much lower than the share that qualified to do so. In 2009, 85 % of chip introductions and 77 % of cookie introductions were eligible to make a ‘0 g trans fat’ declaration, but only 55 % and 23 %, respectively, carried one. This may be due to the fact that snack food manufacturers walk a fine line between appeasing health concerns and maintaining the perception of good taste and indulgence that is often central to their brand image.
(a) Shares of chip and cookie introductions that made a ‘0 g trans fat’ declaration by year; (b) shares of chip and cookie introductions containing partially hydrogenated vegetable oil by year. Share is of observations reporting ingredient information, ranging from 75 % to 97 % for chips and from 76 % to 93 % for cookies
Changes in use of lipid ingredients
From 2001 to 2009, the share of all chip and cookie introductions containing PHVO fell by 45 and 42 percentage points, respectively (Fig. 2b). Over the same time period, there were major changes in the leading sources of lipids (Table 1). Sunflower replaced soyabean oil as the most widely used lipid ingredient in chip products, while palm oil replaced soyabean oil as the most commonly used oil ingredient in cookie products. In chip introductions, the use of soyabean and cottonseed oils declined by 30 and 25 percentage points, respectively, from 2001 to 2009, and there was a concurrent increase in the use of oils naturally high in MUFA and PUFA, including sunflower (27 %), canola (12 %), and safflower (11 %) oils. The use of corn oil increased by 11 percentage points. In cookie introductions, there was also a decline in the use of soyabean (20 %) and cottonseed (22 %) oils. Over the same period, the share of cookie introductions containing palm and palm kernel oils, which contain a large amount of SFA, increased by 41 and 5 percentage points, respectively. The use of butter/butter oil and cocoa butter remained relatively constant.
The seven most commonly used oils in chip and cookie product introductions

In addition to the overall increase or decrease in the use of particular fat ingredients, it is important to note the timing in which the biggest changes occurred. In the chip category, there were declines of more than 10 % in the share of products using PHVO in 2003, 2006 and 2008. These declines mirrored the trend of declining soyabean and cottonseed oil use, and corresponded to the deadlines for mandatory labelling. However, in cookie products, there were only two major declines in the share of products containing PHVO in 2006 and 2009. This lag suggests that these manufacturers waited longer to begin developing new formulations for cookies and/or faced more difficulties in finding viable alternatives to PHVO high in TFA.
Changes in fat profiles
Pearson correlations were used to examine the relationships between the fat variables and time in years. For cookies, both the satfat (r(2518) = 0·08, P < 0·001) and satratio (r(2518) = 0·14, P < 0·001) correlations were significant and increasing over time. For chips, the satfat and satratio variables were both negatively correlated with time, but only the satfat was statistically significant (r(2142) = –0·06, P = 0·007).
In the variables that were found to have a significant Pearson correlation, one-way ANOVA with Scheffé post hoc testing was used to test for significant changes in satfat and satratio between ‘pre-labelling’ (2001–2002) and ‘post-labelling’ (2008–2009) periods (Table 2). In cookies, there was an increase of 0·49 (98 % CI 0·01, 0·98) g in the average saturated fat content per 30 g serving (F(3, 917) = 4·18, P = 0·006) and an increase of 9 (98 % CI 3, 15) % in the average ratio of saturated to total fat (F(3, 917) = 11·75, P < 0·001). Since the satratio increase was more significant than the satfat increase, a follow-up analysis was conducted to determine if there was also a decrease in average total fat content per serving from 2001 to 2009. A Pearson correlation revealed a non-significant negative relationship between total fat and time (r(2552) = –0·03, P = 0·111).
Saturated fat content (satfat) and saturated to total fat ratio (satratio) in chip and cookie products pre- and post-labelling (standardized 30 g serving size)

*Significantly higher than average satratio in 2001 and 2002 (P < 0·01); increase of 9 (98 % CI 3, 15) %.
†Significantly lower than average satfat in 2001 (P = 0·015), but does not signify a consistent trend.
‡Significantly higher than average satfat in 2001 (P = 0·017); increase of 0·49 (98 % CI 0·01, 0·98) g.
The ANOVA for the satfat variable in chips was also significant (F(3, 842) = 4·18, P = 0·014). Specifically, the average saturated fat content per 30 g serving in 2008 (mean 1·27 (sd 1·26) g) was less than in 2001 (mean 1·71 (sd 1·49) g). However, there was no significant difference between the average saturated fat content in 2009 (mean 1·49 (sd 1·42) g) and that in either 2001 or 2002 (mean 1·47 (sd 1·28) g). Based on these results it seemed likely that the significance found in the ANOVA was due to extraneous fluctuations in the fat contents of chip products and not indicative of a trend that may be correlated with changes in the trans fat labelling policy. The changes in average reported TFA and combined SFA and TFA content for chips and cookies from 2006 to 2009 are presented in Table 3.
Mean reported trans fatty acid (TFA) and combined SFA + TFA contents in chips and cookies (standardized 30 g serving size)

From 2006 to 2009 the average TFA content and share of introductions reporting greater than zero grams of trans fat per serving declined in both chips and cookies. In 2009, only 1 % of chip introductions and 9 % of cookie introductions reported greater than zero grams of TFA per serving. Figure 3 includes a summary of the changes in TFA content and use of PHVO.
Share of cookie and chip introductions by reported trans fat content and use of partially hydrogenated vegetable oils (PHVO) in 2006–2009: ![]() , >0 g trans fat preserving (bottom);
, >0 g trans fat preserving (bottom); ![]() , reported 0 g trans fat, contains PHVO;
, reported 0 g trans fat, contains PHVO; ![]() , reported 0 g trans fat, contains no PHVO;
, reported 0 g trans fat, contains no PHVO; ![]() , trans fat content not reported (top)
, trans fat content not reported (top)

Discussion
The mandatory labelling of TFA content in packaged food products offers a case study of a food policy that was supported by medical evidence and that could have influence on public health through the actions of consumers and food manufacturers. A better understanding of both the demand and supply impacts of trans fat labelling is necessary to evaluate how consumers and food manufacturers respond to policy changes and is essential to creating effective nutrition policy in the future. The fact that there has been an increase in the use of several types of vegetable and tropical oils in chip and cookie products supports discussions in the current literature that manufacturers have used blends of various types of lipid ingredients to replace PHVO. The results of the present study suggest that the evolution of oil use may differ across food categories.
Limitations
The present study provided the first comprehensive assessment of the fat contents and compositions in newly introduced chip and cookie products before and after the mandatory labelling of trans fat content. The analysis included thousands of chip and cookie products released between 2001 and 2009. Nevertheless, it is important to note that the data set: (i) did not capture all product introductions; (ii) was not collected using a structured sampling technique; and (iii) some observations were omitted because they lacked nutrition or ingredient information for the product. This research also relied on label declared measures of TFA, SFA and total fat, and therefore it was not possible to measure error in these reported amounts.
Implications for public health
In the context of the trends in use of lipids in cookies and chips, the health implications of changes in the composition of food products to replace TFA are mixed. The results of the present study showed that the use of PHVO, the leading source of dietary TFA, has declined in chips and cookies. There has been a concurrent increase in the use of vegetable oils high in MUFA and PUFA in chips, with no statistically significant changes in the ratio of saturated to total fat per 30 g serving. These ingredient alternatives offer the greatest potential for reduction in risk of CHD. In cookies, the use of ingredients high in SFA, including palm and palm kernel oils, has increased as use of PHVO has declined, corresponding to a significant increase in the saturated fat proportion of total fat. Although ingredients high in SFA are a less than ideal replacement for TFA, it is important to highlight that the total fat per 30 g serving of cookies did not increase significantly. Since the PVHO used in bakery goods are often high in TFA, even the replacement of PHVO with butter and/or tropical oils high in SFA could reasonably be expected to reduce risk of CHD based on the results found by Mozaffarian and Clarke(Reference Mozaffarian and Clarke18). However, the specific effect on cardiovascular risk is dependent on the original content of TFA in the individual product (not available prior to the change in Nutrition Facts labels) and the fatty acid composition of the replacement ingredients.
Two of the most interesting findings from the present study are the continuing declines in the average TFA content and the share of products reporting greater than zero grams of TFA on the Nutrition Facts label after the 2006 labelling deadline (Fig. 3). This latter result may be due to the fact that small manufacturers had until 1 January 2007 to comply with the ruling. The FDA granted many manufacturers extensions, with a final deadline of 1 January 2008(9). Manufacturers may have also been influenced by the continued media attention on trans fats, numerous state and local bans, and consumer demand for ‘zero trans’ foods. However, it is important to note, especially in chips, that the share of products which report zero grams of trans fat content on the Nutrition Facts label, but still contain PHVO, has also continued to fall. This evidence suggests that the food industry is working to make trans fat content as low as possible in both chip and cookie products.
An ongoing challenge in the food industry is the development of feasible alternatives which are low or free of both TFA and SFA. One alternative is to use improved processes, such as interesterification or selective partial hydrogenation, to modify the oils. These alternative methods allow food manufacturers to alter the melting point of the oil and produce little to no TFA. However, there has been limited commercial adoption of interesterification and selective partial hydrogenation in the USA, possibly due to ongoing research examining the health implications and economic feasibility of these technologies(Reference O'Brien and Richard19–Reference Dijkstra22). Perhaps the most promising alternative highlighted in the current literature is the development of several functional oils made from trait-enhanced seed, such as high-oleic sunflower oil or low-linolenic soyabean oil. Barriers to these alternatives include the time and cost involved in developing sufficient supply and product reformulation(Reference Eckel, Borra and Lichtenstein14, Reference Singh, Rezac and Pfromm21). In a comprehensive summary of the feasibility of alternatives to PHVO, Skeaff proposed oil use would transition over time from PHVO high in TFA (traditional practice), to palm and vegetable oil blends high in SFA with no TFA (present practice), finally to high-oleic vegetable blends with no TFA or SFA (future practice)(Reference Skeaff23). The results of the present study generally support this evolution, but highlight that the transition time frame and ingredient solutions will likely vary by food category.
Consumer behaviour and future research
Linking these results to sales or consumption data is a logical and necessary next step to determine the impact of the labelling policy on public health from chip and cookie consumption. The public health impact of the trans fat labelling policy, or any other food labelling policy, depends on the responses of food manufacturers and consumers. How consumers react to new information on food labels, novel ingredient formulations, or both, is critical in determining the impact of the policy. For example, if a ‘0 g trans fat’ declaration on chips and cookies creates a halo effect which leads to significant increases in consumption of these products, then the benefits of removing trans fats may be negated(Reference Wansink and Chandon24). For consumers to make healthier decisions regarding trans fats, they must not only have access to label information about trans fat content, but must also understand the relationship between trans fat consumption and health in the context of a healthy diet and be motivated to use all available nutrition information(Reference Howlett, Burton and Kozup25–Reference Lin and Yen27).
Acknowledgements
The authors gratefully acknowledge funding from Center for Food Safety and Applied Nutrition – FDA under a Cooperative Agreement (HHSF223200811309P). The authors have no conflicts. D.V.C. conducted the empirical analysis; all authors jointly wrote and edited the manuscript.


