

1. Introduction
Meteorological parameters, especially sunshine, have been thought to influence the human mood since ancient times. A treatment option for melancholy in Aretaeus’s time was to stare directly into the sun [Reference Eagles1]. In 1984, Rosenthal et al. [Reference Rosenthal, Sack, Gillin, Lewy, Goodwin and Davenport2] defined Seasonal Affective Disorder (SAD), which has been seen as a disorder associated with less light during the winter months, and reported on the antidepressant effect of light therapy.
Although meteorological parameters have been extensively studied for their association with suicide [Reference Papadopoulos, Frangakis, Skalkidou, Petridou, Stevens and Trichopoulos3–Reference Salib and Gray15], the literature is more limited and inconclusive on the association between those parameters and mood or other psychiatric outcomes [Reference Radua, Pertusa and Cardoner16–Reference Hawley and Wolfe24]. Radua et al. [Reference Radua, Pertusa and Cardoner16] reported a negative one-month delayed association between a climatic factor primarily composed of temperature and sunlight, and depression with melancholic features. The same association was reported between a climatic factor mostly composed of barometric pressure and depression with psychotic features [Reference Radua, Pertusa and Cardoner16]. Increase in daylight [Reference Molin, Mellerup, Bolwig, Scheike and Dam19, Reference Beecher, Eggett, Erekson, Rees, Bingham and Klundt23] and temperature [Reference Molin, Mellerup, Bolwig, Scheike and Dam19, Reference Amr and Volpe22] has been associated with a reduced risk of depression and mental health distress. Nevertheless, the reversed pattern has also been reported [Reference Hawley and Wolfe24]. Humidity has similarly been associated with depression and psychiatric admissions [Reference Salib and Sharp21, Reference Amr and Volpe22]. While the above-mentioned studies have reported on associations for some parameters, their findings are negative for others [Reference Huibers, de Graaf, FPML and Arntz17, Reference Molin, Mellerup, Bolwig, Scheike and Dam19, Reference Salib and Sharp21]. For example, while humidity was associated with admissions of affective disorders in the study by Salib et al. [Reference Salib and Sharp21], the findings for sunshine hours, temperature, and rainfall were negative. Moreover, a Danish study reported negative findings on the association between several meteorological parameters and onset of bipolar disorder [Reference Christensen, Larsen, Gjerris, Peacock, Jacobi and Hassenbalch20]. Similarly, a large study from Ireland found no associations between hospital admissions of depression and hours of sunshine, sunlight radiation, temperature, rainfall, wind speed and direction, and barometric pressure [Reference McWilliams, Kinsella and O’Callaghan18].

EPDS: Edinburgh Postnatal Depression Scale; IQR: interquartile range; gw: gestational week; DSRS: Depression Self-Rating Scale; BMI: body mass index; NICU: neonatal intensive care unit; SLEs: stressful life events.
Apart from meteorological parameters as a possible explanation to the seasonality of suicide and mood symptoms, aeroallergens have been discussed as a possible triggering factor [Reference Postolache, Stiller, Herrell, Goldstein, Shreeram and Zebrak25, Reference Qin, Waltoft, Mortensen and Postolache26]. Qin et al. [Reference Qin, Waltoft, Mortensen and Postolache26], reported a 13% increase in weekly numbers of suicides when the pollen count increased from 0 to’ 30–100’ grains/m3 air, also finding risks with even smaller changes. Similarly, among younger women, a two-fold increase in suicide in the peak-pollen period compared with the pre-pollen period has been reported [Reference Postolache, Stiller, Herrell, Goldstein, Shreeram and Zebrak25]. Moreover, higher rates of allergy in patients with depression have been described, as well as greater rates of depression in patients with allergic rhinitis than in the general population [Reference Postolache, Komarow and Tonelli27].
In the fifth edition of the Diagnostic and Statistical Manual of Mental Disorders (DSM-5), peripartum depression is defined as a major depressive episode with onset during pregnancy (antenatal depression) or within four weeks after childbirth (postpartum depression) [Reference American Psychiatric Association28]. Nevertheless, in both research and clinical practice, the postpartum period is often extended to include the first year after birth [Reference O’Hara and Wisner29]. A recent systematic review estimated the pooled prevalence of peripartum depression to be 11.9% [Reference Woody, Ferrari, Siskind, Whiteford and Harris30]. Previous mental illness is the most prominent risk factor for developing peripartum depression, but lack of social support, unplanned or unwanted pregnancy, adverse life events, pregnancy complications, and low income can also increase the risk [Reference Biaggi, Conroy, Pawlby and Pariante31–Reference Pearlstein, Howard, Salisbury and Zlotnick33]. Premature birth, low birth weight, and negative effects on the social behavior and cognitive development have been reported increased in children of mothers with peripartum depression [Reference Grote, Bridge, Gavin, Melville, Iyengar and Katon34–Reference Sutter-Dallay, Murray, Dequae-Merchadou, Glatigny-Dallay, Bourgeois and Verdoux36].
Seasonal patterns in peripartum depressive symptoms have been studied, although there is no clear consensus [Reference Corral, Wardrop and Zhang37–Reference Henriksson, Sylven, Kallak, Papadopoulos and Skalkidou46]. We have previously reported a seasonal pattern in postpartum depressive symptoms, with an increased risk in women giving birth in October–December, compared with those giving birth in April–June [Reference Sylvén, Papadopoulos, Olovsson, Ekselius, Poromaa and Skalkidou44], which could not be replicated in a later study from the same catchment area [Reference Henriksson, Sylven, Kallak, Papadopoulos and Skalkidou46]. In the latter study however, the same seasonal pattern was observed in postpartum depressive symptoms only during 2011, which raised the hypothesis if extreme climatic conditions are associated with peripartum depressive symptoms. Furthermore, few studies have investigated the possible contribution of meteorological parameters to these symptoms. Postpartum depression has been suggested to decrease in season of intermediate daylight and increase during season with the least daylight [Reference Hiltunen, Jokelainen, Ebeling, Szajnberg and Moilanen38]. Similarly, seasonally longer nights have been suggested to increase antenatal depressive symptoms in depressed women [Reference Meliska, Martínez, López, Sorenson, Nowakowski and Kripke40]. However, in a large study by Jewell et al. [Reference Jewell, Dunn, Bondy and Leiferman39], no associations between daylight at the time of childbirth and postpartum depression were found. Moreover, to the best of our knowledge, there are no studies on the possible role of aeroallergens and peripartum depression.
The aim of this study was to examine if meteorological parameters and air pollen count are associated with self-reported peripartum depressive symptoms in Uppsala, Sweden. Two study populations were used.

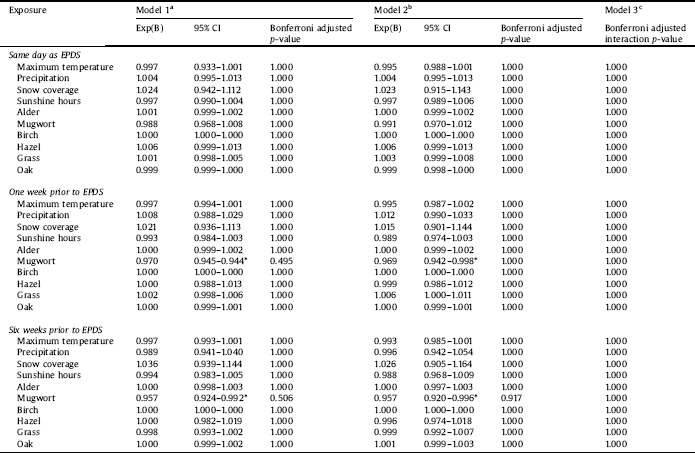
CI: confidence interval; EPDS: Edinburgh Postnatal Depression Scale *p-value <0.05 prior to Bonferroni correction, but not after aUnadjusted model bAdjusted for season cAdjusted for season and interaction term between season x respective meteorological parameter/pollen.
2. Methods
The current study was undertaken as part of both the BASIC (Biology, Affect, Stress, Imaging, and Cognition) and UPPSAT (Uppsala-Athens) studies conducted in Uppsala, Sweden. Uppsala is located in central Sweden, a country with a temperate climate. Winters are usually mildly cold with frequent snow or rainfalls, and summers are warm and sunny. Of note, in Uppsala, the climate can vary greatly between the years.
BASIC is an on-going longitudinal population-based study with multiple assessments during pregnancy and after childbirth. The study was initiated in 2009 and the primary aim is to study several aspects of affective disorders during the peripartum period [Reference Hellgren, Åkerud, Skalkidou and Sundström-Poromaa47]. Women from Uppsala County Council, who register for routine ultrasound around gestational week 17 at Uppsala University Hospital are asked about participation. Exclusion criteria are being under the age of 18 years, not being able to communicate adequately in Swedish, protected identity, blood borne infectious diseases, or a non-viable pregnancy.
The UPPSAT study was a population-based cohort study conducted between May 2006 and June 2007 [Reference Sylven, Thomopoulos, Kollia, Jonsson and Skalkidou48]. The primary aim of the study was to investigate maternal, paternal, and infant well-being after childbirth [Reference Sylven, Thomopoulos, Kollia, Jonsson and Skalkidou48, Reference Cato, Sylven, Skalkidou and Rubertsson49]. Women from Uppsala County Council, who gave birth at Uppsala University Hospital were contacted by their midwife or midwife’s assistant after childbirth and asked to participate. Exclusion criteria included: inability to adequately communicate in Swedish, protected identity, intrauterine demise or infant being immediately admitted to the neonatal intensive care unit.
Both studies were conducted at the Department of Obstetrics and Gynecology at Uppsala University Hospital, which is responsible for all women giving birth within Uppsala county, as well as high-risk pregnancies from nearby counties. Written informed consent was obtained from all participating women.
2.1. Study population
The current study included women participating in the BASIC (January 2010 to December 2015) and UPPSAT (May 2006 to June 2007) studies.
2.2. Outcome variables
The main outcome was presence of depressive symptoms, as measured by the Edinburgh Postnatal Depression Scale (EPDS), at (i) gestational week 32 (BASIC) and (ii) 6 weeks postpartum (BASIC and UPPSAT). The main outcome was analyzed using continuous EPDS scores. Response at both time points was not mandatory for inclusion, answering one questionnaire was sufficient. The EPDS is a self-administered instrument aimed to screen for depressive symptoms during pregnancy and the postpartum period [Reference Cox, Holden and Sagovsky50]. The questionnaire contains ten statements with four alternative answers, and gives a total score from 0–30. A higher score signals an increased likelihood of the woman being depressed.

CI: confidence interval; EPDS: Edinburgh Postnatal Depression Scale *p-value < 0.05 prior to Bonferroni correction, but not after aUnadjusted model bAdjusted for season cAdjusted for season and interaction term between season x respective meteorological parameter/pollen.
2.3. Outcome variables for sensitivity analyses
As a secondary outcome, the EPDS was also dichotomized and the presence of self-reported depressive symptoms was investigated. The cut-off ≥13 has been validated in a Swedish pregnant population, with a sensitivity of 77% and specificity of 94% [Reference Rubertsson, Börjesson, Berglund, Josefsson and Sydsjö51], and was used for depressive symptoms at gestational week 32. At 6 weeks postpartum, women were screened positive for self-reported depressive symptoms when having a total score of ≥12 [Reference Wickberg and Hwang52]. A validation of this cut-off in a Swedish population yielded a sensitivity of 96% and a specificity of 49% [Reference Wickberg and Hwang52]. In order to decrease the number of missing values in the BASIC study, if only one of the ten statements was missing (gestational week 32, n = 34 (0.9%); 6 weeks postpartum, n = 115 (3.1%)), this answer was imputed by calculating the mean score based on nine answers.
In addition, the Depression Self-Rating Scale (DSRS) [Reference Svanborg and Ekselius53] was used to more strictly evaluate depressive symptoms at 6 weeks postpartum (BASIC). The DSRS is a self-report instrument including the same criteria for depressive symptoms as in the DSM-IV, including the C criterion on impaired function. Even so, its self-report nature does not provide a clinical diagnosis. Compared with an expert clinical diagnosis, the DSRS has a sensitivity of 86% and specificity of 75% [Reference Svanborg and Ekselius53]. The DSRS was not available at gestational week 32 in the BASIC study, nor in the UPPSAT study.
The results of the sensitivity analyses are presented in the Supplementary Tables 1–4.
2.4. Demographic characteristics
Most of the data, including the EPDS and DSRS, derived from web surveys answered at gestational week 17, 32, and at 6 weeks postpartum. In BASIC, the women were asked about their weight and height, educational attainment, depression history, allergy, and planned pregnancy in the survey sent out at gestational week 17. Data on depression history were derived from combining the question “Have you ever had a depression?”, with yes/no alternative answer with a question on whether the participant ever had visited a psychiatrist or psychologist. This was done as the question on solely depression was absent in the UPPSAT material. Information on allergies was derived from the question “Have you ever had any of these diseases before you became pregnant?”, where allergy was one alternative answer. Lastly, planned pregnancy derived from the question “Was the pregnancy planned?”, with yes/no alternative answers. At gestational week 32, the women were asked about current employment, hours of sleep per night, and they filled out the EPDS. At 6 weeks postpartum, data was collected on hours of sleep per night, breastfeeding, baby problems, perceived help with baby care by their partner, and stressful life events (SLEs). SLEs were assessed using the Rosengren Scale [Reference Rosengren, Orth-Gomér, Wedel and Wilhelmsen54]. In addition, the women were asked to fill out the EPDS. In UPPSAT, at 5 days postpartum, the women answered questions about their weight, height, educational attainment, and if the pregnancy was planned. At 6 weeks postpartum the women were asked to fill out the EPDS and answer questions regarding depression history, hours of sleep per night, breastfeeding, baby problems, perceived help with baby care by their partner, and SLEs. The recoding of the data, for both BASIC [Reference Henriksson, Sylven, Kallak, Papadopoulos and Skalkidou46] and UPPSAT [Reference Sylven, Thomopoulos, Kollia, Jonsson and Skalkidou48], has previously been described in detail. The medical records were used to retrieve information on date of childbirth, newborn sex, way of giving birth, parity, and whether the child was transferred to the neonatal intensive care unit.

CI: confidence interval; EPDS: Edinburgh Postnatal Depression Scale *p-value < 0.05 prior to Bonferroni correction, but not after aUnadjusted model bAdjusted for season cAdjusted for season and interaction term between season x respective meteorological parameter/pollen.
2.5. Exposures
All data on meteorological parameters were obtained from the Swedish University of Agricultural Sciences in Uppsala, Sweden. Daily data from 2006 to 2014 were collected from the same climate station, however, as from January 1, 2015, the data was collected from a new station. The climate stations were located approximately 800 m apart in Ultuna, a district in Uppsala. Daily data collected were temperature [°C], sunshine hours, solar radiation [MJ/m2], precipitation [mm], snow depth [cm], and snow coverage categorized as 0 (no snow), 0.33 (<50% snow covered), 0.66 (>50 snow covered), or 1 (fully snow covered).
Data on air pollen count were obtained from the Palynological laboratory in Stockholm, Sweden. The pollen trap, located at Stockholm University, covers a radius of 70–100 km, and was the closest one to Uppsala (the distance between Stockholm and Uppsala is approximately 65 km). The pollen was collected in a Burkard Seven Day Volumetric Spore Trap, where it was captured on a sticky tape (the trap sucks in approximately 10 L of air per minute). The pollen was later analyzed and counted using a light microscope. The method used by the Palynological laboratory is standardized in Europe and in large parts of the rest of the world [55]. The reported pollen counts refer to the average pollen grains per cubic meter of air per day. Data were obtained on alder (Alnus), mugwort (Artemisia), birch (Betula), hazel (Corylus), grass (Poaceae), and oak (Quercus).
Using moving averages, variables were created with information on exposure 1, 7, and 42 days prior to the assessment of depressive symptoms. This enabled investigation of duration effects of meteorological parameters and pollen on depressive symptoms. During days with reported technical issues (temperature, n = 1; solar radiance, n = 1; sunshine, n = 4; and pollen, n = 10), these cells were left blank and imputations were implicitly made when conducting the moving averages for one week and six weeks prior to the assessment by adjusting the denominator.
(a) Daily measurements of meteorological parameters for the whole study period of BASIC (2010–2015), in comparison with percentage women with depressive symptoms (EPDS ≥ 13) at gestational week 32. (b) Daily measurements of air pollen count (average grains/m3 air/day) for the whole study period of BASIC (2010–2015), in comparison with percentage women with depressive symptoms (EPDS ≥ 13) at gestational week 32. The birch values have been divided by 100, the other pollen types by 10.

(a) Daily measurements of meteorological parameters for the whole study period of BASIC (2010–2015), in comparison with percentage women with depressive symptoms (EPDS ≥ 12) at 6 weeks postpartum. (b) Daily measurements of air pollen count (average grains/m3 air/day) for the whole study period of BASIC (2010–2015), in comparison with percentage women with depressive symptoms (EPDS ≥ 12) at 6 weeks postpartum. The birch values have been divided by 100, the other pollen types by 10.

(a) Daily measurements of meteorological parameters in comparison with percentage women with depressive symptoms (EPDS ≥ 12) at 6 weeks postpartum in UPPSAT, by month of the year. (b) Daily measurements of air pollen count (average grains/m air/day) in comparison with percentage women with depressive symptoms (EPDS ≥ 12) at 6 weeks postpartum in UPPSAT. The birch values have been divided by 100, the other pollen types by 10.

2.6. Ethical considerations
Both study protocols have been approved by the Regional Ethical Review Board of Uppsala, Sweden (BASIC, Dnr 2009/171; UPPSAT Dnr 2006/150).
2.7. Statistical analyses
2.7.1. Spearman correlation
A Spearman correlation test was performed, as correlations were suspected between the different meteorological parameters, as well as the different types of pollen. As there was a strong correlation (±0.75–1.00) between average temperature and maximum temperature, snow depth and snow coverage, and sunshine hours and global radiation, only the following variables were included in the final analysis; maximum temperature, precipitation, snow coverage, sunshine hours, and all types of pollen.
2.7.2. Regression models and Bonferroni correction
Due to the large amount of data at EPDS = zero and the long right tail, linear regression did not give well-fitting residuals. Negative binomial regression, which was better suited to the distribution of the EPDS was used for the continuous outcomes. Three models were run, for each individual exposure:
i) unadjusted
ii) adjusted for season
iii) adjusted for season and interaction term between season x respective meteorological parameter/pollen
Season was divided as follows; December–February, March–May, June–August, and September–November. The statistical significance was set at a p-value of <0.05. Bonferroni correction was applied on the p-values for all models.
In sensitivity analyses, the same models were run using logistic regression with the dichotomized EPDS, as well as DSRS as outcome. All models were first run in the BASIC samples, and to investigate if the results found in BASIC could be validated, all models were run using the EPDS assessment at 6 weeks postpartum from the UPPSAT study. Furthermore, the analyses were conducted only including women with previous depression. As a last step, the analyses were also conducted solely including women who had reported allergies.
The statistical analyses were carried out in SPSS version 24 (IBM Corp, Armonk, NY).
3. Results
3.1. Participation rate
The BASIC study has a participation rate of approximately 21%, and the UPPSAT study 60%.
3.2. Background characteristics
The background characteristics of the women are reported in Table 1. Flowcharts of the participants from the BASIC and UPPSAT studies can be seen in Supplementary Fig. 1 and 2, respectively. Briefly, the two study populations were similar in characteristics but the participants in the BASIC study were more highly educated, they were more likely to non-exclusively breastfeed, to have an elective cesarean section, to report previous depression, to have higher EPDS score, and their children were more likely to be admitted to the neonatal intensive care unit. These differences were statistically significant. The prevalence of depressive symptoms using the EPDS was 9.4% at gestational week 32 (BASIC), as well as 13.1% (BASIC) and 11.1% (UPPSAT) at 6 weeks postpartum. According to the DSRS, 5.1% of the women had depressive symptoms 6 weeks postpartum (BASIC).
After Bonferroni correction, none of the meteorological parameters nor air pollen counts were significantly associated with neither EDPS score (Tables 2–4), presence of depressive symptoms using EPDS cut-offs (Supplementary Tables 1, 2, and 4), nor DSRS (Supplementary Table 3). Graphs of the meteorological parameters and air pollen counts in relation to percentage women with depressive symptoms for all years are illustrated in Figs. 1–3. Graphs illustrating the collapsed data from 2010 to 2015 in BASIC are found in Supplementary Figs. 3–6. Prior to the Bonferroni correction, an increased concentration of mugwort pollen, both one week (p = 0.034) and six weeks (p = 0.031) was associated with a in pregnancy, both before and after adjustment for season (Table 2).
In the sensitivity analyses, mean air pollen count of grass seven days prior to the EPDS assessment in pregnancy was positively associated with depressive symptoms (odds ratio (OR) = 1.017; 95% confidence interval (CI): 1.004–1.029) (data not shown). Conversely, the mean number of sunshine hours six weeks before the EPDS assessment in the postpartum group (BASIC) was negatively associated with depressive symptoms (OR = 0.955; 95% CI: 0.920–0.992) (data not shown). After Bonferroni correction, these associations were no longer significant.
4. Discussion
The aim of this study was to examine if meteorological parameters and air pollen counts are associated with self-reported peripartum depressive symptoms in Uppsala, Sweden. Two study populations were used in order to validate results within the same study. This study found no association between maximum temperature, precipitation, snow coverage, sunshine hours or air pollen counts and self-reported peripartum depressive symptoms.
These results support the negative findings of a study investigating the association between postpartum depressive symptoms and length of daylight in more than 67,000 women [Reference Jewell, Dunn, Bondy and Leiferman39]. Conversely, in Finland, the dark time period has been associated with increased odds of postpartum depression [Reference Hiltunen, Jokelainen, Ebeling, Szajnberg and Moilanen38]. The study was, however, limited by a small sample size and addressed mostly season. Furthermore, associations were only found when assessing depressive symptoms at 2–7 days after childbirth, where postpartum blues could have been misclassified as postpartum depression [Reference Hiltunen, Jokelainen, Ebeling, Szajnberg and Moilanen38]. Similarly, a very small sample size limits the strength of the association found between antenatal depressive symptoms and seasonally longer nights [Reference Meliska, Martínez, López, Sorenson, Nowakowski and Kripke40]. In comparison with the above-mentioned studies, the current study has the advantage of using daily and local measurements of sunshine hours.
When investigating the association between meteorological parameters or air pollen counts and depressive symptoms, numerous combinations of parameters and models can be constructed. Relating back to the study that created ‘climatic factors’ [Reference Radua, Pertusa and Cardoner16], it is tempting to do so, as multiple aspects of weather could interplay in the development of depressive symptoms. Nevertheless, a decision was made to not combine parameters or categorize exposure variables in order to get a clearer picture on the impact of the individual meteorological parameters, and to not lose information. The main outcome variable was, nevertheless, tested both as continuous and dichotomized in order to evaluate both the impact on any potential sub-clinical depression and validated cut-offs.
Even before Bonferroni correction, there were limited significant results. After Bonferroni correction, there were no associations between depressive symptoms and exposure to pollen. The inverse association between mugwort pollen and presence of depressive symptoms at gestational week 32, prior to the Bonferroni correction, does contradict our initial hypothesis, but earlier studies on animals are in line with our results. A recent study has reported antidepressant effects of mugwort in mice [Reference Khan, Karim, Ahmad, Abdelhalim and Chebib56]. It should of course be noted that this study examined extracted compounds from the mugwort tree (carnosol, ursolic acid, and oleanolic acid) and not pollen. The authors discussed that these three compounds might exert their antidepressant effect through the GABAergic system. Despite differences in the methodology of the studies, it is interesting that this specific tree has previously been studied in association with depression, and results of both studies point in the same direction. The results of this study are not in line with previous studies conducted on risk of suicide [Reference Postolache, Stiller, Herrell, Goldstein, Shreeram and Zebrak25, Reference Qin, Waltoft, Mortensen and Postolache26]. Apart from suicide and depressive symptoms being different outcomes, albeit associated, the discrepancies could derive from differences in methodology. The current study used continuous data and the above-mentioned studies categorical. Nonetheless, categorical data has also been reported not associated with the outcome [Reference Woo, Gibbons, Rogers, Qin, Kim and Roberts57]. As previously mentioned, the hypothesis on an association between pollen exposure and depressive symptoms is based on the knowledge that pollen, in individuals with allergic rhinitis, causes an immune response. In the BASIC sample, 22.2% of the women reported that they had allergies. However, the phrasing of the question did not separate different types of allergies and it is therefore not possible to know the true percentage of women sensitive to pollen exposure. In addition, there were no data on severity of symptoms. The results remained the same in a sub-analysis only including women with self-reported allergies (data not shown). In the UPPSAT study, there was no question on allergies.
The etiology of peripartum depression is multi-factorial [Reference Schiller, Meltzer-Brody and Rubinow58]. The discrepancies in findings between the current study and previous research on psychiatric disorders could be explained by the unique state of a pregnancy, with vast alterations in hormonal levels [Reference Chrousos, Torpy and Gold59] and inflammatory markers [Reference Luppi, Haluszczak, Trucco and Deloia60, Reference Kraus, Sperling, Engel, Lo, Kellerman and Singh61]. It is not unlikely that such events have a larger impact on the development of peripartum depressive symptoms than meteorological parameters and pollen. Both antenatal and postpartum depressive symptoms have been associated levels of inflammatory markers in late pregnancy in the BASIC population [Reference Edvinsson, Brann, Hellgren, Freyhult, White and Kamali-Moghaddam62, Reference Brann, Papadopoulos, Fransson, White, Edvinsson and Hellgren63].
This is an extensive study that includes data from six years, which has been utilized in such a way that allows for investigation of duration effect. Furthermore, the current study adds new knowledge to the field of peripartum depressive symptoms, by investigating the association with multiple meteorological parameters, as well as air pollen counts. In addition, by including data on participants from both BASIC and UPPSAT, the generated results could be validated within the same study. The weather stations were local, or in the case of the pollen trap, the closest one, which reduced the atmospheric diversity of the exposure on the participants. Lastly, it is a strength that both the EPDS and the DSRS were used. The EPDS is a widely used instrument, both in research and clinical practice, and has been reported to be a good marker of psychiatric morbidity [Reference Wisner, Sit, McShea, Rizzo, Zoretich and Hughes64].
The low participation rate of the BASIC study limits the generalizability of the results. When comparing with the general population, women participating in the BASIC study have higher educational attainment, are older, have more history of previous depression, and they are more likely to be primiparous. Nevertheless, the UPPSAT study had a participation rate of 60%, and the women participating in the study were similar to the general population, although they were more likely to be primiparous. A complementary clinical evaluation would have been valuable to further assess the depressive symptoms of the participants.
5. Conclusion
Meteorological parameters and air pollen count are not associated with self-reported peripartum depressive symptoms in Uppsala, Sweden.
Disclosure of interest
The authors declare that they have no competing interests.
Acknowledgements
This study was funded by the Swedish Research Council to A.S. (Project No. 523-2014-2342), the Swedish Society of Medicine to A.S. and S.S. (Project No. SLS-250581), the Marianne and Marcus Wallenberg Foundation to A.S. (Project No. MMW2011.0115), the Åke-Wiberg Foundation to A.S., the Söderström-Köningska Foundation to A.S. and S.S., Allmänna BBs Minnesfond to A.S., and the Gillbergska Foundation to A.S. The funding sources had no involvement in the study design, the collection, analysis, and interpretation of data, the writing of the report, or the decision to submit the article for publication. The authors would like to thank all women who participated in this study. We would also like to thank Per Nyman at the Swedish University of Agricultural Sciences (SLU) for providing data on meteorological parameters, as well as Kerstin Alm Kübler, previously at the Palynological Laboratory in Stockholm, for help with the acquisition of pollen data. Lastly, we would like to express our gratitude towards Marianne Kördel, Natasa Kollia, and Pepita Knuutila for their valuable help in the administration of this study.
Appendix A. Supplementary data
Supplementary material related to this article can be found, in the online version, at doi:https://doi.org/10.1016/j.eurpsy.2018.06.010.


Comments
No Comments have been published for this article.