


Introduction
Modification of dietary behaviours is fundamental to decreasing the prevalence of non-communicable diseases, which led to 11 million preventable global deaths in 2017(Reference Afshin, Sur, Fay, Cornaby, Ferrara and Salama1). To reduce the risk of diet-related diseases at the population level, national dietary guidelines such as the UK Eatwell Guide(2) and the Australian Dietary Guidelines(3) have been developed. These guidelines promote diets rich in fruits and vegetables while limiting alcohol consumption and foods and drinks high in energy, saturated fat, sugar and sodium. Traditionally, trained health professionals have conducted dietary assessments and provided personalised feedback(Reference Shoneye, Kwasnicka, Mullan, Pollard, Boushey and Kerr4). This feedback, based on an individual’s behaviours, preferences, goals and barriers(Reference Ordovas and Berciano5), is more effective than generic population-based recommendations at encouraging sustained behaviour change(Reference Jinnette, Narita, Manning, McNaughton, Mathers and Livingstone6). While in-person counselling can provide acceptable personalised feedback, it is not feasible on a population level(Reference Block, Block, Wakimoto and Block7). This highlights the need for more accessible options, such as delivery via digital technologies.
Traditional dietary assessment methods and dietary feedback have been digitised using technology, providing advantages such as convenience and scalability(Reference Celis-Morales, Livingstone, Marsaux, Macready, Fallaize and O’Donovan8), as well as reduced researcher costs and burden after the initial development(Reference Forster, Walsh, O’Donovan, Woolhead, McGirr and Daly9). With ubiquitous internet use and mobile devices, the availability of these tools has increased; however, they often focus solely on energy reduction without providing more nuanced feedback(Reference Shoneye, Kwasnicka, Mullan, Pollard, Boushey and Kerr4,Reference Khaylis, Yiaslas, Bergstrom and Gore-Felton10) . For this review, personalised dietary feedback is defined as advice beyond the summation of energy and nutrients and includes the comparison of nutrient intakes to a range of reference values such as dietary guidelines, nutrient reference values, and diet quality indices (DQIs). Personalised feedback extends to statements aimed at increasing food literacy and equipping individuals with the knowledge, skills and actions to make healthier food choices(Reference Silva, Araújo, Lopes and Ray11). In addition, it can assist in achieving goals related to the frequency or quantity of certain foods(Reference Haslam, Baldwin, Pezdirc, Truby, Attia and Hutchesson12).
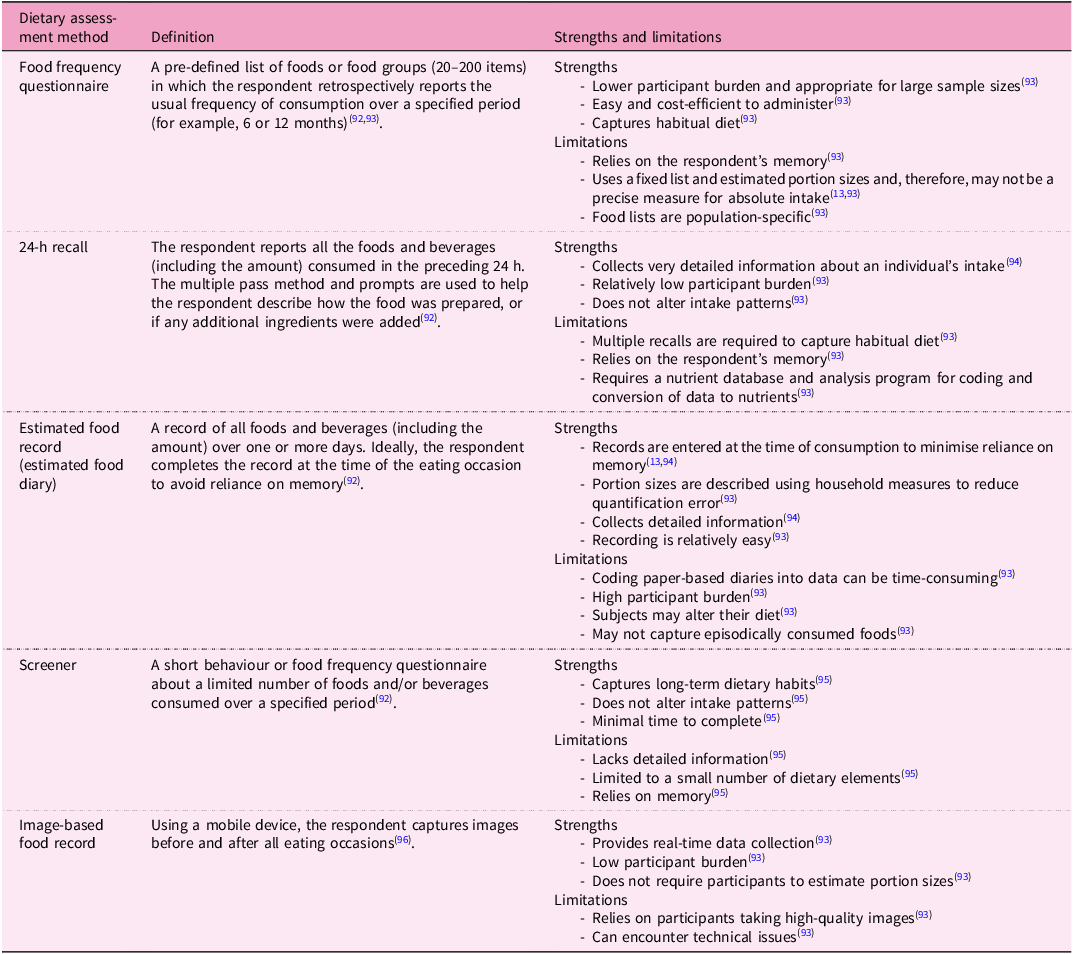
To provide personalised feedback, an accurate measure of dietary intake is essential, although this can be challenging owing to the inherent limitations of self-reported data, including misreporting and recall bias(Reference Bailey13). Dietary assessment methods can be broadly categorised into prospective and retrospective approaches. Prospective methods, such as weighed or estimated food records, require participants to document their intake in real time. Retrospective methods, such as 24-h recalls (24HRs) and food frequency questionnaires (FFQs), involve recalling previously consumed foods (see Table 1 for a summary). When targeted information, such as specific nutrients (for example, sodium) or food groups (for example, fruits and vegetables) is required, screeners can provide a rapid and cost-effective method of assessment(Reference Bailey13). In recent years, dietary assessment methods have been digitised and made accessible through various platforms, including web-based programs, mobile applications (apps), wearable technologies and artificial intelligence (AI) systems embedded with algorithms to provide automated dietary feedback(Reference Rollo, Williams, Burrows, Kirkpatrick, Bucher and Collins14). Technology-based dietary assessment methods can include food and portion size guide images to aid users in estimating their intake(Reference Bradley, Simpson, Poliakov, Matthews, Olivier and Adamson15–Reference Collins, Boggess, Watson, Guest, Duncanson and Pezdirc18), and participants have reported that logging their intake using these tools is easier than traditional paper-based methods(Reference Chambliss, Huber, Finley, McDoniel, Kitzman-Ulrich and Wilkinson19,Reference Franco, Fallaize, Hwang and Lovegrove20) .
Definitions, strengths and limitations of dietary assessment methods commonly adapted for use with digital technologies

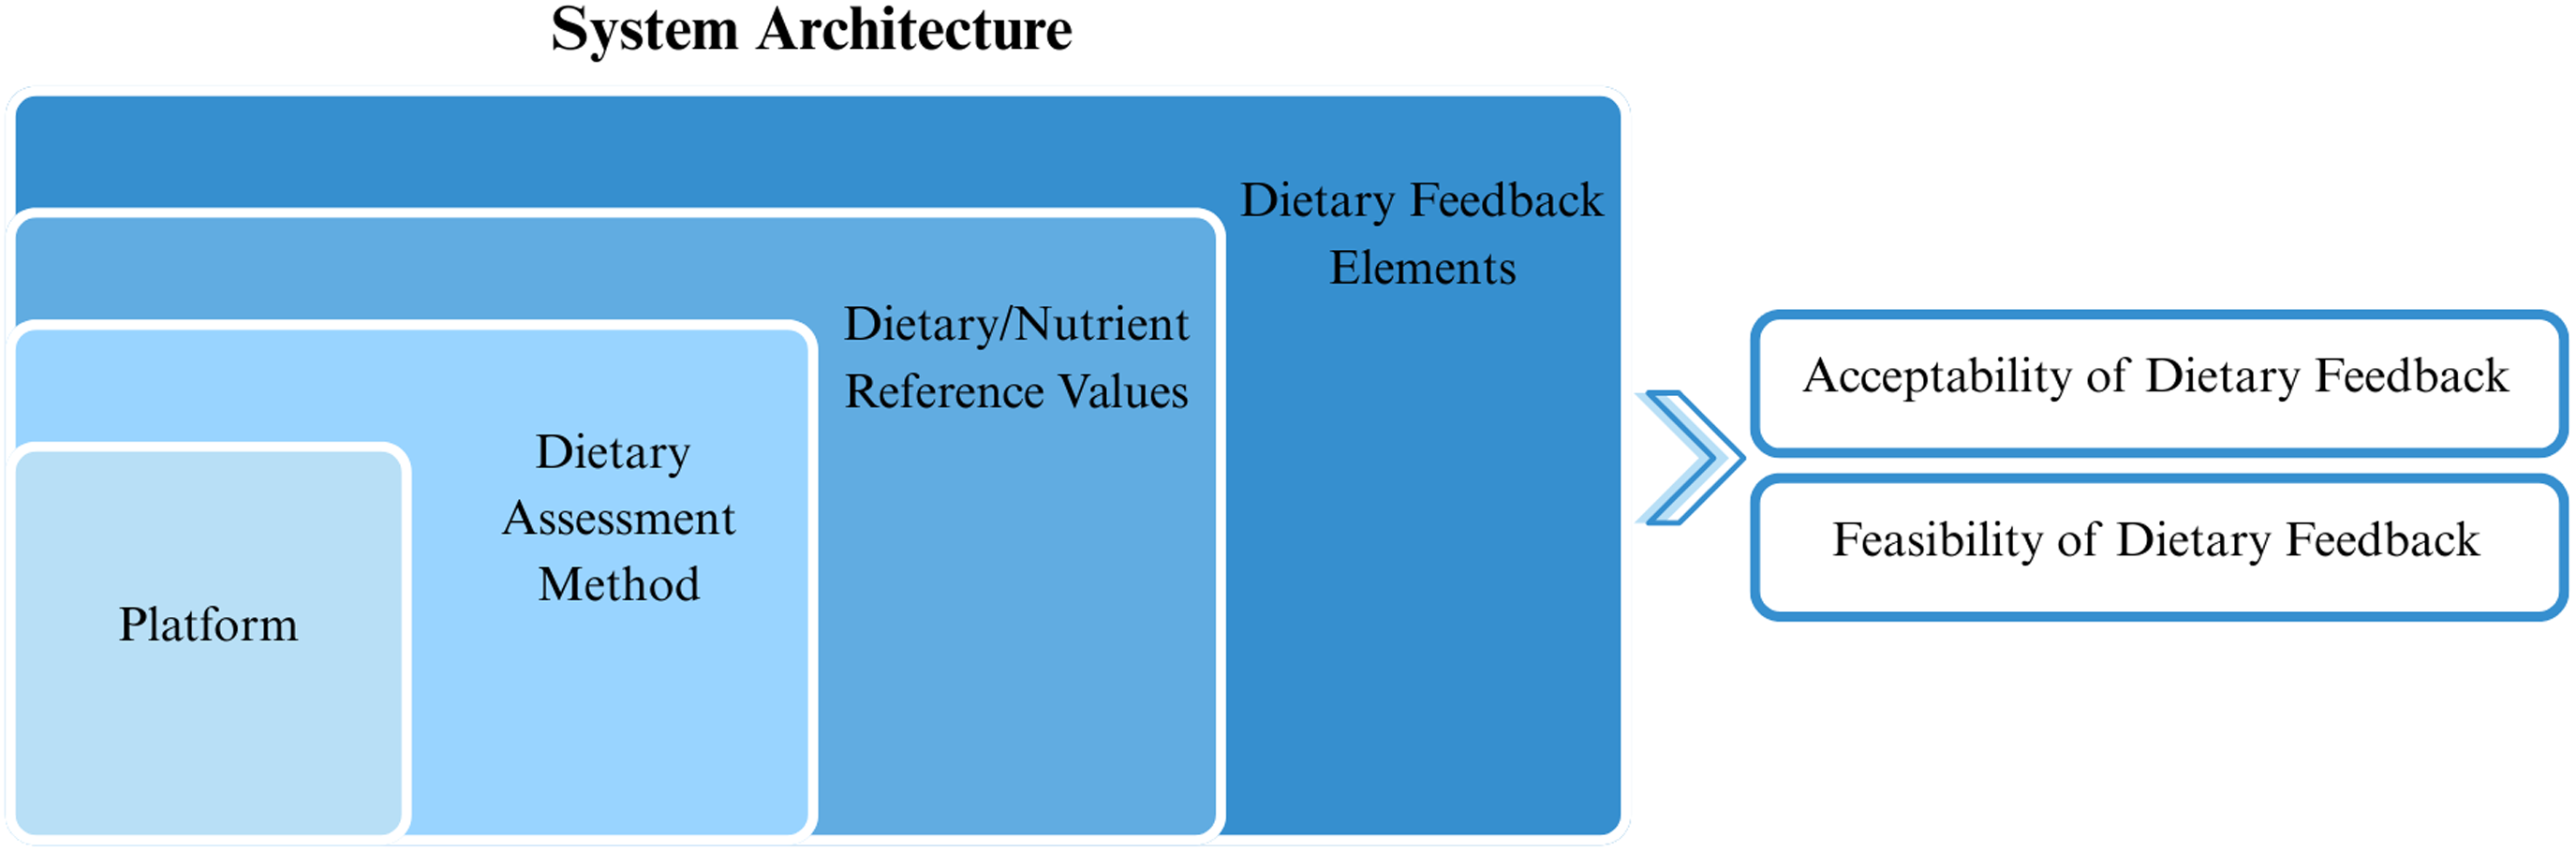
For automated, personalised dietary feedback to be successful, several elements specific to the collection and interpretation of data are required; however, to our knowledge, these have yet to be comprehensively summarised. For this review, the system architecture includes the technology-based platform used to collect the dietary data, the dietary assessment method, the dietary/nutrient reference values used to assess intake and the dietary elements within the feedback (Fig. 1). This systematic literature review aims to: (1) describe the system architecture of automated, personalised dietary feedback and (2) report evaluations of the acceptability and feasibility of dietary feedback provided in the studies. It was not within the scope of this literature review to describe the effectiveness of the dietary feedback or any long-term changes in health outcomes.
Components of the system architecture of automated, personalised dietary feedback.

Methods
This review used the Preferred Reporting Items for Systematic Reviews and Meta-Analyses (PRIMSA 2020) guidelines(Reference Page, McKenzie, Bossuyt, Boutron, Hoffmann and Mulrow21). On 27 February 2023, the protocol was registered with the International Prospective Register of Systematic Reviews (ID: CRD42023402250).
Search strategy
The literature search strategy was developed across four databases using medical subject headings and searching within the title and abstract for words related to dietary assessment methods, digital technologies and feedback (Supplementary File 1). Searches were conducted in OVID Medline (856 results), OVID Embase (2829 results), Scopus via Elsevier (1514 results) and CINAHL plus via EBSCO host (640 results). The search strategy was developed in collaboration with a subject librarian and peer-reviewed by subject experts with no limitations on population age, publication year, language or study design. The initial search was first conducted in March 2023 and last updated in September 2025.
Eligibility criteria and screening
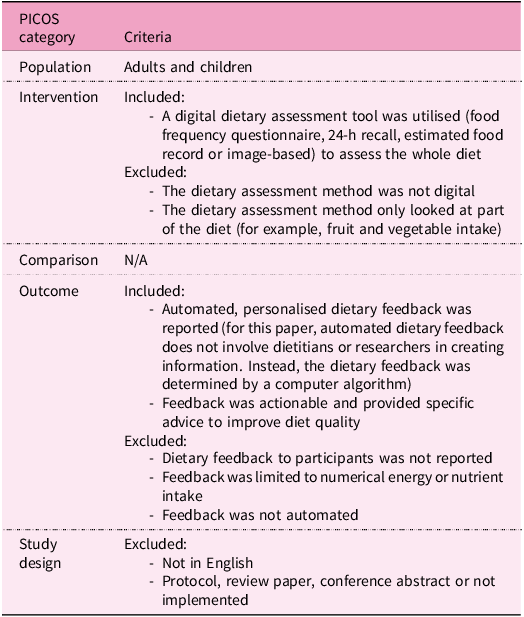
Results were uploaded into Covidence Online Software(22) and duplicates were removed. Independent reviewers (S.L. and T.A.M., K.M., N.S., H.D. or H.N.) screened the title and abstract of all articles against the inclusion and exclusion criteria (Table 2) with 94% agreement. This was followed by a second pass for full texts (S.L. and H.N.) with 91% agreement. Reference lists of included studies were manually examined for relevant papers to ensure literature saturation. Two authors were contacted to clarify questions (one of which was excluded), and conflicts were discussed until a consensus was reached.
Inclusion and exclusion criteria for identifying studies

Data extraction and quality assessment
Data extraction was completed independently by S.L. using a template developed for this review (for example, author, date, platform, dietary assessment method and elements of dietary feedback), and a subset (n = 7) was checked by T.A.M., M.B. and A.D. for consistency. Unless stated by the authors, we have defined acceptability as participant satisfaction (that is, whether the feedback was implemented, useful and met the user’s expectations), while feasibility explores whether the feedback and its delivery/implementation were practical and scalable. Quality assessment was conducted using the Quality Assessment with Diverse Studies (QuADS) appraisal tool(Reference Harrison, Jones, Gardner and Lawton23). The QuADS tool was chosen as it can be applied to a set of methodologically diverse research articles and its previous application to multiple digital and health-related systematic reviews(Reference Harrison, Jones, Gardner and Lawton23–Reference Opie, Esler, Clancy, Wright, Painter and Vuong25). The tool consists of thirteen criteria scored on a scale of 0–3 (0 = not mentioned at all, 3 = explicit or detailed description) covering four domains: research aim(s), research setting and target population, the study design and the analytic method. QuADS does not provide a summative score for each paper; therefore, the quality of the included papers is descriptively reported as the tool intended. All papers were assessed by S.L. and then by a second reviewer (E.L.J., H.N., K.M. and N.S.), and conflicts were resolved through discussion. T.A.M, K.M. and N.S. were not involved in the quality assessment of their publications(Reference Haslam, Baldwin, Pezdirc, Truby, Attia and Hutchesson12,Reference Murakami, Shinozaki, Masayasu and Livingstone26) .
Results
Study selection
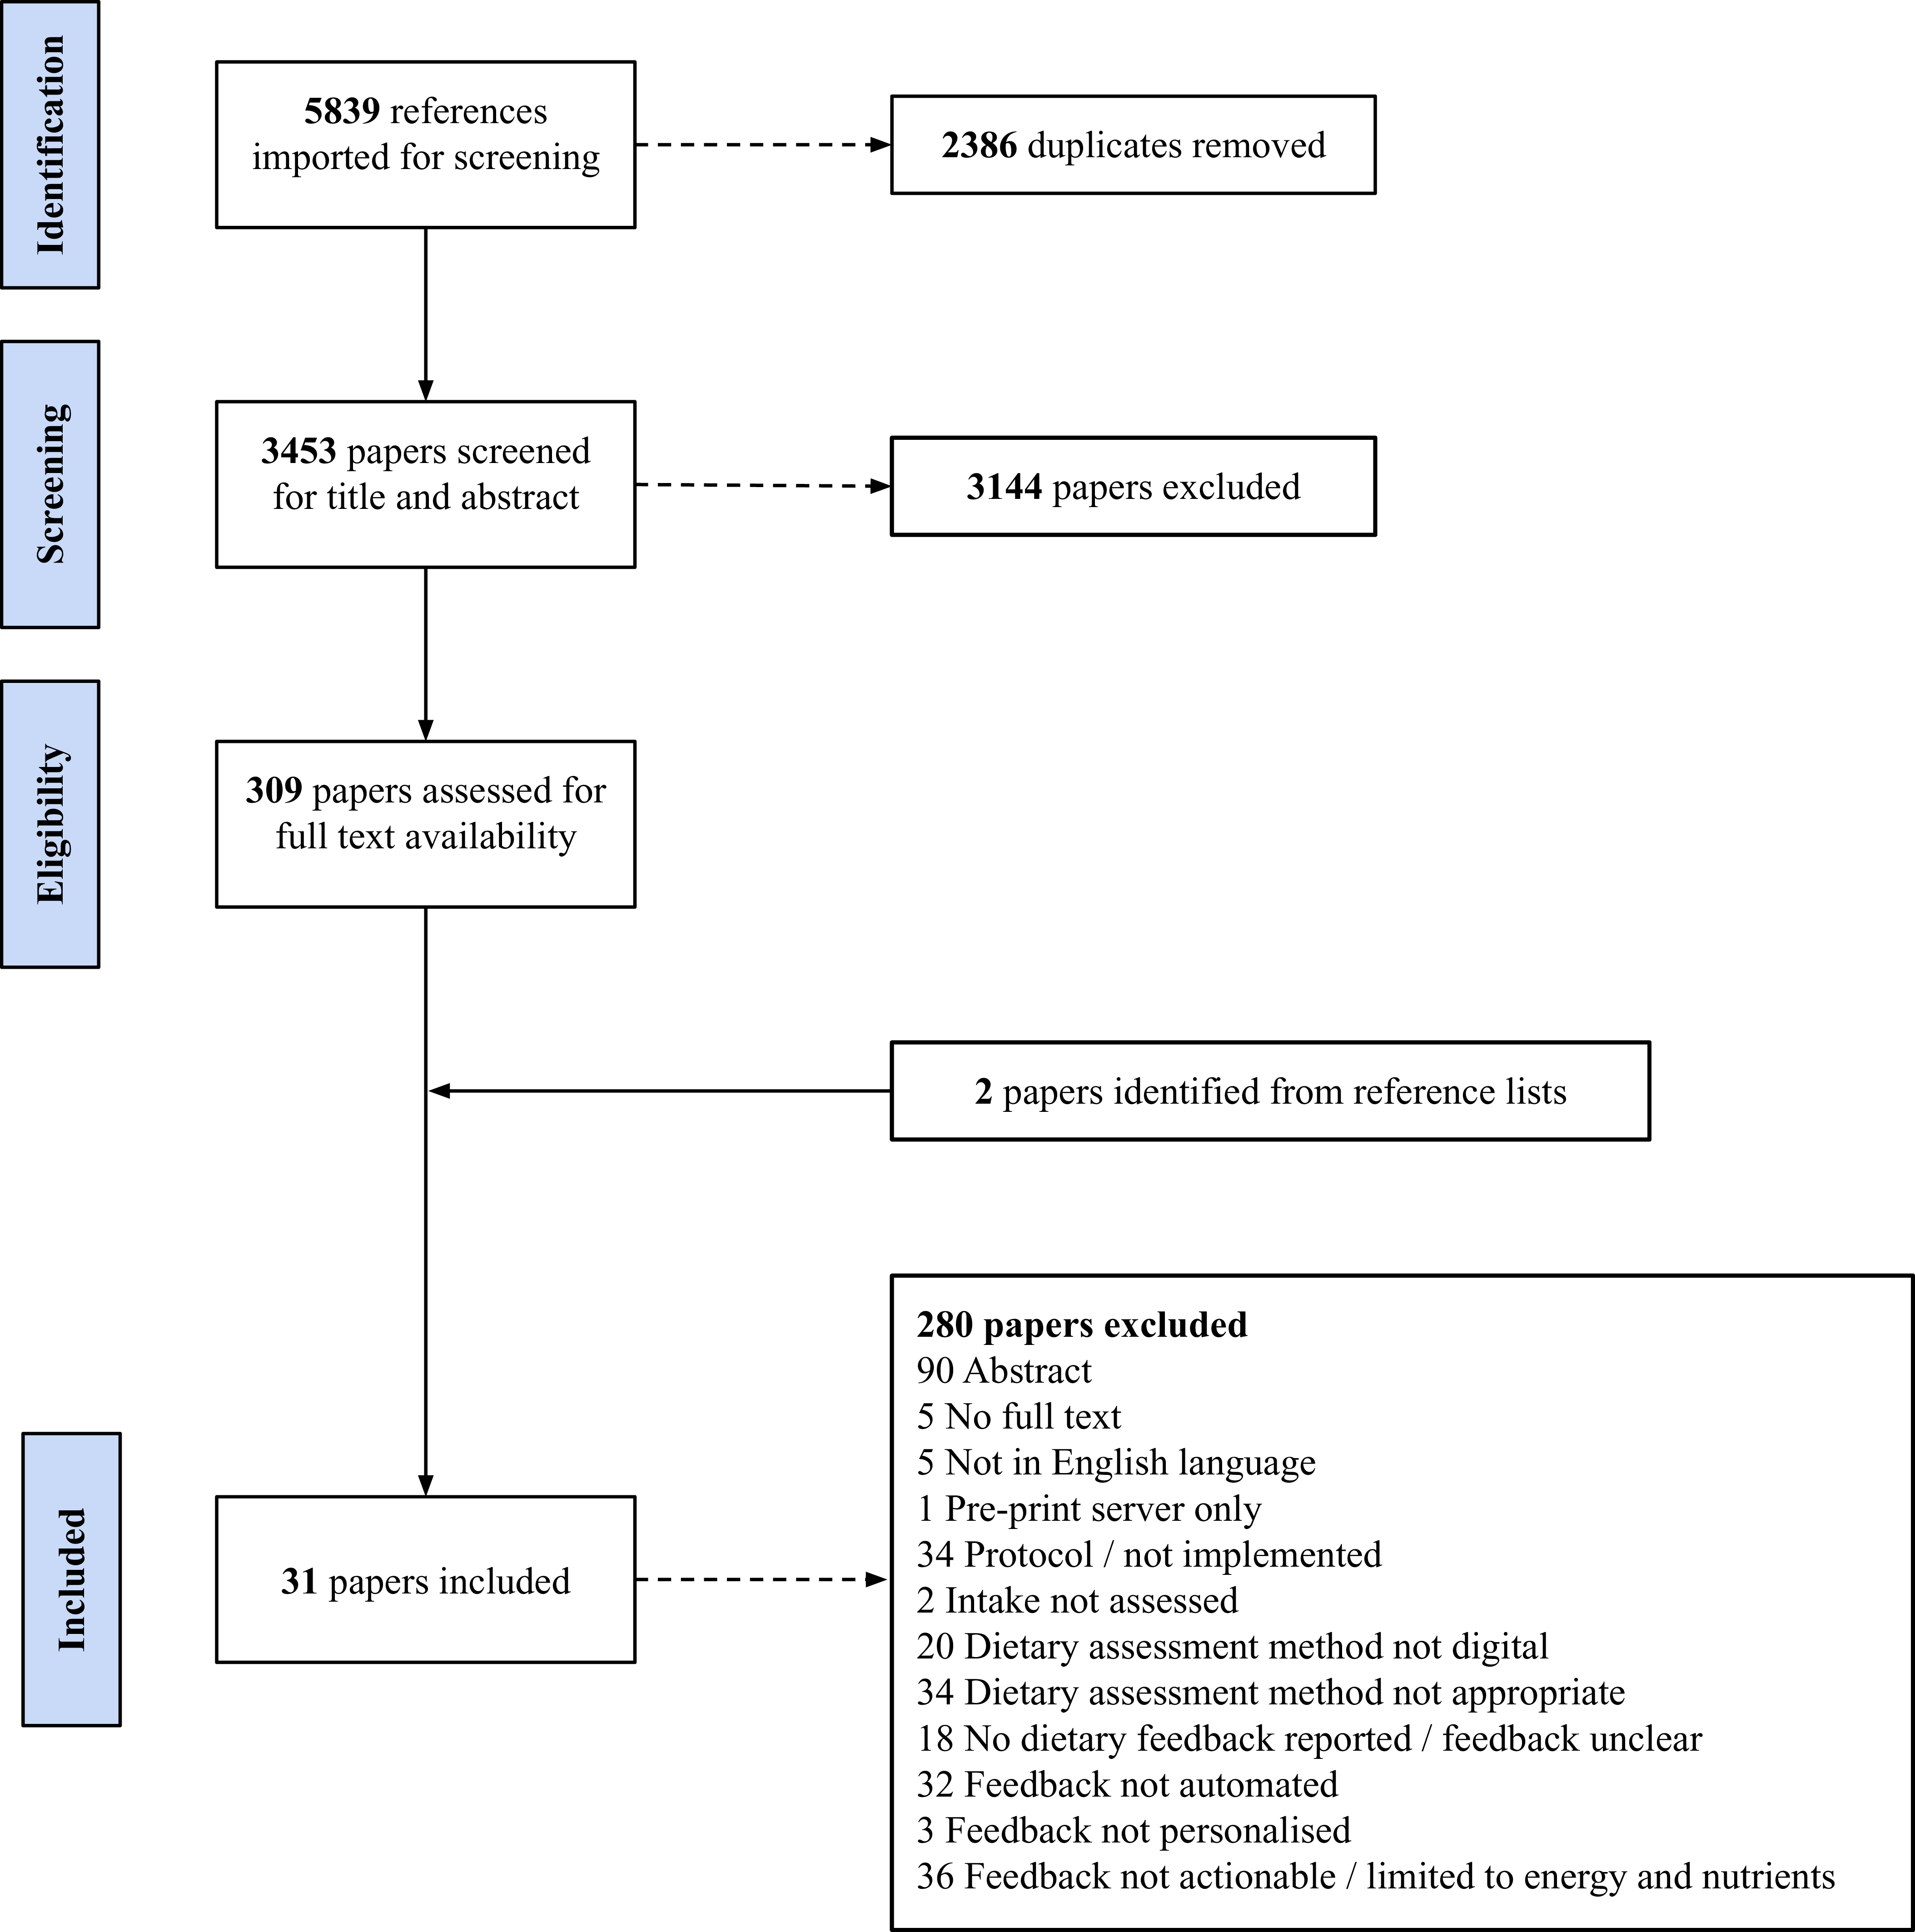
The final search yielded 5839 articles, of which 2386 were duplicates. After screening was completed, thirty-one papers with 301 271 participants, published between 2009 and 2024, were included in the review (Fig. 2). One study was published across two papers(Reference Burke, Styn, Glanz, Ewing, Elci and Conroy27,Reference Burke, Conroy, Sereika, Elci, Styn and Acharya28) and another was published across three papers(Reference Collins, Morgan, Jones, Fletcher, Martin and Aguiar29–Reference Collins, Morgan, Hutchesson and Callister31); therefore, twenty-eight studies were included. Numerous papers were classified as ‘near misses’ during full-text screening as they met all but one criterion. For example, a study with women during pregnancy provided automated, personalised dietary feedback; however, intake of fruits, vegetables, sweets and sugary drinks was assessed by completing five questions every week (screener-style questionnaire)(Reference Sandborg, Söderström, Henriksson, Bendtsen, Henstrom and Leppanen32). Of particular note were multiple publications, primarily from the discipline of computer science, describing the protocol for developing AI-enabled apps that have not yet been implemented. Other studies also provided personalised dietary feedback, although the process was not automated and was manually derived using decision trees(Reference Celis-Morales, Livingstone, Marsaux, Forster, O’Donovan and Woolhead33–Reference Livingstone, Celis-Morales, Navas-Carretero, San-Cristobal, Forster and Woolhead36). An RCT to evaluate a behaviour change app for physical activity and diet provided automated dietary feedback, although this was limited to energy intake(Reference Rabbi, Pfammatter, Zhang, Spring and Choudhury37). A summary of the excluded studies can be found in Supplementary File 2.
Preferred Reporting Items for Systematic Reviews and Meta-Analyses flow diagram.

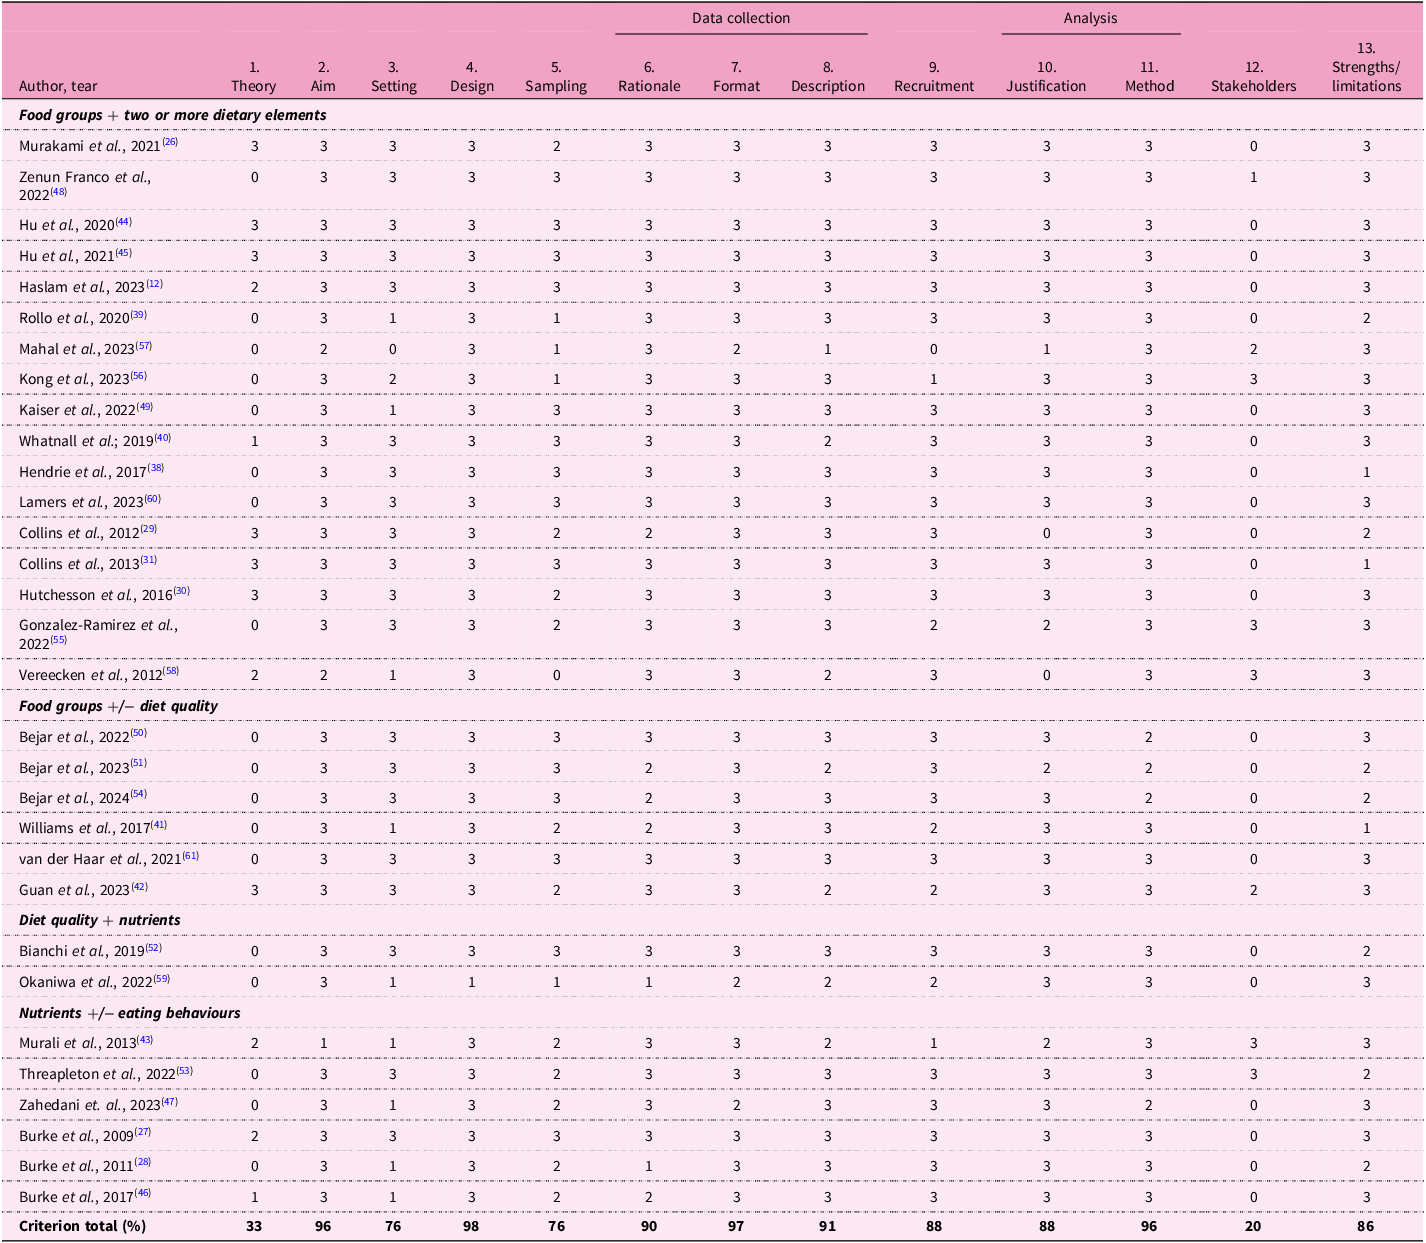
Quality assessment using the QuADS tool
Overall, the quality of the included papers was high (Table 3). The highest scoring categories across all papers were: appropriate study design (98%), appropriate format and content of data collection tools (97%), appropriate method of analysis (96%), and a clear statement of research aim/s (96%). On the basis of the information provided in the included papers, the majority performed poorly, with a 0 score across two categories: evidence of stakeholder consideration in research design and conduct (n = 24, 77%) and theoretical or conceptual underpinning to the research (n = 18, 58%).
Results from the quality assessment with diverse studies (QuADS) appraisal tool for included papers(Reference Harrison, Jones, Gardner and Lawton23)

Scores range from 0 (low) to 3 (high).
Totals are calculated as a percentage of the total possible score for each criterion.
QuADS criteria.
(1) Theoretical or conceptual underpinning to the research. (2) Statement of research aim(s). (3) Clear description of research setting and target population. (4) The study design is appropriate to address the stated research aim/s. (5) Appropriate sampling to address the research aim(s). (6) Rationale for choice of data collection tool(s). (7) The format and content of data collection tool is appropriate to address the stated research aim(s). (8) Description of data collection procedure. (9) Recruitment data provided. (10) Justification for analytic method selected. (11) The method of analysis was appropriate to answer the research aim(s). (12) Evidence that the research stakeholders have been considered in research design or conduct. (13) Strengths and limitations critically discussed.
Study characteristics
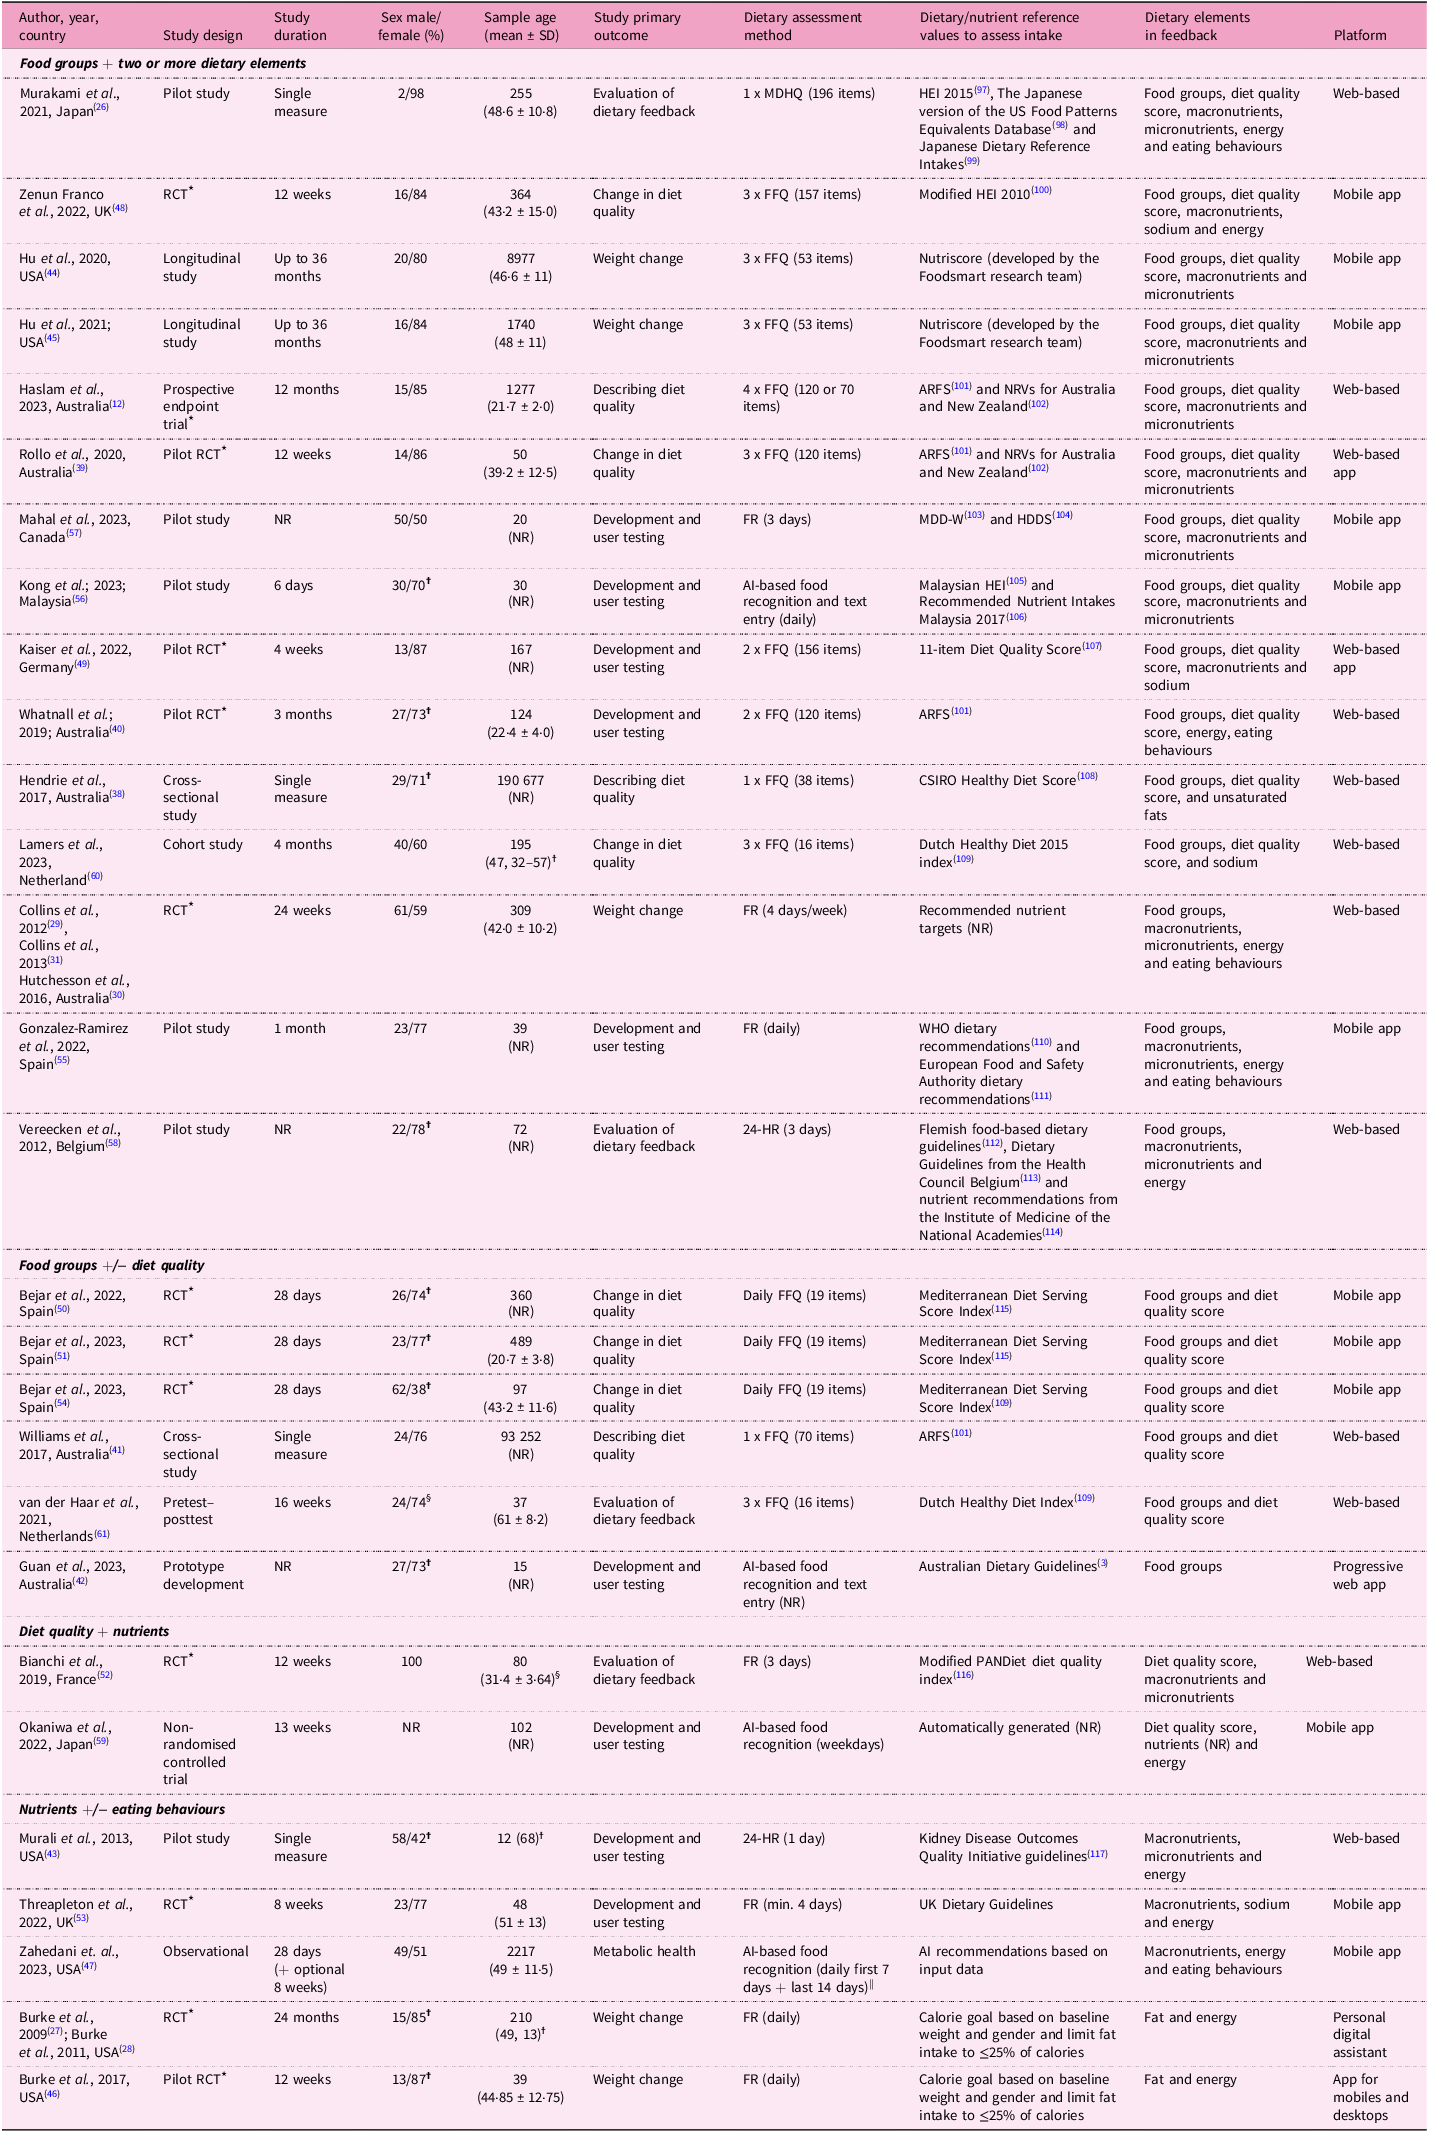
A summary of the characteristics of the included studies is presented in Table 4 and grouped by the elements included in the dietary feedback (discussed below). The majority of studies were from high-income countries (n = 27, 96%), with nearly half from Australia (n = 7, 25%)(Reference Haslam, Baldwin, Pezdirc, Truby, Attia and Hutchesson12,Reference Collins, Morgan, Jones, Fletcher, Martin and Aguiar29–Reference Collins, Morgan, Hutchesson and Callister31,Reference Hendrie, Baird, Golley and Noakes38–Reference Guan, Zhou, Wan, Zhou, Zhang and Zhang42) and the USA (n = 6, 21%)(Reference Burke, Styn, Glanz, Ewing, Elci and Conroy27,Reference Burke, Conroy, Sereika, Elci, Styn and Acharya28,Reference Murali, Arab, Vargas, Rastogi, Ang and Shetty43–Reference Zahedani, McLaughlin, Veluvali, Aghaeepour, Hosseinian and Agarwal47) . A wide range of study designs were included, with the largest being randomised controlled trials (RCTs) (n = 12, 43%)(Reference Burke, Styn, Glanz, Ewing, Elci and Conroy27–Reference Collins, Morgan, Hutchesson and Callister31,Reference Rollo, Haslam and Collins39,Reference Whatnall, Patterson, Chiu, Oldmeadow and Hutchesson40,Reference Burke, Zheng, Ma, Mancino, Loar and Music46,Reference Zenun Franco, Fallaize, Weech, Hwang and Lovegrove48–Reference Béjar, Mesa-Rodríguez and García-Perea54) , of which four were pilot studies(Reference Rollo, Haslam and Collins39,Reference Whatnall, Patterson, Chiu, Oldmeadow and Hutchesson40,Reference Burke, Zheng, Ma, Mancino, Loar and Music46,Reference Kaiser, Stelzl, Finglas and Gedrich49) , followed by non-randomised pilot studies (n = 6, 21%)(Reference Murakami, Shinozaki, Masayasu and Livingstone26,Reference Murali, Arab, Vargas, Rastogi, Ang and Shetty43,Reference Gonzalez-Ramirez, Cejudo-Lopez, Lozano-Navarrete, Salamero Sánchez-Gabriel, Torres-Bengoa and Segura-Balbuena55–Reference Vereecken, Covents, Maes and Moyson58) . Study duration ranged from a one-off measurement of diet(Reference Murakami, Shinozaki, Masayasu and Livingstone26,Reference Hendrie, Baird, Golley and Noakes38,Reference Williams, Rollo, Schumacher and Collins41,Reference Murali, Arab, Vargas, Rastogi, Ang and Shetty43) to a longitudinal study for 36 months(Reference Hu, Nguyen, Langheier and Shurney44,Reference Hu, Pasupuleti, Nguyen, Langheier and Shurney45) . For ease of synthesis, the reported primary outcomes were categorised across six domains. Development and user testing was the most common (n = 9, 32%)(Reference Whatnall, Patterson, Chiu, Oldmeadow and Hutchesson40,Reference Guan, Zhou, Wan, Zhou, Zhang and Zhang42,Reference Murali, Arab, Vargas, Rastogi, Ang and Shetty43,Reference Kaiser, Stelzl, Finglas and Gedrich49,Reference Threapleton, Beer, Foley, Gibson, Trevillion and Burke53,Reference Gonzalez-Ramirez, Cejudo-Lopez, Lozano-Navarrete, Salamero Sánchez-Gabriel, Torres-Bengoa and Segura-Balbuena55–Reference Mahal, Kucha, Kwofie and Ngadi57,Reference Okaniwa and Yoshida59) , followed by change in diet quality (n = 6, 21%)(Reference Rollo, Haslam and Collins39,Reference Zenun Franco, Fallaize, Weech, Hwang and Lovegrove48,Reference Béjar, García-Perea and Mesa-Rodríguez50,Reference Béjar, Mesa-Rodríguez, Quintero-Flórez, Ramírez-Alvarado del and García-Perea51,Reference Béjar, Mesa-Rodríguez and García-Perea54,Reference Lamers, van Erp, Slotegraaf, Groenen, de Roos and Wahab60) , weight change (n = 5, 18%)(Reference Burke, Styn, Glanz, Ewing, Elci and Conroy27–Reference Hutchesson, Tan, Morgan, Callister and Collins30,Reference Hu, Nguyen, Langheier and Shurney44–Reference Burke, Zheng, Ma, Mancino, Loar and Music46) , evaluating the dietary feedback (n = 4, 14%)(Reference Murakami, Shinozaki, Masayasu and Livingstone26,Reference Bianchi, Mariotti, Lluch, Journet, Stehr and Beaussier52,Reference Vereecken, Covents, Maes and Moyson58,Reference van der Haar, Hoevenaars, van den Brink, Van Den Broek, Timmer and Boorsma61) , cross-sectional descriptions of diet quality (n = 3, 11%)(Reference Haslam, Baldwin, Pezdirc, Truby, Attia and Hutchesson12,Reference Hendrie, Baird, Golley and Noakes38,Reference Williams, Rollo, Schumacher and Collins41) and change in metabolic health (n = 1, 4%)(Reference Zahedani, McLaughlin, Veluvali, Aghaeepour, Hosseinian and Agarwal47).
Study characteristics and system architecture of automated, personalised dietary feedback grouped by the elements of dietary feedback

MDHQ, Meal-based diet history questionnaire; HEI, Healthy Eating Index; app, application; RCT, randomised controlled trial; FFQ, Food Frequency Questionnaire; ARFS, Australian Recommended Food Score; NRVs, nutrient reference values; NR, not reported; FR, food record; CSIRO, Commonwealth Scientific and Industrial Research Organisation; WHO, World Health Organisation; 24-HR, 24-h recall.
* Participants were randomised.
✝ Gender.
☨ Median and interquartile range.
§ Completers only.
|| Described as ‘easy food logging with photo scan, barcode, voice, or search across a 54M+ food database’ Accessed: https://www.january.ai/app.
See Supplementary File 3 for further details on the dietary feedback components.
System architecture of automated, personalised dietary feedback
Platform
Multiple platforms were utilised, with web-based (including web-based apps and progressive web apps) the most prevalent (n = 14, 50%)(Reference Haslam, Baldwin, Pezdirc, Truby, Attia and Hutchesson12,Reference Murakami, Shinozaki, Masayasu and Livingstone26,Reference Collins, Morgan, Jones, Fletcher, Martin and Aguiar29–Reference Collins, Morgan, Hutchesson and Callister31,Reference Hendrie, Baird, Golley and Noakes38–Reference Murali, Arab, Vargas, Rastogi, Ang and Shetty43,Reference Kaiser, Stelzl, Finglas and Gedrich49,Reference Bianchi, Mariotti, Lluch, Journet, Stehr and Beaussier52,Reference Vereecken, Covents, Maes and Moyson58,Reference Lamers, van Erp, Slotegraaf, Groenen, de Roos and Wahab60,Reference van der Haar, Hoevenaars, van den Brink, Van Den Broek, Timmer and Boorsma61) followed by mobile apps (n = 12, 43%)(Reference Hu, Nguyen, Langheier and Shurney44,Reference Hu, Pasupuleti, Nguyen, Langheier and Shurney45,Reference Zahedani, McLaughlin, Veluvali, Aghaeepour, Hosseinian and Agarwal47,Reference Zenun Franco, Fallaize, Weech, Hwang and Lovegrove48,Reference Béjar, García-Perea and Mesa-Rodríguez50,Reference Béjar, Mesa-Rodríguez, Quintero-Flórez, Ramírez-Alvarado del and García-Perea51,Reference Threapleton, Beer, Foley, Gibson, Trevillion and Burke53–Reference Mahal, Kucha, Kwofie and Ngadi57,Reference Okaniwa and Yoshida59) , and one study each for apps for mobiles and desktops(Reference Burke, Zheng, Ma, Mancino, Loar and Music46) and personal digital assistant (n = 1, 4%)(Reference Burke, Styn, Glanz, Ewing, Elci and Conroy27,Reference Burke, Conroy, Sereika, Elci, Styn and Acharya28) .
Dietary assessment method
Dietary assessment methods varied, with the data collection ranging from a single measure of dietary intake(Reference Murakami, Shinozaki, Masayasu and Livingstone26,Reference Hendrie, Baird, Golley and Noakes38,Reference Williams, Rollo, Schumacher and Collins41,Reference Murali, Arab, Vargas, Rastogi, Ang and Shetty43) to daily for 24 months(Reference Burke, Styn, Glanz, Ewing, Elci and Conroy27,Reference Burke, Conroy, Sereika, Elci, Styn and Acharya28) . The most common method was an FFQ (n = 14, 50%), with 19 to 157 items(Reference Haslam, Baldwin, Pezdirc, Truby, Attia and Hutchesson12,Reference Hendrie, Baird, Golley and Noakes38–Reference Williams, Rollo, Schumacher and Collins41,Reference Hu, Nguyen, Langheier and Shurney44,Reference Hu, Pasupuleti, Nguyen, Langheier and Shurney45,Reference Zenun Franco, Fallaize, Weech, Hwang and Lovegrove48–Reference Béjar, Mesa-Rodríguez, Quintero-Flórez, Ramírez-Alvarado del and García-Perea51,Reference Lamers, van Erp, Slotegraaf, Groenen, de Roos and Wahab60,Reference van der Haar, Hoevenaars, van den Brink, Van Den Broek, Timmer and Boorsma61) , followed by FR (n = 7, 25%), with records ranging from 3 days to daily for 24 months(Reference Burke, Styn, Glanz, Ewing, Elci and Conroy27–Reference Collins, Morgan, Hutchesson and Callister31,Reference Burke, Zheng, Ma, Mancino, Loar and Music46,Reference Bianchi, Mariotti, Lluch, Journet, Stehr and Beaussier52,Reference Threapleton, Beer, Foley, Gibson, Trevillion and Burke53,Reference Gonzalez-Ramirez, Cejudo-Lopez, Lozano-Navarrete, Salamero Sánchez-Gabriel, Torres-Bengoa and Segura-Balbuena55,Reference Mahal, Kucha, Kwofie and Ngadi57) . AI-based image recognition was utilised in four studies (14%), ranging from 4 days to 13 weeks(Reference Guan, Zhou, Wan, Zhou, Zhang and Zhang42,Reference Kong, Moy, Ong, Tahir and Loo56,Reference Okaniwa and Yoshida59) , with two of these incorporating text entry(Reference Guan, Zhou, Wan, Zhou, Zhang and Zhang42,Reference Kong, Moy, Ong, Tahir and Loo56) and one with text, barcode and voice searching(Reference Zahedani, McLaughlin, Veluvali, Aghaeepour, Hosseinian and Agarwal47). Multiple or single 24HR (n = 2, 7%)(Reference Murali, Arab, Vargas, Rastogi, Ang and Shetty43,Reference Vereecken, Covents, Maes and Moyson58) and a single meal-based diet history questionnaire (MDHQ) (n = 1, 4%)(Reference Murakami, Shinozaki, Masayasu and Livingstone26) were also included. Of the included studies, fifteen (54%) sent reminders to complete the dietary assessment, with ten reminding participants before the due date(Reference Haslam, Baldwin, Pezdirc, Truby, Attia and Hutchesson12,Reference Zahedani, McLaughlin, Veluvali, Aghaeepour, Hosseinian and Agarwal47–Reference Bianchi, Mariotti, Lluch, Journet, Stehr and Beaussier52,Reference Béjar, Mesa-Rodríguez and García-Perea54,Reference Mahal, Kucha, Kwofie and Ngadi57,Reference Vereecken, Covents, Maes and Moyson58) , and the remainder being sent once the due date had passed(Reference Burke, Styn, Glanz, Ewing, Elci and Conroy27–Reference Collins, Morgan, Hutchesson and Callister31,Reference Burke, Zheng, Ma, Mancino, Loar and Music46,Reference Lamers, van Erp, Slotegraaf, Groenen, de Roos and Wahab60,Reference Whatnall, Clarke, Adam, Ashton, Burrows and Hutchesson62) .
Dietary/nutrient reference values
Studies analysed specific elements of the diet against dietary/nutrient reference values as per the inclusion criteria. These values included DQIs (n = 14, 50%)(Reference Hendrie, Baird, Golley and Noakes38,Reference Whatnall, Patterson, Chiu, Oldmeadow and Hutchesson40,Reference Williams, Rollo, Schumacher and Collins41,Reference Hu, Nguyen, Langheier and Shurney44,Reference Hu, Pasupuleti, Nguyen, Langheier and Shurney45,Reference Zenun Franco, Fallaize, Weech, Hwang and Lovegrove48–Reference Bianchi, Mariotti, Lluch, Journet, Stehr and Beaussier52,Reference Béjar, Mesa-Rodríguez and García-Perea54,Reference Mahal, Kucha, Kwofie and Ngadi57,Reference Lamers, van Erp, Slotegraaf, Groenen, de Roos and Wahab60,Reference van der Haar, Hoevenaars, van den Brink, Van Den Broek, Timmer and Boorsma61) , a combination of a DQI and nutrient reference values (n = 4, 14%)(Reference Haslam, Baldwin, Pezdirc, Truby, Attia and Hutchesson12,Reference Murakami, Shinozaki, Masayasu and Livingstone26,Reference Rollo, Haslam and Collins39,Reference Kong, Moy, Ong, Tahir and Loo56) , national dietary guidelines (n = 3, 11%)(Reference Guan, Zhou, Wan, Zhou, Zhang and Zhang42,Reference Threapleton, Beer, Foley, Gibson, Trevillion and Burke53,Reference Gonzalez-Ramirez, Cejudo-Lopez, Lozano-Navarrete, Salamero Sánchez-Gabriel, Torres-Bengoa and Segura-Balbuena55) , national dietary guidelines combined with nutrient reference values (n = 1, 4%)(Reference Vereecken, Covents, Maes and Moyson58) and disease-specific guidelines (n = 1, 4%)(Reference Murali, Arab, Vargas, Rastogi, Ang and Shetty43). One study assigned recommended nutrient targets to the participants, although the reference range was unclear(Reference Collins, Morgan, Jones, Fletcher, Martin and Aguiar29–Reference Collins, Morgan, Hutchesson and Callister31), and two studies used baseline weight and gender to determine energy and subsequent fat intake(Reference Burke, Styn, Glanz, Ewing, Elci and Conroy27,Reference Burke, Conroy, Sereika, Elci, Styn and Acharya28,Reference Burke, Zheng, Ma, Mancino, Loar and Music46) . A study in Japan utilised an AI-based system that analysed meal images, automatically registered the food and calculated a dietary evaluation score(Reference Okaniwa and Yoshida59), with another study incorporating AI-based recommendations(Reference Zahedani, McLaughlin, Veluvali, Aghaeepour, Hosseinian and Agarwal47). Dietary/Nutrient Reference values are outlined in Table 4.
Dietary elements in personalised feedback
Personalised dietary feedback included a combination of food groups (n = 21, 75%)(Reference Haslam, Baldwin, Pezdirc, Truby, Attia and Hutchesson12,Reference Murakami, Shinozaki, Masayasu and Livingstone26,Reference Collins, Morgan, Jones, Fletcher, Martin and Aguiar29–Reference Collins, Morgan, Hutchesson and Callister31,Reference Hendrie, Baird, Golley and Noakes38–Reference Guan, Zhou, Wan, Zhou, Zhang and Zhang42,Reference Hu, Nguyen, Langheier and Shurney44,Reference Hu, Pasupuleti, Nguyen, Langheier and Shurney45,Reference Zenun Franco, Fallaize, Weech, Hwang and Lovegrove48–Reference Béjar, Mesa-Rodríguez, Quintero-Flórez, Ramírez-Alvarado del and García-Perea51,Reference Béjar, Mesa-Rodríguez and García-Perea54–Reference Vereecken, Covents, Maes and Moyson58,Reference Lamers, van Erp, Slotegraaf, Groenen, de Roos and Wahab60,Reference van der Haar, Hoevenaars, van den Brink, Van Den Broek, Timmer and Boorsma61) , macronutrients (n = 19, 68%)(Reference Haslam, Baldwin, Pezdirc, Truby, Attia and Hutchesson12,Reference Murakami, Shinozaki, Masayasu and Livingstone26–Reference Collins, Morgan, Hutchesson and Callister31,Reference Hendrie, Baird, Golley and Noakes38,Reference Rollo, Haslam and Collins39,Reference Murali, Arab, Vargas, Rastogi, Ang and Shetty43–Reference Burke, Zheng, Ma, Mancino, Loar and Music46,Reference Zenun Franco, Fallaize, Weech, Hwang and Lovegrove48,Reference Kaiser, Stelzl, Finglas and Gedrich49,Reference Bianchi, Mariotti, Lluch, Journet, Stehr and Beaussier52,Reference Threapleton, Beer, Foley, Gibson, Trevillion and Burke53,Reference Gonzalez-Ramirez, Cejudo-Lopez, Lozano-Navarrete, Salamero Sánchez-Gabriel, Torres-Bengoa and Segura-Balbuena55–Reference Vereecken, Covents, Maes and Moyson58) , a diet quality score (n = 19, 68%)(Reference Haslam, Baldwin, Pezdirc, Truby, Attia and Hutchesson12,Reference Murakami, Shinozaki, Masayasu and Livingstone26,Reference Hendrie, Baird, Golley and Noakes38–Reference Williams, Rollo, Schumacher and Collins41,Reference Hu, Nguyen, Langheier and Shurney44,Reference Hu, Pasupuleti, Nguyen, Langheier and Shurney45,Reference Zenun Franco, Fallaize, Weech, Hwang and Lovegrove48–Reference Bianchi, Mariotti, Lluch, Journet, Stehr and Beaussier52,Reference Béjar, Mesa-Rodríguez and García-Perea54,Reference Kong, Moy, Ong, Tahir and Loo56,Reference Mahal, Kucha, Kwofie and Ngadi57,Reference Okaniwa and Yoshida59–Reference van der Haar, Hoevenaars, van den Brink, Van Den Broek, Timmer and Boorsma61) , micronutrients (n = 16, 57%)(Reference Haslam, Baldwin, Pezdirc, Truby, Attia and Hutchesson12,Reference Murakami, Shinozaki, Masayasu and Livingstone26–Reference Collins, Morgan, Hutchesson and Callister31,Reference Rollo, Haslam and Collins39,Reference Murali, Arab, Vargas, Rastogi, Ang and Shetty43–Reference Burke, Zheng, Ma, Mancino, Loar and Music46,Reference Zenun Franco, Fallaize, Weech, Hwang and Lovegrove48,Reference Kaiser, Stelzl, Finglas and Gedrich49,Reference Bianchi, Mariotti, Lluch, Journet, Stehr and Beaussier52,Reference Threapleton, Beer, Foley, Gibson, Trevillion and Burke53,Reference Gonzalez-Ramirez, Cejudo-Lopez, Lozano-Navarrete, Salamero Sánchez-Gabriel, Torres-Bengoa and Segura-Balbuena55–Reference Vereecken, Covents, Maes and Moyson58,Reference Lamers, van Erp, Slotegraaf, Groenen, de Roos and Wahab60) and energy (n = 12, 43%)(Reference Murakami, Shinozaki, Masayasu and Livingstone26–Reference Hutchesson, Tan, Morgan, Callister and Collins30,Reference Whatnall, Patterson, Chiu, Oldmeadow and Hutchesson40,Reference Murali, Arab, Vargas, Rastogi, Ang and Shetty43,Reference Burke, Zheng, Ma, Mancino, Loar and Music46,Reference Zenun Franco, Fallaize, Weech, Hwang and Lovegrove48,Reference Threapleton, Beer, Foley, Gibson, Trevillion and Burke53,Reference Gonzalez-Ramirez, Cejudo-Lopez, Lozano-Navarrete, Salamero Sánchez-Gabriel, Torres-Bengoa and Segura-Balbuena55,Reference Vereecken, Covents, Maes and Moyson58,Reference Okaniwa and Yoshida59) . Other elements included high-risk eating behaviours and non-hungry eating triggers(Reference Collins, Morgan, Jones, Fletcher, Martin and Aguiar29–Reference Collins, Morgan, Hutchesson and Callister31), meal occasions(Reference Gonzalez-Ramirez, Cejudo-Lopez, Lozano-Navarrete, Salamero Sánchez-Gabriel, Torres-Bengoa and Segura-Balbuena55), breakfast consumption(Reference Whatnall, Clarke, Adam, Ashton, Burrows and Hutchesson62), meal frequency and frequency of food items(Reference Murakami, Shinozaki, Masayasu and Livingstone26), and the glycaemic index of foods(Reference Zahedani, McLaughlin, Veluvali, Aghaeepour, Hosseinian and Agarwal47). One study did not specify which nutrients were assessed(Reference Okaniwa and Yoshida59), and some studies only looked at a specific macro or micronutrient, such as total fat(Reference Burke, Styn, Glanz, Ewing, Elci and Conroy27,Reference Burke, Conroy, Sereika, Elci, Styn and Acharya28,Reference Burke, Zheng, Ma, Mancino, Loar and Music46) , unsaturated fat(Reference Hendrie, Baird, Golley and Noakes38) and sodium(Reference Zenun Franco, Fallaize, Weech, Hwang and Lovegrove48,Reference Kaiser, Stelzl, Finglas and Gedrich49,Reference Threapleton, Beer, Foley, Gibson, Trevillion and Burke53,Reference Lamers, van Erp, Slotegraaf, Groenen, de Roos and Wahab60) . For ease of synthesis, findings were grouped into four categories: food groups plus two or more dietary elements (n = 15, 54%)(Reference Haslam, Baldwin, Pezdirc, Truby, Attia and Hutchesson12,Reference Murakami, Shinozaki, Masayasu and Livingstone26,Reference Collins, Morgan, Jones, Fletcher, Martin and Aguiar29–Reference Collins, Morgan, Hutchesson and Callister31,Reference Hendrie, Baird, Golley and Noakes38,Reference Rollo, Haslam and Collins39,Reference Hu, Pasupuleti, Nguyen, Langheier and Shurney45,Reference Zenun Franco, Fallaize, Weech, Hwang and Lovegrove48,Reference Kaiser, Stelzl, Finglas and Gedrich49,Reference Gonzalez-Ramirez, Cejudo-Lopez, Lozano-Navarrete, Salamero Sánchez-Gabriel, Torres-Bengoa and Segura-Balbuena55–Reference Vereecken, Covents, Maes and Moyson58,Reference Lamers, van Erp, Slotegraaf, Groenen, de Roos and Wahab60,Reference Whatnall, Clarke, Adam, Ashton, Burrows and Hutchesson62,Reference Hu, Lin, Chiwanda Kaminga and Xu63) , food groups plus or minus diet quality (n = 6, 21%)(Reference Williams, Rollo, Schumacher and Collins41,Reference Guan, Zhou, Wan, Zhou, Zhang and Zhang42,Reference Béjar, García-Perea and Mesa-Rodríguez50,Reference Béjar, Mesa-Rodríguez, Quintero-Flórez, Ramírez-Alvarado del and García-Perea51,Reference Béjar, Mesa-Rodríguez and García-Perea54,Reference van der Haar, Hoevenaars, van den Brink, Van Den Broek, Timmer and Boorsma61) , diet quality plus nutrients (n = 2, 7%)(Reference Bianchi, Mariotti, Lluch, Journet, Stehr and Beaussier52,Reference Okaniwa and Yoshida59) and nutrients plus or minus eating behaviours (n = 5, 18%)(Reference Burke, Styn, Glanz, Ewing, Elci and Conroy27,Reference Burke, Conroy, Sereika, Elci, Styn and Acharya28,Reference Murali, Arab, Vargas, Rastogi, Ang and Shetty43,Reference Burke, Zheng, Ma, Mancino, Loar and Music46,Reference Zahedani, McLaughlin, Veluvali, Aghaeepour, Hosseinian and Agarwal47,Reference Threapleton, Beer, Foley, Gibson, Trevillion and Burke53) . The majority (14/19, 74%) of the studies that provided a diet quality score utilised an FFQ for their dietary assessment method(Reference Haslam, Baldwin, Pezdirc, Truby, Attia and Hutchesson12,Reference Hendrie, Baird, Golley and Noakes38–Reference Williams, Rollo, Schumacher and Collins41,Reference Hu, Nguyen, Langheier and Shurney44,Reference Hu, Pasupuleti, Nguyen, Langheier and Shurney45,Reference Zenun Franco, Fallaize, Weech, Hwang and Lovegrove48–Reference Béjar, Mesa-Rodríguez, Quintero-Flórez, Ramírez-Alvarado del and García-Perea51,Reference Béjar, Mesa-Rodríguez and García-Perea54,Reference Lamers, van Erp, Slotegraaf, Groenen, de Roos and Wahab60,Reference van der Haar, Hoevenaars, van den Brink, Van Den Broek, Timmer and Boorsma61) , whereas the remaining five used an FR(Reference Bianchi, Mariotti, Lluch, Journet, Stehr and Beaussier52,Reference Mahal, Kucha, Kwofie and Ngadi57) , image-based method(Reference Kong, Moy, Ong, Tahir and Loo56,Reference Okaniwa and Yoshida59) or MDHQ(Reference Murakami, Shinozaki, Masayasu and Livingstone26).
Messaging structure of personalised dietary feedback
Dietary feedback was presented to participants using several approaches. For example, a pilot RCT using an FFQ summarised foods into the categories: ‘foods to boost, foods to try, foods to reduce, foods to keep eating and foods to keep avoiding’(Reference Kaiser, Stelzl, Finglas and Gedrich49), and an RCT using an FR sent daily text messages such as ‘Nice job limiting fats; might want to limit sweets/candy this afternoon’(Reference Burke, Styn, Glanz, Ewing, Elci and Conroy27,Reference Burke, Conroy, Sereika, Elci, Styn and Acharya28) . A cohort study also using an FFQ provided a diet quality score with messaging about specific foods, such as ‘You barely or do not eat nuts, there is room for improvement’(Reference Lamers, van Erp, Slotegraaf, Groenen, de Roos and Wahab60). Similarly, a non-randomised RCT using AI-based food recognition provided a meal balance score with information on how to increase the score, for example, ‘Your meal balance score is 50. Your calorie intake is insufficient. In terms of nutritional balance, you are particularly deficient in protein and carbohydrates. For your next meal, please increase your overall food intake, focusing on meat and fish. Be sure to include 1 serving of bread or rice’(Reference Okaniwa and Yoshida59). Other studies using FFQs gave advice on the basis of the three lowest components of their score(Reference Hendrie, Baird, Golley and Noakes38,Reference Zenun Franco, Fallaize, Weech, Hwang and Lovegrove48) . A study in Japan that piloted feedback with dietitians following the completion of an MDHQ provided a comprehensive report with personalised messages regarding meal frequency and food alternatives to improve intake based on top contributors, for example, ‘Your major food source of salt is salt-based seasonings such as salt, soy sauce, and miso. Try to use smaller amounts of salt-based seasonings. Swap salt-based seasonings for lemon juice, vinegar, spices, and herbs. Select low-salt seasonings whenever possible’(Reference Murakami, Shinozaki, Masayasu and Livingstone26). A summary of the dietary feedback from each study can be found in Supplementary File 3.
Dietitian/researcher input
In addition to the automated dietary feedback, eight studies (29%) involved the dietitian or researcher at various stages, including telephone 24HRs to monitor adherence(Reference Burke, Styn, Glanz, Ewing, Elci and Conroy27,Reference Burke, Conroy, Sereika, Elci, Styn and Acharya28,Reference Mahal, Kucha, Kwofie and Ngadi57) , provision of additional annotated dietary feedback at meetings(Reference Burke, Styn, Glanz, Ewing, Elci and Conroy27,Reference Burke, Conroy, Sereika, Elci, Styn and Acharya28) , dietetic appointments or phone calls to discuss the automated feedback(Reference Bianchi, Mariotti, Lluch, Journet, Stehr and Beaussier52,Reference van der Haar, Hoevenaars, van den Brink, Van Den Broek, Timmer and Boorsma61) , providing education on the automated recommended goals(Reference Burke, Zheng, Ma, Mancino, Loar and Music46) and phone or video calls to discuss or review goals(Reference Haslam, Baldwin, Pezdirc, Truby, Attia and Hutchesson12,Reference Threapleton, Beer, Foley, Gibson, Trevillion and Burke53) . Seven studies (25%) also reported the dietitian/researcher conducting quality checks of the dietary data for misreporting or implausible values(Reference Murakami, Shinozaki, Masayasu and Livingstone26,Reference Zenun Franco, Fallaize, Weech, Hwang and Lovegrove48–Reference Bianchi, Mariotti, Lluch, Journet, Stehr and Beaussier52,Reference Béjar, Mesa-Rodríguez and García-Perea54) (Supplementary File 3).
Acceptability of the automated, personalised dietary feedback
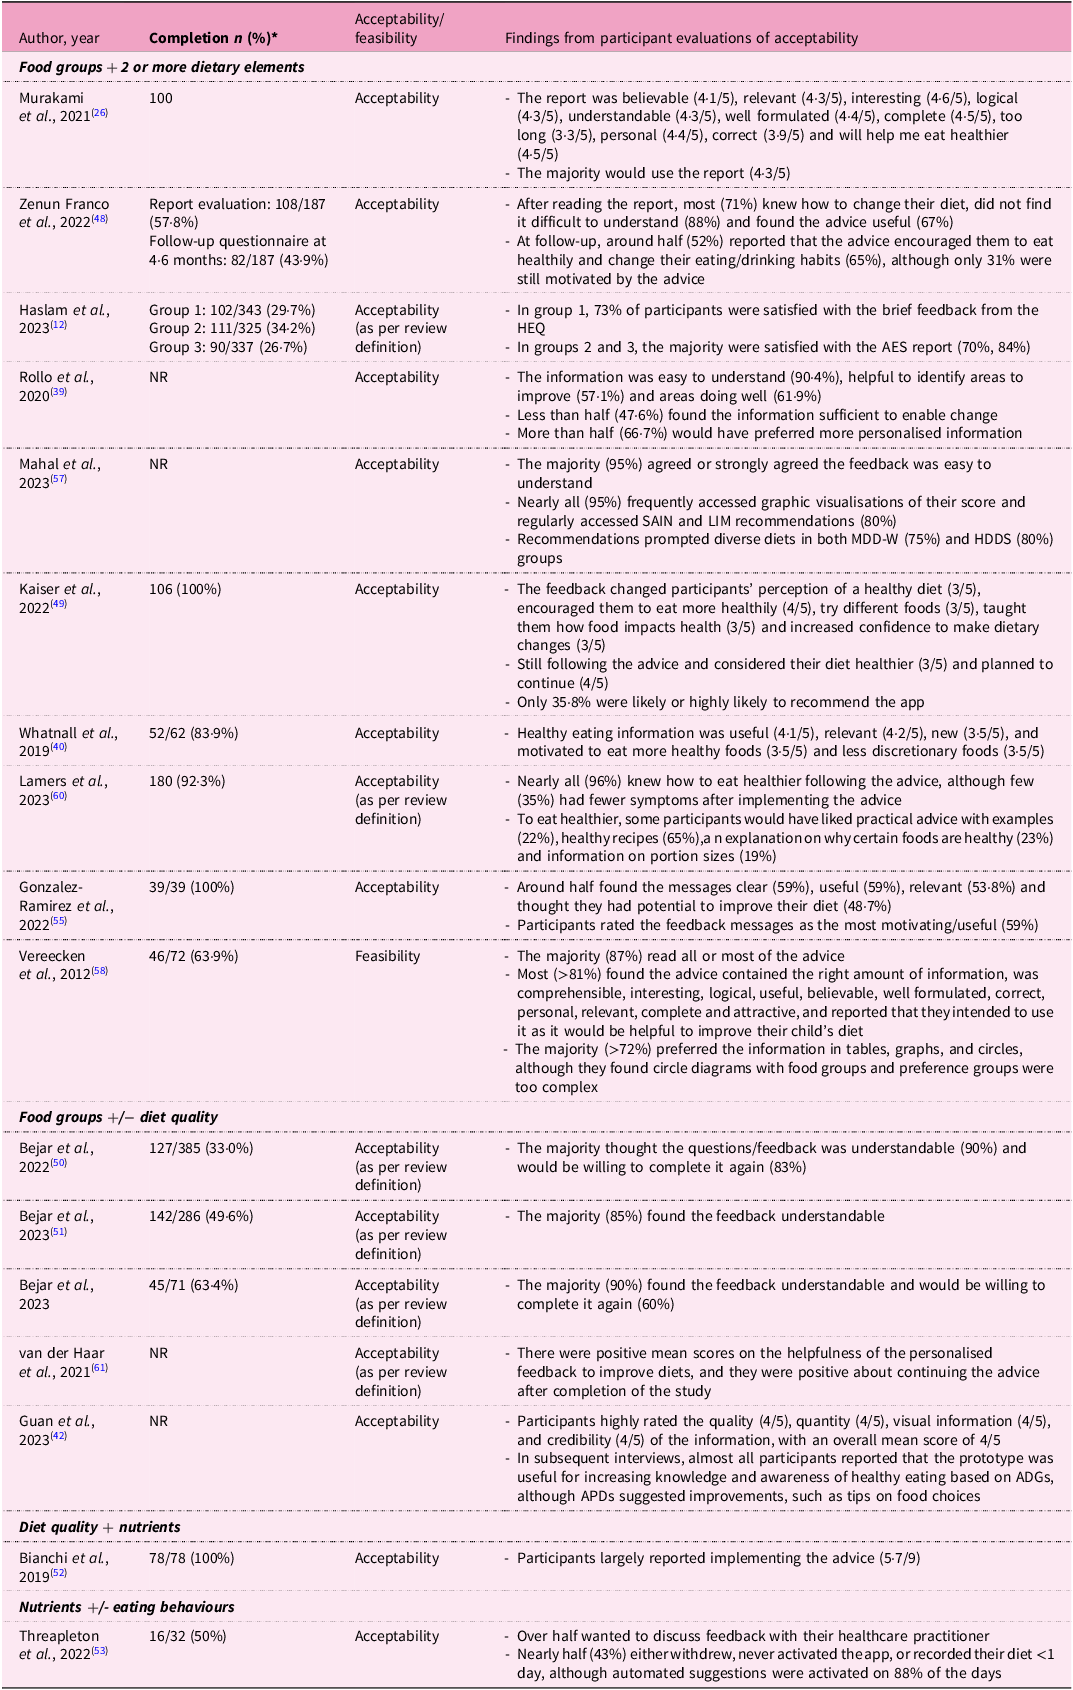
The majority (n = 17, 61%) of the studies described an evaluation of the acceptability of the dietary feedback(Reference Haslam, Baldwin, Pezdirc, Truby, Attia and Hutchesson12,Reference Murakami, Shinozaki, Masayasu and Livingstone26,Reference Rollo, Haslam and Collins39,Reference Guan, Zhou, Wan, Zhou, Zhang and Zhang42,Reference Zenun Franco, Fallaize, Weech, Hwang and Lovegrove48–Reference Mahal, Kucha, Kwofie and Ngadi57,Reference Lamers, van Erp, Slotegraaf, Groenen, de Roos and Wahab60–Reference Whatnall, Clarke, Adam, Ashton, Burrows and Hutchesson62) (Table 5). Of the participants who completed the studies, the number who completed acceptability evaluations ranged from 26·7%(Reference Haslam, Baldwin, Pezdirc, Truby, Attia and Hutchesson12) to 100%(Reference Murakami, Shinozaki, Masayasu and Livingstone26,Reference Kaiser, Stelzl, Finglas and Gedrich49,Reference Bianchi, Mariotti, Lluch, Journet, Stehr and Beaussier52,Reference Gonzalez-Ramirez, Cejudo-Lopez, Lozano-Navarrete, Salamero Sánchez-Gabriel, Torres-Bengoa and Segura-Balbuena55) . The method of measuring acceptability varied, with usability questionnaires being the most frequently used (n = 7, 25%)(Reference Kaiser, Stelzl, Finglas and Gedrich49–Reference Béjar, Mesa-Rodríguez, Quintero-Flórez, Ramírez-Alvarado del and García-Perea51,Reference Threapleton, Beer, Foley, Gibson, Trevillion and Burke53–Reference Kong, Moy, Ong, Tahir and Loo56) (Supplementary File 3). Results varied across the studies, with each assessing a different aspect of acceptability. For example, an RCT of Australian young adults found that although engagement was poor and only 28% of participants visited the Australian Eating Survey feedback report, those who did found the advice motivating (70%), relevant (76%), personalised (76%) and helped them make changes to their eating habits (67%)(Reference Haslam, Baldwin, Pezdirc, Truby, Attia and Hutchesson12). Similarly, an RCT of adults in the UK reported that 88% of participants who completed the evaluation did not have difficulty understanding the report, 71% knew how to change their diet following the dietary feedback and 67% found the advice useful(Reference Zenun Franco, Fallaize, Weech, Hwang and Lovegrove48). This was also the only study that reported a follow-up assessment (44% completion) in which 52% of these participants agreed the advice encouraged them to eat more healthily, 65% changed their eating/drinking habits and only 31% claimed the advice was still motivating them to improve their diet approximately 6 months after the study had ended(Reference Zenun Franco, Fallaize, Weech, Hwang and Lovegrove48). A pilot study in Germany reported that all participants completed their evaluation and, on average, 36% would likely or highly likely recommend the app(Reference Kaiser, Stelzl, Finglas and Gedrich49). Despite this, 45% of the personalised nutrition group did not like the recommended foods, and 28% reported that the foods did not fit into their usual meal plans or recipes(Reference Kaiser, Stelzl, Finglas and Gedrich49). A formative evaluation of the feedback component of an online nutrition instrument reported that 87% of parents of school-aged children found the dietary feedback informative, comprehensible, interesting and relevant, and reported that they intended to use it(Reference Vereecken, Covents, Maes and Moyson58); however, this was defined as feasibility by the authors. Further details of each study can be found in Table 4.
Findings on the participant acceptability of personalised dietary feedback

NR, not reported; HEQ, Healthy Eating Quiz; AES, Australian Eating Survey; MDD-W, minimum dietary diversity for women; HDDS, Household Dietary Diversity Score; ADGs, Australian Dietary Guidelines; APDs, accredited practising dietitians.
* Participants who completed acceptability evaluations and also completed the study.
Feasibility of the automated, personalised dietary feedback
Only four (14%) studies evaluated the feasibility of dietary feedback in terms of practicality and scalability(Reference Burke, Zheng, Ma, Mancino, Loar and Music46,Reference Kaiser, Stelzl, Finglas and Gedrich49,Reference Vereecken, Covents, Maes and Moyson58,Reference Okaniwa and Yoshida59) , although one study used what we described as acceptability and was reported above(Reference Vereecken, Covents, Maes and Moyson58). Of the three remaining studies, the RCT of adults in the UK encountered technical difficulties in delivering dietary feedback. Initially, only 30–60% of the messages were successfully delivered, increasing to 70–80% in the latter part of the trial. Owing to these issues, participants had to uninstall and reinstall their software, which resulted in them not receiving messages for several days(Reference Burke, Zheng, Ma, Mancino, Loar and Music46). An intervention in Japan found that a combination of AI and human interaction had the highest retention rates and greatest weight loss, although the authors discussed the need to examine the associated time and cost of resources with human interventions(Reference Okaniwa and Yoshida59). A pilot study in Germany also described associated expenses, reporting that across groups, 31% would not pay anything for the eNutri app, and 56% would only pay between €0·50 and €2·50, with no significant differences between the control and personalised nutrition groups(Reference Kaiser, Stelzl, Finglas and Gedrich49).
Discussion
Findings from this systematic review highlight the heterogeneity of the components of the system architecture for automated, personalised dietary feedback systems. Web-based platforms were the most common, with tools predominantly utilising FFQs. Diets were commonly assessed against a DQI, and feedback was provided on food groups, often combined with a diet quality score derived from the DQI, or macronutrient analysis. Participants generally responded positively to the feedback; however, completion rates for acceptability questionnaires were low or not reported in the results, and feasibility was rarely assessed. These findings underscore the potential of digital technologies to provide personalised feedback, but also highlight critical reporting gaps in engagement, evaluation and technical implementation that must be addressed to optimise effectiveness in real-world settings.
As technology has advanced, dietary assessment has transitioned from in-person and paper-based methods to rapidly evolving digital platforms that utilise AI-based image recognition and recommendations. For example, the PDA used by Burke et al. (Reference Burke, Styn, Glanz, Ewing, Elci and Conroy27,Reference Burke, Conroy, Sereika, Elci, Styn and Acharya28) is now obsolete and has been replaced with web and mobile platforms, as seen in the subsequent study(Reference Burke, Zheng, Ma, Mancino, Loar and Music46). Web-based platforms were the most prevalent across studies (n = 14, 50%), broadening the reach and avoiding the need to install software. Mobile health apps were also commonly used across the included studies (n = 12, 43%), likely owing to the widespread adoption of smartphones over the past 15 years(64) with inbuilt reminders/alerts and monitoring functionalities(Reference Siegler, Knox, Bauermeister, Golinkoff, Hightow-Weidman and Hyman65). Developing mobile apps requires substantial costs and ongoing resources for updates and maintenance(Reference Siegler, Knox, Bauermeister, Golinkoff, Hightow-Weidman and Hyman65). In contrast, web-based platforms can now be accessed across numerous devices without requiring installation and regular updates, providing researchers with a more sustainable long-term alternative(Reference Turner-McGrievy, Hales, Schoffman, Valafar, Brazendale and Weaver66). For instance, the CSIRO Healthy Diet Score survey was accessed by participants through a website and, at the time of the original publication, had provided personalised messages to over 190 000 users(Reference Hendrie, Baird, Golley and Noakes38). Although no included studies compared the use of mobile versus web apps, achieving similarly high levels of engagement through a mobile app may be more challenging, as users are unlikely to download an app unless they perceive it to offer clear advantages to existing ones in an already saturated market(Reference Siegler, Knox, Bauermeister, Golinkoff, Hightow-Weidman and Hyman65). This review included four studies that used AI-based tools. It is worth noting that the use of AI-based image recognition and dietary recommendations predates the 2022 explosion of generative AI. Comprehensive scoping and systematic reviews highlight the use of AI to reduce participant and healthcare/researcher burden by improving data collection and processing efficiency and by supporting personalised nutrition recommendations in real time(Reference Ngo, Mekhail, Chan, Li, Yin and Choi67–Reference Cofre, Sanchez, Quezada-Figueroa and López-Cortés69). There are concerns about the accuracy and validity of AI-based tools, including the use of low-quality training datasets, which may result in recommendations that are not reflective of certain genders, ethnicities or sociodemographic groups(Reference Theodore Armand, Nfor, Kim and Kim70).
Capturing detailed data through dietary assessment methods ensures the feedback is relevant and effective at guiding behaviour change(Reference Bailey13,Reference Lustria, Noar, Cortese, Van Stee, Glueckauf and Lee71) . Similar to our findings, FFQs were the most utilised dietary assessment in a systematic literature review describing digital dietary interventions to promote healthy behaviour change in adolescents(Reference Melo, Santo, Mas Clavel, Bosque Prous, Koehler and Vidal-Alaball72). This is likely because of potential lower participant burden, suitability for large sample sizes and ability to assess habitual intake(Reference Bailey13,73) . While FFQs can simplify data processing and automated feedback generation, they do not capture behavioural or contextual aspects of eating unless specific questions are asked(73). This is particularly important as meal timing(Reference Phoi and Keogh74), portion sizes(Reference Flieh, Miguel-Berges, Huybrechts, Breidenassel, Grammatikaki and Donne75) and preparation methods(Reference Bailey13) influence diet quality and can be provided as practical solutions to support dietary improvements. Among the included studies, only one using an FFQ incorporated an additional question to quantify how many days per week the participants consumed breakfast(Reference Whatnall, Patterson, Chiu, Oldmeadow and Hutchesson40). This could explain why in another study using only an FFQ, less than half of the participants found the feedback sufficient to make dietary changes, and more than half wanted more personalised information(Reference Rollo, Haslam and Collins39). Although dietary assessment methods such as 24HR and FR are less effective at capturing episodically consumed foods, they can collect detailed contextual and behavioural information(Reference Bailey13,76,77) . Despite nine (32%) of the included studies utilising a 24HR or FR, only two provided feedback on eating behaviours, including the frequency of eating occasions and non-hungry triggers(Reference Collins, Morgan, Jones, Fletcher, Martin and Aguiar29–Reference Collins, Morgan, Hutchesson and Callister31,Reference Gonzalez-Ramirez, Cejudo-Lopez, Lozano-Navarrete, Salamero Sánchez-Gabriel, Torres-Bengoa and Segura-Balbuena55) . This may have contributed to only half of the participants finding the feedback relevant and useful in a study that did not include these elements(Reference Gonzalez-Ramirez, Cejudo-Lopez, Lozano-Navarrete, Salamero Sánchez-Gabriel, Torres-Bengoa and Segura-Balbuena55). Leveraging the detailed behavioural or contextual data captured by 24HR and FR to provide feedback provides an opportunity for future research. Whilst the selection of the dietary assessment method is dependent on the study outcomes, studies may consider using multiple 24HR or FRs in conjunction with an FFQ to minimise the limitations of each instrument(Reference Carroll, Midthune, Subar, Shumakovich, Freedman and Thompson78). Where not already captured, studies may also benefit from including behavioural and contextual elements to produce nuanced feedback, ultimately increasing the potential for behaviour change.
Derived from a DQI, diet quality scores provide an overall assessment of the diet, often based on the alignment with the dietary guidelines from the country in which it was developed, with a lower score indicating an association with poorer health outcomes(Reference Wirt and Collins79–Reference Ocké81). DQIs were the most commonly used dietary reference value across nineteen (68%) studies, providing a quantitative measure of diet quality. A systematic review of DQIs in RCTs found that they are effective at detecting a change in diet quality over time in interventions aimed at improving diet quality in adults with and without chronic health conditions(Reference McAuley, MacLaughlin, Hannan-Jones, King and Ross82). However, another review showed that DQIs often do not accommodate vegan or vegetarian diets, highlighting the need for indices to be more inclusive of diverse cultural patterns, especially given the global focus for more plant-based diets(Reference Tan, Cheung, McAuley, Ross and MacLaughlin83). The Australian Recommended Food Score was the most commonly used DQI in the included studies (n = 4) and accounts for dietary preferences by asking the user if they are vegetarian at the commencement of the dietary assessment(Reference Whatnall, Clarke, Adam, Ashton, Burrows and Hutchesson62). This allows the algorithm to bypass the scoring for questions relating to meat intake and scores vegetarian alternatives higher, resulting in a score more representative of the diet(Reference Whatnall, Clarke, Adam, Ashton, Burrows and Hutchesson62). Researchers should ensure the DQI is suitable for their targeted population or that it can be modified to reflect diet quality across various dietary preferences.
The structure of feedback messages plays a critical role in how participants process and act on dietary information(Reference Krukowski, Denton and König84). In the included studies, feedback incorporated a combination of food groups, diet quality scores, nutrients and eating behaviours. While some messages integrated multiple elements, participants’ ability to interpret and apply the feedback likely depended on their level of food literacy(Reference Wilson85). This was evident in one study, where participants expressed a preference for more practical advice, such as healthy recipes, explanations of the health benefits of foods and clearer portion size guidance(Reference Lamers, van Erp, Slotegraaf, Groenen, de Roos and Wahab60). Feedback often focused on the lowest-scoring food groups, and whilst highlighting areas for improvement is important, an exclusive focus on deficits may undermine participant engagement. Positively framed messages that recognise existing healthy behaviours have been suggested to better support motivation and encourage sustainable dietary changes(Reference Potthoff, Polz, Ulbrich, Osmani and Schienle86). Incorporating strengths-based approaches into feedback design may therefore enhance the acceptability of personalised dietary feedback delivered via digital tools.
Measuring acceptability is an important consideration in health-related interventions, as participants’ perceptions of content, context and quality can influence engagement and outcomes(Reference Sekhon, Cartwright and Francis87). In the context of digital tools, each component of the system architecture can affect the acceptability of the feedback messages delivered. However, defining acceptability remains challenging owing to the lack of a standardised definition within the literature(Reference Sekhon, Cartwright and Francis87). Consistent with our findings, where both ‘acceptability’ and ‘feasibility’ were used to describe participants’ responses to feedback, previous reviews of healthcare interventions have also reported considerable overlap between these constructs(Reference Klaic, Kapp, Hudson, Chapman, Denehy and Story88). To address this, we broadly defined acceptability as participant satisfaction with the dietary feedback component, and feasibility as the practicality and scalability of providing feedback.
Similar to another review on feedback interventions(Reference Krukowski, Denton and König84), we found that completion rates for acceptability questionnaires were often low, raising concerns about the representativeness of the results. For example, although one study reported that 90% of participants accepted the feedback, only half (n = 80, 51%) of the participants in the intervention group completed the evaluation(Reference Béjar, García-Perea and Mesa-Rodríguez50). Assessments of acceptability in the included studies typically focused on the language and relevance of the feedback messages. In terms of feasibility, studies commonly reported the cost and technical challenges associated with automated feedback delivery(Reference Kaiser, Stelzl, Finglas and Gedrich49,Reference Okaniwa and Yoshida59) . Technical issues, such as participants not receiving feedback messages can reduce engagement and diminish the effectiveness of digital interventions. Researchers should therefore anticipate and address potential technical barriers and costs during the development of system architecture to optimise both the feasibility and impact of digital feedback tools(Reference Shoneye, Kwasnicka, Mullan, Pollard, Boushey and Kerr4).
From the quality assessment, the majority (n = 24, 86%) of included studies did not report the involvement of stakeholders in the design of their dietary feedback. In many cases, dietary feedback was created by dietitians and researchers drawing on their professional expertise and experience. This may reflect the focus of the studies, as only four studies reported the evaluation of dietary feedback as a primary outcome. Similarly, an umbrella review of digital health interventions highlighted inconsistent and poor reporting of co-design activities, despite the potential positive impacts on intervention acceptability and effectiveness(Reference Kilfoy, Hsu, Stockton-Powdrell, Whelan, Chu and Jibb89). Co-design processes, involving end-users such as patients, clinicians and healthcare decision-makers, can shape the development of feedback messages and improve their relevance, acceptability and ability to support behaviour change(Reference Sanders and Stappers90,Reference Singh, Sah, Simkhada and Darwin91) . Recognising the importance of co-design can help researchers develop more practical, user-centred solutions to address health issues(Reference Singh, Sah, Simkhada and Darwin91). It is therefore suggested that future development of personalised feedback messages incorporate stakeholder input, with clear reporting of co-design processes where applicable.
Strengths and limitations
Adherence to the PRISMA guidelines and the duplicate screening of all papers are important strengths of this review. However, the included studies lacked cultural diversity, with the majority being from Australia and the USA, likely owing to the exclusion of non-English publications. In addition, several limitations emerged owing to the heterogeneity in reporting across studies. This variability led to the exclusion of numerous studies during the screening process as they failed to provide adequate detail about the dietary feedback provided to participants. The absence of this information meant we could not confirm the inclusion of these studies, possibly limiting our findings. Despite using standard definitions of acceptability and feasibility to interpret results, the comparison of studies was limited by the variation of methodologies, combined with low response rates and the potential for response bias. Consequently, the review could not determine if participants preferred a particular platform, dietary assessment method or combination of dietary feedback elements, highlighting the need for more standardised methods of assessing acceptability and feasibility across studies. We purposefully did not examine the long-term effectiveness of the dietary feedback, but focused on the system architecture to examine the development of current technology-based tools. Future studies should explore how the components of the system architecture can impact the changes in diet quality over time.
Summary
This review explored the system architecture of automated, personalised dietary feedback. Studies commonly utilised FFQs via web-based platforms, and dietary feedback was often composed of food groups combined with two or more dietary elements, with the emerging use of AI. Eating behaviours were rarely included in the dietary feedback. There was wide variability within the definitions of acceptability and feasibility; thus, a standard definition was applied. Participant completion of acceptability questionnaires was low, and feasibility was often not reported. The feedback was generally accepted when assessed, indicating that various ways of generating personalised feedback can be successful depending on the study outcomes. This review highlights the need for standardised questionnaires to assess between-study acceptability and feasibility, a lack of cultural diversity and the need to report involvement of stakeholders and end-users in future research. By understanding the development of acceptable and feasible automated, personalised dietary feedback, the impact of future digital health interventions on diet quality can be increased, ultimately leading to better health outcomes. Future research should investigate the impact of personalised dietary feedback from digital interventions on longer-term diet quality.
Supplementary material
The supplementary material for this article can be found at https://doi.org/10.1017/S095442242610033X.
Acknowledgements
The authors would like to thank Monash University Librarian Mario Sos for his assistance in developing the search strategy and Professor Sharon Kirkpatrick from the University of Waterloo for reviewing the research aims.
Financial support
Samara Legrand is supported by a Monash University Graduate Scholarship.
Competing interests
The authors declare no conflicting interests.
Authorship
Conceptualisation: S.L., T.A.M., M.B. and A.D. Methodology: S.L., T.A.M, K.M., N.S., H.D., H.N., M.B., A.D. and E.L.J. Manuscript preparation: S.L. Manuscript review and editing: S.L., T.A.M., M.B. and A.D. Supervision: T.A.M., M.B. and A.D. All authors have read and agreed to the published version of the manuscript.


 Open access