


1 Introduction
The spreading of three-dimensional, unconfined gravity currents is a primary concern in many environmental problems in hydraulics, coastal dynamics, oceanography and meteorology. Such currents may be found when positively buoyant water plumes impinge on a level of stable stratification or when heavy fluids are spilled on the sea bottom, e.g. in the case of turbid or cold river waters flowing into lakes or coastal areas under calm wind conditions. The reader is referred to the classical introduction of Simpson (Reference Simpson1997) for a general review of the several possible manifestations of gravity currents in nature and in laboratory, and to Meiburg, Radhakrishnan & Nasr-Azadani (Reference Meiburg, Radhakrishnan and Nasr-Azadani2015) for a comprehensive description of the methods and models used to describe them. Most of the knowledge on axisymmetric currents, (e.g. Hallworth, Huppert & Ungarish Reference Hallworth, Huppert and Ungarish2001; Huppert Reference Huppert2006; Ungarish Reference Ungarish2009; Dai & Wu Reference Dai and Wu2016), refers to constant-volume flows, i.e. currents generated by the release of a constant volume of a dense fluid. This is because of the relative feasibility of field or laboratory experiments and the availability of numerical and analytical similarity solutions for the associated initial value problem in the context of shallow water theory (see e.g. Hallworth et al.
Reference Hallworth, Huppert, Phillips and Sparks1996). Recent experiments described by Cuthbertson et al. (Reference Cuthbertson, Laanearu, Wåhlin and Davies2012, Reference Cuthbertson, Lundberg, Davies and Laanearu2014) and Ottolenghi, Cenedese & Adduce (Reference Ottolenghi, Cenedese and Adduce2017b
) on continuous-inflow gravity currents in rotating tanks illustrate the complexity of the necessary experimental arrangement even in the case of planar flows. Direct numerical simulations (DNS) have been used to shed light on the dynamics and the instabilities of axisymmetric constant-volume gravity currents, as in Cantero et al. (Reference Cantero, Lee, Balachandar and Garcia2007). Advanced numerical methods have been proposed to study planar gravity currents in complex geometries or bathymetries, e.g. Ooi, Constantinescu & Weber (Reference Ooi, Constantinescu and Weber2007, Reference Ooi, Constantinescu and Weber2009), Gonzalez-Juez et al. (Reference Gonzalez-Juez, Meiburg, Tokyay and Constantinescu2010), Tokyay, Constantinescu & Meiburg (Reference Tokyay, Constantinescu and Meiburg2014), Dai (Reference Dai2015), Ottolenghi et al. (Reference Ottolenghi, Adduce, Roman and Armenio2017a
, Reference Ottolenghi, Prestininzi, Montessori, Adduce and La Rocca2018). The potential of using large eddy simulation (LES) and DNS in the simulation of Kelvin–Helmholtz and lobe and cleft instabilities in planar gravity currents at high Reynolds number has also been recently reviewed by Constantinescu (Reference Constantinescu2014). Dai (Reference Dai2013) studied the properties of frontal dynamics and mixing in plane gravity currents propagating on inclined bottoms. Comparatively less is known for axially symmetric gravity currents generated by a variable-volume flow of dense fluid even in the easiest case, i.e. constant inflow. This particular type of flow has rarely been investigated because laboratory experiments are often prone to being dominated by hydraulic shocks and, in fact, shallow water theory does not provide continuous analytical solutions of the similarity equations for the associated initial value problem (Grundy & Rottman Reference Grundy and Rottman1986). Axisymmetric, constant-flow-rate currents have been reproduced in the laboratory using long channels restricted to form circular sectors by applying non-parallel separating walls (Britter Reference Britter1979). In this case, only a relatively small portion of the current was generated, corresponding to circular sectors with angles
 $\unicode[STIX]{x1D703}\sim 10^{\circ }$
. The existence of characteristic frontal spreading regimes governed by the dynamical balance of some of the terms in the shallow water equations was suggested by Fay (Reference Fay1969) and successively by Hoult (Reference Hoult1972) and Huppert & Simpson (Reference Huppert and Simpson1980). Indeed, dimensional analysis indicates that in the initial part of the spreading the inertial acceleration prevails among the various forces opposing buoyancy. This phase is consequently known as the inertial–buoyancy equilibrium regime. The surface tension dominates the very end of the process, but only where a large difference in density between the current and the ambient fluid exists. The surface tension regime in fact does not appear in two-layer flows as is the case at hand. In the case of axially symmetric, constant volume gravity currents, the hydrostatic balance between the buoyancy and the inertial term can be expressed as:
$\unicode[STIX]{x1D703}\sim 10^{\circ }$
. The existence of characteristic frontal spreading regimes governed by the dynamical balance of some of the terms in the shallow water equations was suggested by Fay (Reference Fay1969) and successively by Hoult (Reference Hoult1972) and Huppert & Simpson (Reference Huppert and Simpson1980). Indeed, dimensional analysis indicates that in the initial part of the spreading the inertial acceleration prevails among the various forces opposing buoyancy. This phase is consequently known as the inertial–buoyancy equilibrium regime. The surface tension dominates the very end of the process, but only where a large difference in density between the current and the ambient fluid exists. The surface tension regime in fact does not appear in two-layer flows as is the case at hand. In the case of axially symmetric, constant volume gravity currents, the hydrostatic balance between the buoyancy and the inertial term can be expressed as:
 $$\begin{eqnarray}(\unicode[STIX]{x1D70C}_{1}-\unicode[STIX]{x1D70C}_{2})gh^{2}\cdot \unicode[STIX]{x03C0}r=\unicode[STIX]{x1D70C}_{1}\unicode[STIX]{x03C0}r^{2}h\ddot{r},\end{eqnarray}$$
which, by using the volume conservation
 $$\begin{eqnarray}Qt=\unicode[STIX]{x03C0}r^{2}h,\end{eqnarray}$$
can be expressed as
 $$\begin{eqnarray}\frac{\ddot{r}}{g^{\prime }}=\frac{Qt}{\unicode[STIX]{x03C0}r^{3}}.\end{eqnarray}$$
Here,
 $r(t)$
is the radial front position of the cylindrical current,
$r(t)$
is the radial front position of the cylindrical current,
 $h$
is the height of the current,
$h$
is the height of the current,
 $g$
is the gravity acceleration, the symbol
$g$
is the gravity acceleration, the symbol
 $g^{\prime }=g(\unicode[STIX]{x0394}\unicode[STIX]{x1D70C}/\unicode[STIX]{x1D70C}_{2})$
represents the reduced gravity in the Boussinesq approximation;
$g^{\prime }=g(\unicode[STIX]{x0394}\unicode[STIX]{x1D70C}/\unicode[STIX]{x1D70C}_{2})$
represents the reduced gravity in the Boussinesq approximation;
 $\unicode[STIX]{x0394}\unicode[STIX]{x1D70C}$
is the difference between the density of the ambient fluid,
$\unicode[STIX]{x0394}\unicode[STIX]{x1D70C}$
is the difference between the density of the ambient fluid,
 $\unicode[STIX]{x1D70C}_{2}$
, and the density of the fluid released from the source,
$\unicode[STIX]{x1D70C}_{2}$
, and the density of the fluid released from the source,
 $\unicode[STIX]{x1D70C}_{1}$
;
$\unicode[STIX]{x1D70C}_{1}$
;
 $Q$
is the volume flux of dense fluid. In case of negligible mixing, the volume of the cylindrical current is assumed equal to
$Q$
is the volume flux of dense fluid. In case of negligible mixing, the volume of the cylindrical current is assumed equal to
 $Qt$
.
$Qt$
.
Viscosity is the leading term at intermediate times, i.e. in the viscous–buoyancy equilibrium regime (Didden & Maxworthy Reference Didden and Maxworthy1982; Huppert Reference Huppert1982), i.e. when time is too short for the spreading to fall into the ultimate surface tension regime, but is too long to be in the inertial regime. In this case
 $$\begin{eqnarray}(\unicode[STIX]{x1D70C}_{1}-\unicode[STIX]{x1D70C}_{2})gh^{2}\cdot \unicode[STIX]{x03C0}r=\unicode[STIX]{x1D70C}_{1}\frac{\unicode[STIX]{x1D708}\unicode[STIX]{x03C0}r^{2}u_{r}}{h}\end{eqnarray}$$
by substituting
 $h$
from (1.2),
$h$
from (1.2),
 $$\begin{eqnarray}u_{r}\cdot \frac{\unicode[STIX]{x1D708}}{g^{\prime }h^{2}}=\frac{h}{r}.\end{eqnarray}$$
The symbol
 $\unicode[STIX]{x1D708}$
represents the kinematic viscosity. The existence of an additional regime, the ‘slumping phase’, was proposed by Huppert & Simpson (Reference Huppert and Simpson1980). The slumping, which dominates the short times prior to the onset of the inertial–buoyancy equilibrium, has been investigated by several authors, e.g. Ungarish & Zemach (Reference Ungarish and Zemach2005), in the limited context of planar and fixed-volume axisymmetric gravity currents. The concept of an asymptotic regime of spreading has been applied by several authors in the past, e.g. to assess the spreading of oil by a constant-volume spill at sea (see e.g. Hoult Reference Hoult1972; Huppert & Simpson Reference Huppert and Simpson1980). In the context of axisymmetric gravity currents, the rate of discharge plays a critical role in determining the asymptotic spreading rate of the radial front. In fact, it has long been assumed (see Chen Reference Chen1980, for an exhaustive literature review) that, on dimensional grounds from (1.3) and (1.5), the radial front position of the current,
$\unicode[STIX]{x1D708}$
represents the kinematic viscosity. The existence of an additional regime, the ‘slumping phase’, was proposed by Huppert & Simpson (Reference Huppert and Simpson1980). The slumping, which dominates the short times prior to the onset of the inertial–buoyancy equilibrium, has been investigated by several authors, e.g. Ungarish & Zemach (Reference Ungarish and Zemach2005), in the limited context of planar and fixed-volume axisymmetric gravity currents. The concept of an asymptotic regime of spreading has been applied by several authors in the past, e.g. to assess the spreading of oil by a constant-volume spill at sea (see e.g. Hoult Reference Hoult1972; Huppert & Simpson Reference Huppert and Simpson1980). In the context of axisymmetric gravity currents, the rate of discharge plays a critical role in determining the asymptotic spreading rate of the radial front. In fact, it has long been assumed (see Chen Reference Chen1980, for an exhaustive literature review) that, on dimensional grounds from (1.3) and (1.5), the radial front position of the current,
 $r(t)$
, evolves in time as
$r(t)$
, evolves in time as
 $$\begin{eqnarray}r(t)\propto (g^{\prime }Q)^{1/4}t^{3/4}\end{eqnarray}$$
during the inertial–buoyancy regime, and
 $$\begin{eqnarray}r(t)\propto \left(\frac{g^{\prime }Q^{3}}{\unicode[STIX]{x1D708}}\right)^{1/8}t^{1/2}\end{eqnarray}$$
during the viscous–buoyancy regime. The presence of the two equilibrium regimes was observed by Britter (Reference Britter1979) in a series of experiments reproducing negatively buoyant axisymmetric currents running on a rigid bottom. Unfortunately, the analytical solution to the constant-inflow initial value problem in the inertial–buoyancy equilibrium has proven to be most elusive. Britter (Reference Britter1979) was not able to find an exact analytical solution of the self-similar problem, i.e. the coupled system of nonlinear ordinary differential equations. Opposite approaches were pursued by Chen (Reference Chen1980) and Garvine (Reference Garvine1984); the former attempted to numerically solve the similarity problem in the inertial–buoyancy regime, i.e. integrating backward in time the self-similar ordinary differential equations from the final position of the front, and the latter solved the initial value problem in the spirit of Penney & Thornhill (Reference Penney and Thornhill1952) and Abbott & Hayashi (Reference Abbott and Hayashi1967), following the method of analysis of the characteristics.
It was soon found that the time rates of spreading found in the self-similar solution proposed by Chen (Reference Chen1980),
 $r\propto t^{3/4}$
, cannot be considered as the asymptotic regime reached by the solution of the initial problem studied by Garvine (Reference Garvine1984),
$r\propto t^{3/4}$
, cannot be considered as the asymptotic regime reached by the solution of the initial problem studied by Garvine (Reference Garvine1984),
 $r\propto t^{0.92}$
, due to the completely different spreading rates. Grundy & Rottman (Reference Grundy and Rottman1986), using the phase-plane method of Sedov (Reference Sedov1993), demonstrated that no continuous analytical similarity solution satisfying the boundary conditions on the axis of symmetry can exist for the general time-varying-inflow axisymmetric initial value problem, except in the case of constant-volume release. In fact, they demonstrated that the numerical solution of Chen (Reference Chen1980) was not compatible with the boundary conditions of the original problem. In the case of currents with a variable flow rate but planar symmetry, Gratton & Vigo (Reference Gratton and Vigo1994) found that up to four different families of solutions can exist, only one of which is continuous. This result led Bonnecaze et al. (Reference Bonnecaze, Hallworth, Huppert and Lister1995) to suggest that in the case of a constant flow rate, given the nonlinear, hyperbolic nature of the flow, the absence of continuous solutions might imply that only discontinuous solutions with shocks could eventually be found. A closely related problem is the study of the circular hydraulic jump (Bohr, Dimon & Putkaradze Reference Bohr, Dimon and Putkaradze1993). The problem, studied in laboratory experiments and numerical simulations, basically deals with the flow generated when a vertical jet of fluid impinges on a horizontal surface. In this case the interest is not in the position of the front, but rather in the position of the hydraulic jump. The circular jump theoretical problem has been successfully solved in a classical way imposing a discontinuous solution, or shock, in the sense of Whitham (Reference Whitham1999). A successive experimental investigation by Thorpe & Kavcic (Reference Thorpe and Kavcic2008) of an internal circular hydraulic jump realised in a two-layer flow shows similarities to the conditions studied in axially symmetric constant-volume currents, and, in fact, the characteristic outcome of the experiments is the presence of circular, axisymmetric rings. The theoretical line of investigation on circular hydraulic jumps (e.g. see Bhattacharjee & Ray Reference Bhattacharjee and Ray2011), while providing a general hydraulic model relating the variation of Froude number to the presence of a circular jump in a close analogy with the planar case, does not cover the case of non-stationary, multiple shocks.
$r\propto t^{0.92}$
, due to the completely different spreading rates. Grundy & Rottman (Reference Grundy and Rottman1986), using the phase-plane method of Sedov (Reference Sedov1993), demonstrated that no continuous analytical similarity solution satisfying the boundary conditions on the axis of symmetry can exist for the general time-varying-inflow axisymmetric initial value problem, except in the case of constant-volume release. In fact, they demonstrated that the numerical solution of Chen (Reference Chen1980) was not compatible with the boundary conditions of the original problem. In the case of currents with a variable flow rate but planar symmetry, Gratton & Vigo (Reference Gratton and Vigo1994) found that up to four different families of solutions can exist, only one of which is continuous. This result led Bonnecaze et al. (Reference Bonnecaze, Hallworth, Huppert and Lister1995) to suggest that in the case of a constant flow rate, given the nonlinear, hyperbolic nature of the flow, the absence of continuous solutions might imply that only discontinuous solutions with shocks could eventually be found. A closely related problem is the study of the circular hydraulic jump (Bohr, Dimon & Putkaradze Reference Bohr, Dimon and Putkaradze1993). The problem, studied in laboratory experiments and numerical simulations, basically deals with the flow generated when a vertical jet of fluid impinges on a horizontal surface. In this case the interest is not in the position of the front, but rather in the position of the hydraulic jump. The circular jump theoretical problem has been successfully solved in a classical way imposing a discontinuous solution, or shock, in the sense of Whitham (Reference Whitham1999). A successive experimental investigation by Thorpe & Kavcic (Reference Thorpe and Kavcic2008) of an internal circular hydraulic jump realised in a two-layer flow shows similarities to the conditions studied in axially symmetric constant-volume currents, and, in fact, the characteristic outcome of the experiments is the presence of circular, axisymmetric rings. The theoretical line of investigation on circular hydraulic jumps (e.g. see Bhattacharjee & Ray Reference Bhattacharjee and Ray2011), while providing a general hydraulic model relating the variation of Froude number to the presence of a circular jump in a close analogy with the planar case, does not cover the case of non-stationary, multiple shocks.
When no clear symmetry is present in the flow, as is the case for the three-dimensional unconfined gravity current problem, references in the literature are few. Ross, Linden & Dalziel (Reference Ross, Linden and Dalziel2002) studied the instantaneous release of a three-dimensional (3-D) gravity current on an unconfined uniform slope. La Rocca et al. (Reference La Rocca, Adduce, Sciortino and Pinzon2008, Reference La Rocca, Adduce, Sciortino, Pinzon and Boniforti2012) described a series of lock-exchange experiments of unbounded gravity currents generated in a large square tank. Prior to their study, Maxworthy (Reference Maxworthy1980) had presented experiments on 3-D gravity currents generating trains of solitary waves in a stratified environment realised in a similar large tank. The geometries of the two experimental set-ups differed in terms of the size of the volume of fluid in the lock, but despite the differences, it turns out that in many cases, the 3-D gravity currents generated appeared to acquire a definite axial symmetry in a short time.
The recent experimental results of Lombardi, Adduce & La Rocca (Reference Lombardi, Adduce and La Rocca2018), obtained in a set-up similar to that used by La Rocca et al. (Reference La Rocca, Adduce, Sciortino and Pinzon2008), show that the size of the lock width has a significant effect on the development of the gravity current not only in the evolution of the shape of the planform, but also in terms of the propagation speed of the frontline. For relatively large lock gates the current is similar to a planar current and develops a characteristic slumping regime with a constant front speed, while for lock gate widths under a definite threshold the current acquires a cylindrical symmetry and the spreading is always decelerating. In this case, a portion of the generated axisymmetric current has a circular sector with an angle increasing in time from approximately
 $170^{\circ }$
to
$170^{\circ }$
to
 $200^{\circ }$
.
$200^{\circ }$
.
The aim of the present study is to numerically investigate, in the context of the Boussinesq approximation, the formation of three-dimensional lock-exchange flows evolving in axisymmetric, constant-inflow gravity currents and the development of ring structures. Given the initial set-up as described in the experiments of La Rocca et al. (Reference La Rocca, Adduce, Sciortino and Pinzon2008), Lombardi et al. (Reference Lombardi, Adduce and La Rocca2018), which allows the formation of a constant inflow of dense fluid from the lock, the focus is in the description of the form and the evolution in time of the current planform in terms of characteristic regimes, and the propagation of shocks inside the flow in the early stage of development of the gravity current. Specifically, the presence of an initial slumping phase (Huppert Reference Huppert1982) and the existence of a subsequent inertial–buoyancy equilibrium regime, consistent with the results of Britter (Reference Britter1979), are investigated for the purely axisymmetric part of the gravity current. The study is carried out using wall-resolving large eddy simulation. This technique allows us to span a wide range of Grashof numbers, including the ones found in the experiments in physical laboratories, obtaining features of high resolution and accuracy. Section 2 presents the mathematical model and the set-up for the numerical experiments. Section 3 reports the analysis of the time evolution of the flow and the determination of the current regimes. A simple extension of the slumping regime theory of Huppert & Simpson (Reference Huppert and Simpson1980) applied to constant-inflow axisymmetric currents is also proposed to analyse the initial part of the spreading before the inertial–buoyancy equilibrium becomes effective. The conclusions are presented in § 4.
2 Numerical formulation and model implementation
2.1 Numerical model
A large eddy simulation model is used to solve the filtered Navier–Stokes equations under the usual Boussinesq approximation. A Cartesian coordinate system is considered with spatial components
 $x_{i}$
, where the vertical
$x_{i}$
, where the vertical
 $x_{3}$
coordinate is defined as positive upward. Time is indicated as
$x_{3}$
coordinate is defined as positive upward. Time is indicated as
 $t$
and the flow variables are denoted as
$t$
and the flow variables are denoted as
 $u_{i}$
for the velocity field,
$u_{i}$
for the velocity field,
 $p$
for the pressure field and
$p$
for the pressure field and
 $\unicode[STIX]{x1D70C}$
for the density field. According to the Boussinesq approximation the total density
$\unicode[STIX]{x1D70C}$
for the density field. According to the Boussinesq approximation the total density
 $\unicode[STIX]{x1D70C}_{tot}(x_{i},t)$
is subdivided into a bulk quantity
$\unicode[STIX]{x1D70C}_{tot}(x_{i},t)$
is subdivided into a bulk quantity
 $\unicode[STIX]{x1D70C}_{0}$
and a residual field
$\unicode[STIX]{x1D70C}_{0}$
and a residual field
 $\unicode[STIX]{x1D70C}^{\prime }(x_{i},t)$
:
$\unicode[STIX]{x1D70C}^{\prime }(x_{i},t)$
:
 $$\begin{eqnarray}\unicode[STIX]{x1D70C}_{tot}(x_{i},t)=\unicode[STIX]{x1D70C}_{0}+\unicode[STIX]{x1D70C}^{\prime }(x_{i},t)\quad i=1,2,3.\end{eqnarray}$$
Similarly, for the pressure field,
 $$\begin{eqnarray}p_{tot}(x_{i},t)=p_{0}(x_{3})+p^{\prime }(x_{i},t),\end{eqnarray}$$
where
 $p_{0}$
satisfies the hydrostatic balance for the bulk density
$p_{0}$
satisfies the hydrostatic balance for the bulk density
 $\unicode[STIX]{x1D70C}_{0}$
. The approximation is valid under the assumption that
$\unicode[STIX]{x1D70C}_{0}$
. The approximation is valid under the assumption that
 $\unicode[STIX]{x1D70C}_{0}\gg \unicode[STIX]{x1D70C}^{\prime }(x_{i},t)$
, which is the case under investigation.
$\unicode[STIX]{x1D70C}_{0}\gg \unicode[STIX]{x1D70C}^{\prime }(x_{i},t)$
, which is the case under investigation.
In our system the density field
 $\unicode[STIX]{x1D70C}$
varies in the closed range
$\unicode[STIX]{x1D70C}$
varies in the closed range
 $[\unicode[STIX]{x1D70C}_{2},\unicode[STIX]{x1D70C}_{1}]$
the values being the density of the ambient fluid and that of the fluid in the lock respectively. A density scale is thus
$[\unicode[STIX]{x1D70C}_{2},\unicode[STIX]{x1D70C}_{1}]$
the values being the density of the ambient fluid and that of the fluid in the lock respectively. A density scale is thus
 $\unicode[STIX]{x0394}\unicode[STIX]{x1D70C}=\unicode[STIX]{x1D70C}_{1}-\unicode[STIX]{x1D70C}_{2}$
and we can define
$\unicode[STIX]{x0394}\unicode[STIX]{x1D70C}=\unicode[STIX]{x1D70C}_{1}-\unicode[STIX]{x1D70C}_{2}$
and we can define
 $\unicode[STIX]{x1D716}=\unicode[STIX]{x0394}\unicode[STIX]{x1D70C}/\unicode[STIX]{x1D70C}_{2}$
, and the reduced gravity
$\unicode[STIX]{x1D716}=\unicode[STIX]{x0394}\unicode[STIX]{x1D70C}/\unicode[STIX]{x1D70C}_{2}$
, and the reduced gravity
 $g^{\prime }=\unicode[STIX]{x1D716}g$
. In our problem we set
$g^{\prime }=\unicode[STIX]{x1D716}g$
. In our problem we set
 $\unicode[STIX]{x1D70C}_{0}=\unicode[STIX]{x1D70C}_{2}$
. To consider a suitable non-dimensional form of the equations, it is assumed that the dimensional variables
$\unicode[STIX]{x1D70C}_{0}=\unicode[STIX]{x1D70C}_{2}$
. To consider a suitable non-dimensional form of the equations, it is assumed that the dimensional variables
 $x_{i},t,u_{i},p$
are related to the dimensionless corresponding variables
$x_{i},t,u_{i},p$
are related to the dimensionless corresponding variables
 $x_{i\ast },t_{\ast },u_{i\ast },p_{\ast }$
through the scales
$x_{i\ast },t_{\ast },u_{i\ast },p_{\ast }$
through the scales
 $L_{s},T_{s},U_{s}$
in the following way:
$L_{s},T_{s},U_{s}$
in the following way:
 $x_{i}=L_{s}x_{i\ast }$
,
$x_{i}=L_{s}x_{i\ast }$
,
 $u_{i}=U_{s}u_{i\ast }$
,
$u_{i}=U_{s}u_{i\ast }$
,
 $t=T_{s}t_{\ast }=L_{s}/U_{s}t_{\ast }$
,
$t=T_{s}t_{\ast }=L_{s}/U_{s}t_{\ast }$
,
 $p^{\prime }=\unicode[STIX]{x1D70C}_{2}U_{s}^{2}p_{\ast }^{\prime }$
and
$p^{\prime }=\unicode[STIX]{x1D70C}_{2}U_{s}^{2}p_{\ast }^{\prime }$
and
 $\unicode[STIX]{x1D70C}^{\prime }=\unicode[STIX]{x0394}\unicode[STIX]{x1D70C}\;\unicode[STIX]{x1D70C}_{\ast }^{\prime }$
.
$\unicode[STIX]{x1D70C}^{\prime }=\unicode[STIX]{x0394}\unicode[STIX]{x1D70C}\;\unicode[STIX]{x1D70C}_{\ast }^{\prime }$
.
The choice of the consistent set of scales
 $L_{s}=H$
, where
$L_{s}=H$
, where
 $H$
is the total height of the physical volume,
$H$
is the total height of the physical volume,
 $U_{s}=\sqrt{g^{\prime }H}$
and
$U_{s}=\sqrt{g^{\prime }H}$
and
 $T_{s}=H/U_{s}$
produces the momentum equation in non-dimensional form, where all asterisks and primes are dropped to make the notation lighter:
$T_{s}=H/U_{s}$
produces the momentum equation in non-dimensional form, where all asterisks and primes are dropped to make the notation lighter:
 $$\begin{eqnarray}\frac{\unicode[STIX]{x2202}u_{i}}{\unicode[STIX]{x2202}t}+\frac{\unicode[STIX]{x2202}u_{j}u_{i}}{\unicode[STIX]{x2202}x_{j}}=-\frac{\unicode[STIX]{x2202}p}{\unicode[STIX]{x2202}x_{i}}+\frac{1}{\sqrt{Gr}}\frac{\unicode[STIX]{x2202}^{2}u_{i}}{{\unicode[STIX]{x2202}x_{j}}^{2}}-\unicode[STIX]{x1D70C}\unicode[STIX]{x1D6FF}_{i3}.\end{eqnarray}$$
In the expressions above the symbol
 $\unicode[STIX]{x1D6FF}_{ij}$
denotes the Kronecker tensor. The Grashof number
$\unicode[STIX]{x1D6FF}_{ij}$
denotes the Kronecker tensor. The Grashof number
 $Gr=(U_{s}H/\unicode[STIX]{x1D708})^{2}$
is clearly related to the Reynolds number
$Gr=(U_{s}H/\unicode[STIX]{x1D708})^{2}$
is clearly related to the Reynolds number
 $Re$
when the latter originates from a different choice of the set of scales, i.e.
$Re$
when the latter originates from a different choice of the set of scales, i.e.
 $U_{s}=U_{f}$
, where
$U_{s}=U_{f}$
, where
 $U_{f}$
is the front velocity and
$U_{f}$
is the front velocity and
 $L_{s}$
is expressed in terms of a measure of the height of the current at the front
$L_{s}$
is expressed in terms of a measure of the height of the current at the front
 $h_{f}$
, i.e.
$h_{f}$
, i.e.
 $L_{s}=h_{f}=\unicode[STIX]{x1D6FC}H$
(Härtel, Meiburg & Necker Reference Härtel, Meiburg and Necker2000). Then,
$L_{s}=h_{f}=\unicode[STIX]{x1D6FC}H$
(Härtel, Meiburg & Necker Reference Härtel, Meiburg and Necker2000). Then,
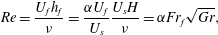 $$\begin{eqnarray}Re=\frac{U_{f}h_{f}}{\unicode[STIX]{x1D708}}=\frac{\unicode[STIX]{x1D6FC}U_{f}}{U_{s}}\frac{U_{s}H}{\unicode[STIX]{x1D708}}=\unicode[STIX]{x1D6FC}Fr_{f}\sqrt{Gr},\end{eqnarray}$$
where
 $Fr_{f}$
is a Froude number that depends on the front velocity of the gravity current and
$Fr_{f}$
is a Froude number that depends on the front velocity of the gravity current and
 $0.0<\unicode[STIX]{x1D6FC}<1.0$
is a numerical coefficient. After applying the LES filtering procedure, the complete system takes the following form:
$0.0<\unicode[STIX]{x1D6FC}<1.0$
is a numerical coefficient. After applying the LES filtering procedure, the complete system takes the following form:
 $$\begin{eqnarray}\displaystyle & \displaystyle \frac{\unicode[STIX]{x2202}\bar{u}_{j}}{\unicode[STIX]{x2202}x_{j}}=0, & \displaystyle\end{eqnarray}$$
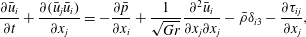 $$\begin{eqnarray}\displaystyle & \displaystyle \frac{\unicode[STIX]{x2202}\bar{u}_{i}}{\unicode[STIX]{x2202}t}+\frac{\unicode[STIX]{x2202}(\bar{u}_{j}\bar{u}_{i})}{\unicode[STIX]{x2202}x_{j}}=-\frac{\unicode[STIX]{x2202}\bar{p}}{\unicode[STIX]{x2202}x_{i}}+\frac{1}{\sqrt{Gr}}\frac{\unicode[STIX]{x2202}^{2}\bar{u}_{i}}{\unicode[STIX]{x2202}x_{j}\unicode[STIX]{x2202}x_{j}}-\bar{\unicode[STIX]{x1D70C}}\unicode[STIX]{x1D6FF}_{i3}-\frac{\unicode[STIX]{x2202}\unicode[STIX]{x1D70F}_{ij}}{\unicode[STIX]{x2202}x_{j}}, & \displaystyle\end{eqnarray}$$
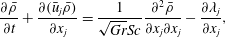 $$\begin{eqnarray}\displaystyle & \displaystyle \frac{\unicode[STIX]{x2202}\bar{\unicode[STIX]{x1D70C}}}{\unicode[STIX]{x2202}t}+\frac{\unicode[STIX]{x2202}(\bar{u}_{j}\bar{\unicode[STIX]{x1D70C}})}{\unicode[STIX]{x2202}x_{j}}=\frac{1}{\sqrt{Gr}Sc}\frac{\unicode[STIX]{x2202}^{2}\bar{\unicode[STIX]{x1D70C}}}{\unicode[STIX]{x2202}x_{j}\unicode[STIX]{x2202}x_{j}}-\frac{\unicode[STIX]{x2202}\unicode[STIX]{x1D706}_{j}}{\unicode[STIX]{x2202}x_{j}}, & \displaystyle\end{eqnarray}$$
where
 $Sc$
is the Schmidt number, defined as
$Sc$
is the Schmidt number, defined as
 $Sc=\unicode[STIX]{x1D708}/k$
.
$Sc=\unicode[STIX]{x1D708}/k$
.
 $\unicode[STIX]{x1D708}$
is the kinematic viscosity and
$\unicode[STIX]{x1D708}$
is the kinematic viscosity and
 $k$
is the diffusivity. Given a generic field
$k$
is the diffusivity. Given a generic field
 $\unicode[STIX]{x1D719}(x_{i},t)$
, the symbol
$\unicode[STIX]{x1D719}(x_{i},t)$
, the symbol
 $\bar{\unicode[STIX]{x1D719}}$
denotes the filtering operation, which is performed here through the implicit application of the top-hat filter. All the mentioned variables with overhead are resolved-scale filtered quantities. In particular,
$\bar{\unicode[STIX]{x1D719}}$
denotes the filtering operation, which is performed here through the implicit application of the top-hat filter. All the mentioned variables with overhead are resolved-scale filtered quantities. In particular,
 $\bar{\unicode[STIX]{x1D70C}}$
is now intended to be the filtered dimensionless residual density caused by the salinity variation in the absence of ambient stratification and at constant temperature. In fact, the density here is directly related to the concentration of salt by a linearised state equation in terms of a volumetric coefficient
$\bar{\unicode[STIX]{x1D70C}}$
is now intended to be the filtered dimensionless residual density caused by the salinity variation in the absence of ambient stratification and at constant temperature. In fact, the density here is directly related to the concentration of salt by a linearised state equation in terms of a volumetric coefficient
 $\unicode[STIX]{x1D6FD}$
.
$\unicode[STIX]{x1D6FD}$
.
The sub-grid-scale momentum and mass flux contributions
 $$\begin{eqnarray}\displaystyle & \displaystyle \unicode[STIX]{x1D70F}_{ij}=\overline{u_{i}u_{j}}-\bar{u}_{i}\bar{u}_{j}, & \displaystyle\end{eqnarray}$$
 $$\begin{eqnarray}\displaystyle & \displaystyle \unicode[STIX]{x1D706}_{j}=\overline{\unicode[STIX]{x1D70C}u_{j}}-\bar{\unicode[STIX]{x1D70C}}\bar{u}_{j} & \displaystyle\end{eqnarray}$$
are computed using the dynamic model of Armenio & Sarkar (Reference Armenio and Sarkar2002) with the constants evaluated using the Lagrangian procedure of Meneveau, Lund & Cabot (Reference Meneveau, Lund and Cabot1996). The choice of the Lagrangian model is motivated by the absence of directions of homogeneity in the development of three-dimensional gravity currents. In the model, equations (2.5)–(2.7) are numerically integrated using the fractional step algorithm of Zang, Street & Koseff (Reference Zang, Street and Koseff1994). A more general and exhaustive description of the numerical methods used can be found in Armenio & Piomelli (Reference Armenio and Piomelli2000) and Armenio & Sarkar (Reference Armenio and Sarkar2002). The model has been successfully applied in a wide class of problems, among the others for the study of wall-bounded stratified flows (Taylor, Sarkar & Armenio Reference Taylor, Sarkar and Armenio2005), for unsteady transitional flows (Salon, Armenio & Crise Reference Salon, Armenio and Crise2007) and, more recently, in the evaluation of mixing in planar gravity currents (Ottolenghi et al. Reference Ottolenghi, Adduce, Inghilesi, Armenio and Roman2016a ,Reference Ottolenghi, Adduce, Inghilesi, Roman and Armenio b , Reference Ottolenghi, Adduce, Roman and Armenio2017a ). The present version of the model makes use of an immersed boundary technique (Roman et al. Reference Roman, Napoli, Milici and Armenio2009) to simulate the presence of obstacles in the domain of the flow. No-slip boundary conditions are imposed for velocity on the bottom and on the lateral walls, whereas on the top wall, a shear-free boundary condition is applied. No-flux conditions are also enforced for the salinity on all boundaries.
2.2 Numerical set-up
The simulations aim to realistically reproduce experimental conditions similar to those described in La Rocca et al. (Reference La Rocca, Adduce, Sciortino and Pinzon2008, Reference La Rocca, Adduce, Sciortino, Pinzon and Boniforti2012), Lombardi et al. (Reference Lombardi, Adduce and La Rocca2018). For simplicity, the indicial notation is dropped hereinafter in favour of the basic Cartesian notation, where
 $x=x_{1}$
,
$x=x_{1}$
,
 $y=x_{2}$
and
$y=x_{2}$
and
 $z=x_{3}$
. Consistently, the flow velocity components will be denoted as
$z=x_{3}$
. Consistently, the flow velocity components will be denoted as
 $u=u_{1}$
,
$u=u_{1}$
,
 $v=u_{2}$
and
$v=u_{2}$
and
 $w=u_{3}$
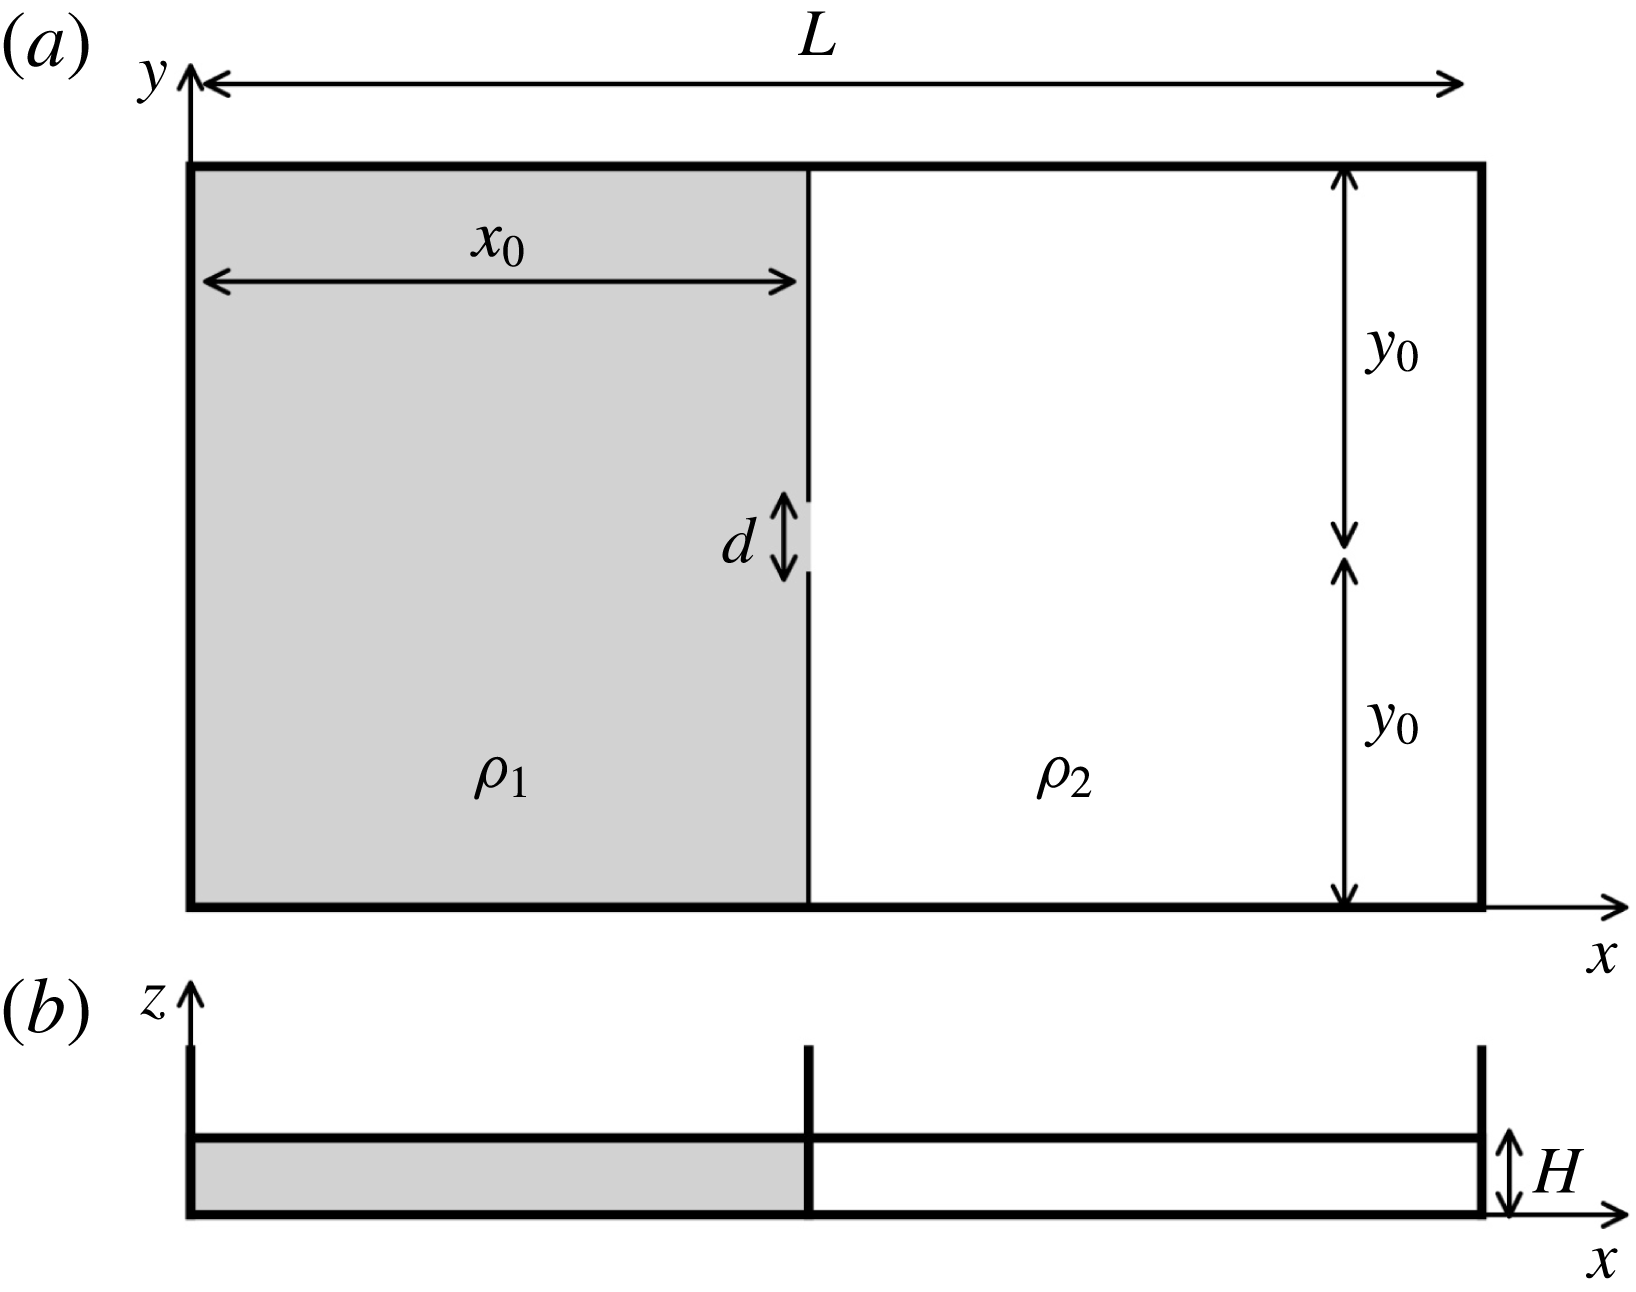
. A schematic of the geometry of the numerical domain and the laboratory tank is shown in figure 1. The geometry of the experimental apparatus has been numerically reproduced in the form of a rectangular tank of length
$w=u_{3}$
. A schematic of the geometry of the numerical domain and the laboratory tank is shown in figure 1. The geometry of the experimental apparatus has been numerically reproduced in the form of a rectangular tank of length
 $L$
, width
$L$
, width
 $2y_{0}$
and height
$2y_{0}$
and height
 $H$
, with the vertical dimension
$H$
, with the vertical dimension
 $H$
being considerably smaller than the horizontal ones (
$H$
being considerably smaller than the horizontal ones (
 $y_{0}$
and
$y_{0}$
and
 $L$
). The domain of the simulation is the entire volume of the tank
$L$
). The domain of the simulation is the entire volume of the tank
 $L\cdot 2y_{0}\cdot H$
. The tank is divided into two volumes by a wall inserted at a distance of
$L\cdot 2y_{0}\cdot H$
. The tank is divided into two volumes by a wall inserted at a distance of
 $x_{0}$
from the left side of the tank. An open gate of width
$x_{0}$
from the left side of the tank. An open gate of width
 $d$
is positioned at the centre of the separating lock wall. The ratio between the width of the gate and the size of the wall is
$d$
is positioned at the centre of the separating lock wall. The ratio between the width of the gate and the size of the wall is
 $d/y_{0}\ll 1$
. The initial conditions represent a situation in which the fluid is at rest everywhere. The left volume (i.e. the lock) is filled with a liquid with density
$d/y_{0}\ll 1$
. The initial conditions represent a situation in which the fluid is at rest everywhere. The left volume (i.e. the lock) is filled with a liquid with density
 $\unicode[STIX]{x1D70C}_{1}$
(a solution of sodium chloride, NaCl, and fresh water in the physical experiments) and the right volume is filled with a liquid with a lower density
$\unicode[STIX]{x1D70C}_{1}$
(a solution of sodium chloride, NaCl, and fresh water in the physical experiments) and the right volume is filled with a liquid with a lower density
 $\unicode[STIX]{x1D70C}_{2}$
(fresh water in the physical experiments). Both portions of the tank are filled to the same level
$\unicode[STIX]{x1D70C}_{2}$
(fresh water in the physical experiments). Both portions of the tank are filled to the same level
 $H$
(full-depth configuration).
$H$
(full-depth configuration).
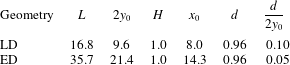
Two different configurations are implemented: one closely corresponds to the laboratory experiments mentioned above, and the other one, which would be hardly realisable in ordinary laboratory conditions, simulates an extended domain to follow the numerical spreading of the current front for relatively long times. The values of the geometrical parameters for the two domains, i.e. the laboratory domain (LD) and the extended domain (ED), are shown in table 1. The primary difference between the two domains is that in the ED the circular frontline is able to develop over a horizontal area approximately 9 times larger than in the LD case.
The presence of the separating wall with the lock opening
 $d$
has been implemented in the simulation by imposing no-slip condition on the nodes contained in the wall, except for the grid points on
$d$
has been implemented in the simulation by imposing no-slip condition on the nodes contained in the wall, except for the grid points on
 $d$
. The condition has been realised by using an immersed boundary technique as described in Roman et al. (Reference Roman, Napoli, Milici and Armenio2009).
$d$
. The condition has been realised by using an immersed boundary technique as described in Roman et al. (Reference Roman, Napoli, Milici and Armenio2009).
The three-dimensional grid for the LD domain is composed of
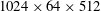 $1024\times 64\times 512$
cells in the
$1024\times 64\times 512$
cells in the
 $x,y,z$
directions, respectively and it is not uniform. On the (
$x,y,z$
directions, respectively and it is not uniform. On the (
 $x,y$
) horizontal plane, the grid has the highest resolution
$x,y$
) horizontal plane, the grid has the highest resolution
 $\unicode[STIX]{x0394}x=0.01$
;
$\unicode[STIX]{x0394}x=0.01$
;
 $\unicode[STIX]{x0394}y=0.01$
in the central part of the domain, near the separating wall; and it has a lower resolution towards the external vertical walls. Along the vertical dimension,
$\unicode[STIX]{x0394}y=0.01$
in the central part of the domain, near the separating wall; and it has a lower resolution towards the external vertical walls. Along the vertical dimension,
 $z$
, it has the maximum resolution at the top and bottom of the domain, with a relatively coarse resolution in the central part. The cells in the three directions are distributed as
$z$
, it has the maximum resolution at the top and bottom of the domain, with a relatively coarse resolution in the central part. The cells in the three directions are distributed as
 $\arctan (x_{i})$
following the method of Vinokur (Reference Vinokur1983). The rationale for this choice is that, since the current is generated by lock exchange, there are two almost symmetrical currents propagating in opposite directions, one is a current made of dense fluid propagating on the bottom of the tank in the positive
$\arctan (x_{i})$
following the method of Vinokur (Reference Vinokur1983). The rationale for this choice is that, since the current is generated by lock exchange, there are two almost symmetrical currents propagating in opposite directions, one is a current made of dense fluid propagating on the bottom of the tank in the positive
 $x$
-direction, the other is a current of light fluid propagating on the top of the tank in the negative
$x$
-direction, the other is a current of light fluid propagating on the top of the tank in the negative
 $x$
-direction. Both are important in determining the volume discharge at the gate. As shown in figure 2, both the currents on the top and on the bottom of the tank move respectively below and over the plane at
$x$
-direction. Both are important in determining the volume discharge at the gate. As shown in figure 2, both the currents on the top and on the bottom of the tank move respectively below and over the plane at
 $z=1/2$
during the duration of the simulation.
$z=1/2$
during the duration of the simulation.
Sketch of the lock-release tank: (a) top view and (b) side view.
Geometrical parameters for the laboratory domain (LD) and the extended domain (ED). All quantities have been made non-dimensional using
 $H$
.
$H$
.
The numerical grid on the ED domain, made of
 $2048\times 64\times 1024$
nodes, is an expanded version of the previously described one. It has the same structure in the vertical
$2048\times 64\times 1024$
nodes, is an expanded version of the previously described one. It has the same structure in the vertical
 $z$
direction and a non-uniform horizontal grid with the same higher resolution
$z$
direction and a non-uniform horizontal grid with the same higher resolution
 $\unicode[STIX]{x0394}x$
,
$\unicode[STIX]{x0394}x$
,
 $\unicode[STIX]{x0394}y$
near the gate and the same lower resolution near the external wall. The LES on the extended grid requires very high-performance computing resources, and the results were obtained on a cluster of high-performance computing nodes using 512 cores.
$\unicode[STIX]{x0394}y$
near the gate and the same lower resolution near the external wall. The LES on the extended grid requires very high-performance computing resources, and the results were obtained on a cluster of high-performance computing nodes using 512 cores.
In all simulations, it was verified that the grid resolution is sufficiently fine to resolve the near-wall structures, as required by wall-resolved LES. In particular, it was verified that the dimensionless grid size in terms of wall units
 $x_{i}^{+}=x_{i}u_{\unicode[STIX]{x1D70F}}/\unicode[STIX]{x1D708}$
is always in the range
$x_{i}^{+}=x_{i}u_{\unicode[STIX]{x1D70F}}/\unicode[STIX]{x1D708}$
is always in the range
 $\unicode[STIX]{x0394}x^{+}<50$
,
$\unicode[STIX]{x0394}x^{+}<50$
,
 $\unicode[STIX]{x0394}y^{+}<20$
, and
$\unicode[STIX]{x0394}y^{+}<20$
, and
 $\unicode[STIX]{x0394}z_{max}^{+}\simeq 1$
, where
$\unicode[STIX]{x0394}z_{max}^{+}\simeq 1$
, where
 $u_{\unicode[STIX]{x1D70F}}=\sqrt{\unicode[STIX]{x1D70F}/\unicode[STIX]{x1D70C}_{2}}$
is the local friction velocity, with
$u_{\unicode[STIX]{x1D70F}}=\sqrt{\unicode[STIX]{x1D70F}/\unicode[STIX]{x1D70C}_{2}}$
is the local friction velocity, with
 $\unicode[STIX]{x1D70F}$
the local wall shear stress. For a discussion see, among the others, Piomelli & Chasnov (Reference Piomelli and Chasnov1996), Piomelli & Balaras (Reference Piomelli and Balaras2002). The a posteriori analysis of the friction velocity showed that the conditions were met for all cases investigated. Specifically it was verified that the criterion above reported on the grid spacing in the horizontal directions was satisfied and that at least 6 grid points fell within the viscous sub-layer of the turbulent boundary layer.
$\unicode[STIX]{x1D70F}$
the local wall shear stress. For a discussion see, among the others, Piomelli & Chasnov (Reference Piomelli and Chasnov1996), Piomelli & Balaras (Reference Piomelli and Balaras2002). The a posteriori analysis of the friction velocity showed that the conditions were met for all cases investigated. Specifically it was verified that the criterion above reported on the grid spacing in the horizontal directions was satisfied and that at least 6 grid points fell within the viscous sub-layer of the turbulent boundary layer.
Eleven test cases were simulated, the field of variation of the parameters is shown in table 2. Cases S1–S6 have
 $Gr$
increased by three orders of magnitude from
$Gr$
increased by three orders of magnitude from
 $Gr(\text{S}1)=8.1\times 10^{4}$
to
$Gr(\text{S}1)=8.1\times 10^{4}$
to
 $Gr(\text{S}6)=2.0\times 10^{8}$
, i.e. raised by a factor of 2500.
$Gr(\text{S}6)=2.0\times 10^{8}$
, i.e. raised by a factor of 2500.
Density field on the mid-plane
 $y=y_{0}$
,
$y=y_{0}$
,
 $t=8.7$
, case S11.
$t=8.7$
, case S11.
S1–S11: numerical simulations in the LD, S12: laboratory experiment in the LD and S13: numerical simulation in the ED;
 $t_{0}$
is the time after which
$t_{0}$
is the time after which
 $Q$
becomes steady,
$Q$
becomes steady,
 $t_{i}=aQ/\unicode[STIX]{x03C0}g^{\prime }H^{2}$
is the time scale for transition to buoyancy–inertial regime,
$t_{i}=aQ/\unicode[STIX]{x03C0}g^{\prime }H^{2}$
is the time scale for transition to buoyancy–inertial regime,
 $t_{f}$
is the end time of simulation/experiment,
$t_{f}$
is the end time of simulation/experiment,
 $t_{v}=\sqrt{Q/g^{\prime }\unicode[STIX]{x1D708}}$
is the time scale for transition to buoyancy–viscous regime,
$t_{v}=\sqrt{Q/g^{\prime }\unicode[STIX]{x1D708}}$
is the time scale for transition to buoyancy–viscous regime,
 $\unicode[STIX]{x1D702}$
is the non-dimensional frequency of ring generation.
$\unicode[STIX]{x1D702}$
is the non-dimensional frequency of ring generation.
Cases S7–S11 have
 $Gr$
in the range
$Gr$
in the range
 $[2.7{-}8.1]\times 10^{8}$
, i.e.
$[2.7{-}8.1]\times 10^{8}$
, i.e.
 $Gr$
is increased by a factor of 3 from S7 to S11. Case S12 is a laboratory experiment conducted under the same conditions as case S11. The value
$Gr$
is increased by a factor of 3 from S7 to S11. Case S12 is a laboratory experiment conducted under the same conditions as case S11. The value
 $Sc=600$
has been considered in all cases. The full-depth release of a saline gravity current, case S12, was conducted at the Hydraulics Laboratory of the University of ‘Roma Tre’ in a rectangular Plexiglas tank with the same dimensions and configuration shown in figure 1. The physical length of the tank is 2.35 m, width 1.35 m and height 0.14 m. A blue dye (methylene) was added to the salty solution (i.e. the lock fluid) to identify the two fluids during the experiment. The density measurements were performed using a pycnometer, with a relative error 0.2 %. The experiment started when the lock gate was lifted vertically. The development of the current was recorded using an overhead charged coupled camera, with a time resolution of 25 fps and a spatial resolution of
$Sc=600$
has been considered in all cases. The full-depth release of a saline gravity current, case S12, was conducted at the Hydraulics Laboratory of the University of ‘Roma Tre’ in a rectangular Plexiglas tank with the same dimensions and configuration shown in figure 1. The physical length of the tank is 2.35 m, width 1.35 m and height 0.14 m. A blue dye (methylene) was added to the salty solution (i.e. the lock fluid) to identify the two fluids during the experiment. The density measurements were performed using a pycnometer, with a relative error 0.2 %. The experiment started when the lock gate was lifted vertically. The development of the current was recorded using an overhead charged coupled camera, with a time resolution of 25 fps and a spatial resolution of
 $0.25~\text{cm}~\text{pxl}^{-1}$
. The space–time evolution of the current shape was measured by applying an image analysis technique based on the threshold method (Adduce, Sciortino & Proietti Reference Adduce, Sciortino and Proietti2012; Lombardi et al.
Reference Lombardi, Adduce, Sciortino and Rocca2015; La Forgia, Adduce & Falcini Reference La Forgia, Adduce and Falcini2018). Points belonging to the current profile (i.e. interface between the two fluids) were determined within an error of 0.2 cm. An additional simulation, S13, was conducted to consider the spreading on the ED larger scale. The values of
$0.25~\text{cm}~\text{pxl}^{-1}$
. The space–time evolution of the current shape was measured by applying an image analysis technique based on the threshold method (Adduce, Sciortino & Proietti Reference Adduce, Sciortino and Proietti2012; Lombardi et al.
Reference Lombardi, Adduce, Sciortino and Rocca2015; La Forgia, Adduce & Falcini Reference La Forgia, Adduce and Falcini2018). Points belonging to the current profile (i.e. interface between the two fluids) were determined within an error of 0.2 cm. An additional simulation, S13, was conducted to consider the spreading on the ED larger scale. The values of
 $Gr$
and
$Gr$
and
 $\unicode[STIX]{x1D716}$
used in S13 are those defined for the simulation of case S9.
$\unicode[STIX]{x1D716}$
used in S13 are those defined for the simulation of case S9.
A key parameter of the gravity current dynamics is the flow rate of dense fluid at the separating gate,
 $Q$
. This flow rate directly affects the speed of the front of the current and the onset of the viscous regime, which was estimated as
$Q$
. This flow rate directly affects the speed of the front of the current and the onset of the viscous regime, which was estimated as
 $t_{v}\sim \sqrt{Q/g^{\prime }\unicode[STIX]{x1D708}}$
by Huppert (Reference Huppert1982) in the limit of the shallow water approximation and experimentally by Britter (Reference Britter1979). To compute
$t_{v}\sim \sqrt{Q/g^{\prime }\unicode[STIX]{x1D708}}$
by Huppert (Reference Huppert1982) in the limit of the shallow water approximation and experimentally by Britter (Reference Britter1979). To compute
 $Q(t)=\unicode[STIX]{x0222F}_{S_{gate}}\unicode[STIX]{x1D6E9}(x_{0},y,z,t)\boldsymbol{u}\times \boldsymbol{n}_{x}\,\text{d}S$
from the simulations, the flow integral of the positive velocity in the
$Q(t)=\unicode[STIX]{x0222F}_{S_{gate}}\unicode[STIX]{x1D6E9}(x_{0},y,z,t)\boldsymbol{u}\times \boldsymbol{n}_{x}\,\text{d}S$
from the simulations, the flow integral of the positive velocity in the
 $x$
-direction crossing the lock gate is numerically evaluated.
$x$
-direction crossing the lock gate is numerically evaluated.
 $S_{gate}(t)=\int _{0}^{2y_{0}}\int _{0}^{H}\unicode[STIX]{x1D6E9}(x_{0},y,z,t)\,\text{d}y\,\text{d}z$
is the part of the section of the dividing wall where the velocity is positive and
$S_{gate}(t)=\int _{0}^{2y_{0}}\int _{0}^{H}\unicode[STIX]{x1D6E9}(x_{0},y,z,t)\,\text{d}y\,\text{d}z$
is the part of the section of the dividing wall where the velocity is positive and
 $\unicode[STIX]{x1D6E9}$
is a function defined as:
$\unicode[STIX]{x1D6E9}$
is a function defined as:
 $$\begin{eqnarray}\unicode[STIX]{x1D6E9}(x_{0},y,z,t)=\left\{\begin{array}{@{}ll@{}}1\quad & \text{on }(x_{0},y,z,t)|u>0,\\ 0\quad & \text{otherwise.}\end{array}\right.\end{eqnarray}$$
In all simulations, the flow rate exhibits a peak in the very early stage of development and then tends to an almost constant value after a relatively small time which varies from one case to another. The non-dimensional volume discharge
 $Q/U_{s}H^{2}$
is independent of
$Q/U_{s}H^{2}$
is independent of
 $Gr$
at relatively high Grashof numbers, i.e. for
$Gr$
at relatively high Grashof numbers, i.e. for
 $Gr>10^{6}$
.
$Gr>10^{6}$
.
3 Results
3.1 General features of the current
Immediately after the removal of the gate, a heavy current develops on the bottom surface in the right part of the tank, where the ambient fluid is fresh water. A similar and almost symmetrical buoyant current is generated on the top surface on the opposite side of the tank, as shown in figure 2. The two currents, which are affected by different boundary conditions imposed at the top and at the bottom of the tank, present similarities and differences. Both manifest axial symmetry and instabilities, but the current spreading on the bottom is more stable and is simpler to investigate in the laboratory. Consequently, only the spreading of the current on the bottom of the tank is considered in the following.
In order to discuss the axial symmetry of the frontline it is necessary to formalise the definition of some geometric constructions used in the numerical and experimental analyses. The external contour of the planform, taken as the frontline of the current, can be determined using the field of density on a fixed horizontal plane by introducing a threshold value
 $\unicode[STIX]{x1D713}$
. Then a plane function
$\unicode[STIX]{x1D713}$
. Then a plane function
 $G(x,y)$
is defined as:
$G(x,y)$
is defined as:
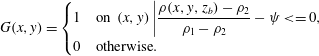 $$\begin{eqnarray}G(x,y)=\left\{\begin{array}{@{}ll@{}}1\quad & \text{on }(x,y)\left|{\displaystyle \frac{\unicode[STIX]{x1D70C}(x,y,z_{b})-\unicode[STIX]{x1D70C}_{2}}{\unicode[STIX]{x1D70C}_{1}-\unicode[STIX]{x1D70C}_{2}}}-\unicode[STIX]{x1D713}<=0,\right.\\ \displaystyle 0\quad & \text{otherwise}.\end{array}\right.\end{eqnarray}$$
The external frontline is identified implicitly by the function
 $G(x,y)$
defined on the horizontal plane
$G(x,y)$
defined on the horizontal plane
 $z=z_{b}=0.05$
. This is the lower height at which the velocity profile is not significantly affected by the distance from the bottom, particularly by the radial structures associated with the time evolution of lobes and clefts. The determination of the minimum plane height is important as the depth of the current becomes very shallow during the spreading.
$z=z_{b}=0.05$
. This is the lower height at which the velocity profile is not significantly affected by the distance from the bottom, particularly by the radial structures associated with the time evolution of lobes and clefts. The determination of the minimum plane height is important as the depth of the current becomes very shallow during the spreading.
 $\unicode[STIX]{x1D713}$
is a small density threshold used in the determination of the frontline. The frontline position can be determined in low
$\unicode[STIX]{x1D713}$
is a small density threshold used in the determination of the frontline. The frontline position can be determined in low
 $Gr$
cases starting from
$Gr$
cases starting from
 $\unicode[STIX]{x1D713}=1\,\%$
, but taking
$\unicode[STIX]{x1D713}=1\,\%$
, but taking
 $\unicode[STIX]{x1D713}=3\,\%$
provides a sufficiently continuous frontline in all cases. In the experiment S12, the frontline is determined using a similar method applied to the images recorded by an overhead camera. In this case, given that the light is absorbed by the tracer monotonically with the depth of the current, the level of grey in the camera image replaces the density in (3.1). The implicit function
$\unicode[STIX]{x1D713}=3\,\%$
provides a sufficiently continuous frontline in all cases. In the experiment S12, the frontline is determined using a similar method applied to the images recorded by an overhead camera. In this case, given that the light is absorbed by the tracer monotonically with the depth of the current, the level of grey in the camera image replaces the density in (3.1). The implicit function
 $G$
can be used to obtain the explicit form of the frontline
$G$
can be used to obtain the explicit form of the frontline
 $x_{f}=f_{l}(y)$
on the fixed horizontal plane, starting by identifying separately the maximum
$x_{f}=f_{l}(y)$
on the fixed horizontal plane, starting by identifying separately the maximum
 $f_{l}(y_{+})$
and minimum
$f_{l}(y_{+})$
and minimum
 $f_{l}(y_{-})$
of the frontline function above and below the longitudinal axis. At all times, the form of the frontline has a definite curvature: it starts close to elliptic, with the radius in the transverse (
$f_{l}(y_{-})$
of the frontline function above and below the longitudinal axis. At all times, the form of the frontline has a definite curvature: it starts close to elliptic, with the radius in the transverse (
 $y$
) direction being greater than that in the longitudinal (
$y$
) direction being greater than that in the longitudinal (
 $x$
) one. The elliptic form of the frontline collapses to a circle in a short time, and the frontline maintains the circular shape in time apart from occasional perturbations. The simplest approach to identify the frontline explicitly is then to consider the two radii of curvature,
$x$
) one. The elliptic form of the frontline collapses to a circle in a short time, and the frontline maintains the circular shape in time apart from occasional perturbations. The simplest approach to identify the frontline explicitly is then to consider the two radii of curvature,
 $R_{b}$
along
$R_{b}$
along
 $y$
and
$y$
and
 $R_{a}$
along
$R_{a}$
along
 $x$
. In general, if the frontline is an ellipse (or a circle), then the maximum and minimum of
$x$
. In general, if the frontline is an ellipse (or a circle), then the maximum and minimum of
 $G$
will have the same projection on the
$G$
will have the same projection on the
 $x$
axis, i.e.
$x$
axis, i.e.
 $x_{c}$
. The minor semi-axis of the ellipse,
$x_{c}$
. The minor semi-axis of the ellipse,
 $b$
, is taken as half the distance between the two points. The major axis of the ellipse,
$b$
, is taken as half the distance between the two points. The major axis of the ellipse,
 $a$
, is then obtained from the difference between the intersection of the frontline with the
$a$
, is then obtained from the difference between the intersection of the frontline with the
 $x$
axis,
$x$
axis,
 $x_{f}$
and the
$x_{f}$
and the
 $x$
-coordinate of the centre,
$x$
-coordinate of the centre,
 $x_{c}$
.
$x_{c}$
.
The geometry of the spreading is illustrated in figure 3 showing the frontline
 $G(x,y)$
at the end of the simulation in the low Grashof number case S2. An accurate inspection reveals that the frontline has a circular shape centred at a position
$G(x,y)$
at the end of the simulation in the low Grashof number case S2. An accurate inspection reveals that the frontline has a circular shape centred at a position
 $x_{c}$
on the longitudinal axis
$x_{c}$
on the longitudinal axis
 $y=y_{0}$
. In other words, as shown below, the current assumes an axially symmetric form with respect to a time-varying virtual origin that translates along
$y=y_{0}$
. In other words, as shown below, the current assumes an axially symmetric form with respect to a time-varying virtual origin that translates along
 $y=y_{0}$
. In all cases considered,
$y=y_{0}$
. In all cases considered,
 $x_{c}(t)$
increases almost linearly with velocity
$x_{c}(t)$
increases almost linearly with velocity
 ${\dot{x}}_{c}\sim 0.1$
up to a distance which depends on
${\dot{x}}_{c}\sim 0.1$
up to a distance which depends on
 $Gr$
, then it moves very slowly until the end of the simulation. The transition is reached at distances ranging from
$Gr$
, then it moves very slowly until the end of the simulation. The transition is reached at distances ranging from
 $x-x_{0}=1.1$
at low Grashof to
$x-x_{0}=1.1$
at low Grashof to
 $x-x_{0}=2.0$
at high Grashof. In case S13, the longest run, the transition occurs at
$x-x_{0}=2.0$
at high Grashof. In case S13, the longest run, the transition occurs at
 $x-x_{0}=2$
, then it moves with speed
$x-x_{0}=2$
, then it moves with speed
 ${\dot{x}}_{c}\sim 0.04$
until the end of the simulation, at
${\dot{x}}_{c}\sim 0.04$
until the end of the simulation, at
 $x-x_{0}\sim 3.5$
(figure 4). For values of
$x-x_{0}\sim 3.5$
(figure 4). For values of
 $Gr>2\times 10^{6}$
the development of lobe and cleft instabilities causes some problems for the detection of the position of the frontline due to the appearance of spurious jumps in
$Gr>2\times 10^{6}$
the development of lobe and cleft instabilities causes some problems for the detection of the position of the frontline due to the appearance of spurious jumps in
 $x_{c}$
. For
$x_{c}$
. For
 $4.5\times 10^{6}<Gr<10^{7}$
, the lobes are relatively few and larger, whereas for
$4.5\times 10^{6}<Gr<10^{7}$
, the lobes are relatively few and larger, whereas for
 $Gr>10^{7}$
, the number of lobes increases, but the frontline is less perturbed. Since the life span of the individual lobe is of the order of
$Gr>10^{7}$
, the number of lobes increases, but the frontline is less perturbed. Since the life span of the individual lobe is of the order of
 $\unicode[STIX]{x0394}t\sim 3$
, i.e. small compared to the duration of simulations and experiment, a correction for the estimates of the radius of the circular frontline and of the position
$\unicode[STIX]{x0394}t\sim 3$
, i.e. small compared to the duration of simulations and experiment, a correction for the estimates of the radius of the circular frontline and of the position
 $x_{c}$
can be easily implemented using geometric or statistical methods. An effective geometrical method based on the iterative comparison of different radii is applied, as briefly illustrated in the following. Three distances are considered:
$x_{c}$
can be easily implemented using geometric or statistical methods. An effective geometrical method based on the iterative comparison of different radii is applied, as briefly illustrated in the following. Three distances are considered:
 $a$
,
$a$
,
 $b$
and
$b$
and
 $R_{c}$
.
$R_{c}$
.
 $b$
is evaluated as half the maximum distance along
$b$
is evaluated as half the maximum distance along
 $y$
between two extremal points on the frontline.
$y$
between two extremal points on the frontline.
 $a$
is obtained as the distance between the frontline position on the
$a$
is obtained as the distance between the frontline position on the
 $x$
axis,
$x$
axis,
 $x_{f}$
and the
$x_{f}$
and the
 $x$
-coordinate of the symmetry axis
$x$
-coordinate of the symmetry axis
 $x_{c}$
, i.e.
$x_{c}$
, i.e.
 $a=x_{f}-x_{c}$
. The third length is the distance along the
$a=x_{f}-x_{c}$
. The third length is the distance along the
 $x$
axis between the fixed point at the centre of the gate
$x$
axis between the fixed point at the centre of the gate
 $x_{0}$
and
$x_{0}$
and
 $x_{f}$
, i.e.
$x_{f}$
, i.e.
 $R_{c}=x_{f}-x_{0}$
.
$R_{c}=x_{f}-x_{0}$
.
Case S2
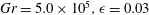 $Gr=5.0\times 10^{5},\unicode[STIX]{x1D716}=0.03$
; frontline
$Gr=5.0\times 10^{5},\unicode[STIX]{x1D716}=0.03$
; frontline
 $G(x,y)$
at
$G(x,y)$
at
 $t=32$
.
$t=32$
.
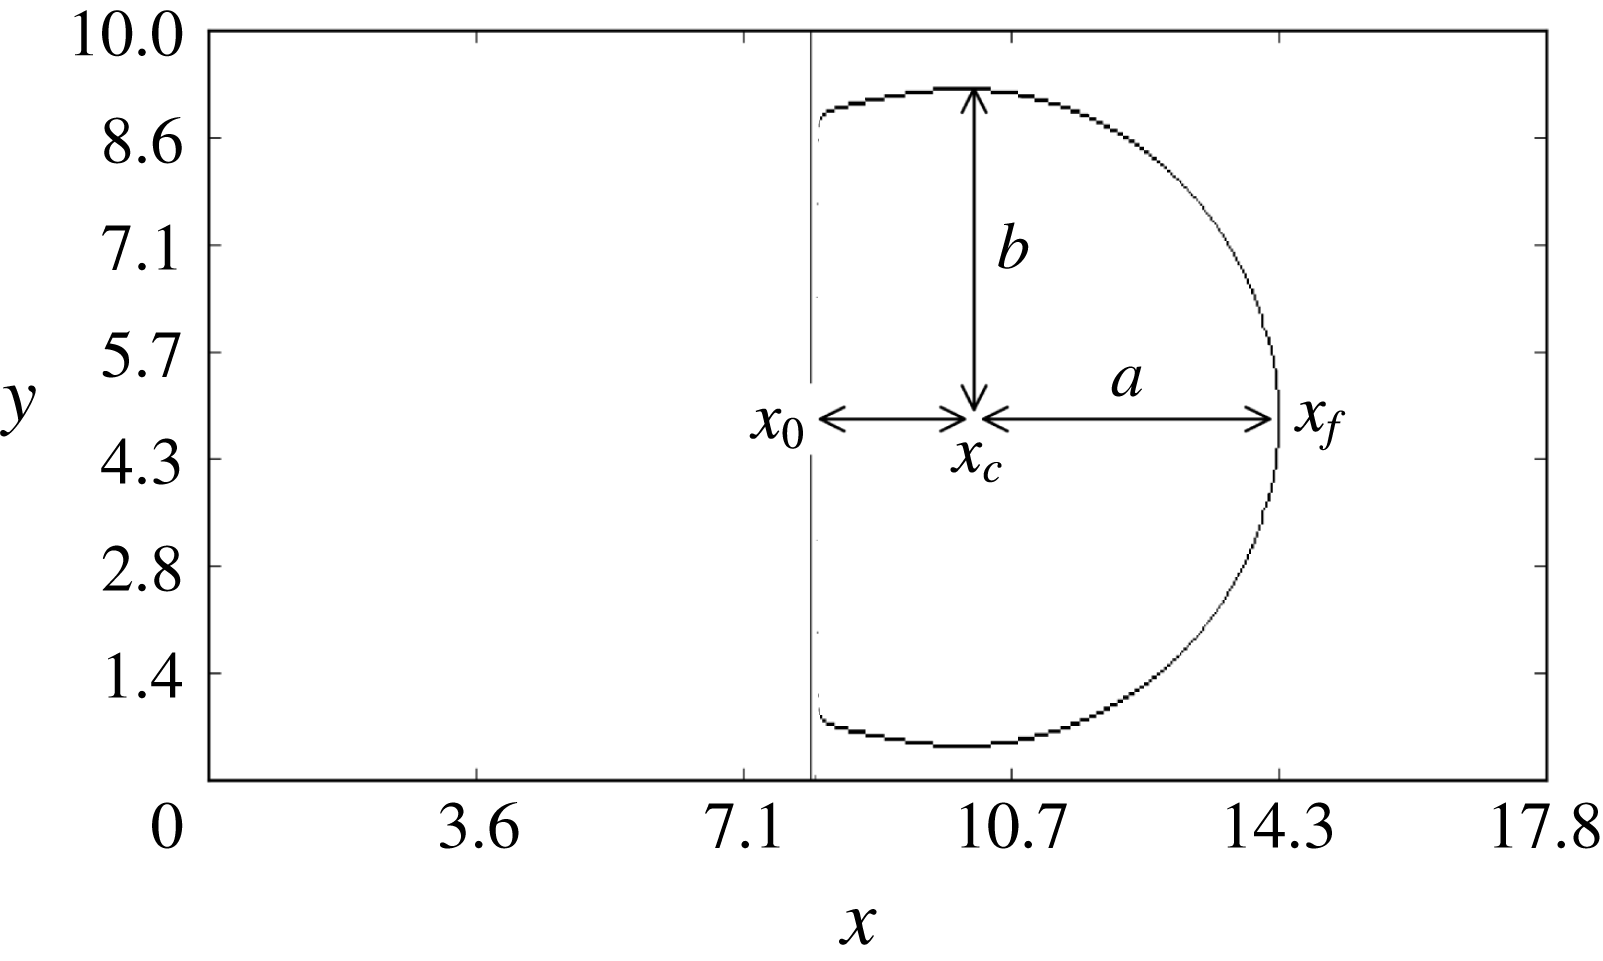
Case S13:
 $Gr=5.3\times 10^{8},\unicode[STIX]{x1D716}=0.02$
; (a)
$Gr=5.3\times 10^{8},\unicode[STIX]{x1D716}=0.02$
; (a)
 $a^{2}/b^{2}$
versus time; (b) radial front position
$a^{2}/b^{2}$
versus time; (b) radial front position
 $R$
and axial position
$R$
and axial position
 $x_{c}-x_{0}$
versus time.
$x_{c}-x_{0}$
versus time.
The correction procedure is applied to the simulations and the laboratory experiment. In the latter case the method is employed to locate the frontline obtained from the images of the experiment in the
 $(x,y)$
plane viewed from the camera positioned above the tank. The evolution in time of the frontline and the corrected radius is shown in figure 5.
$(x,y)$
plane viewed from the camera positioned above the tank. The evolution in time of the frontline and the corrected radius is shown in figure 5.
Notably, the present results are consistent with those of Maxworthy (Reference Maxworthy1980), who performed experiments with three-dimensional lock-exchange collapsing fluids in a stratified ambient fluid. In the mentioned study, the flow could be separated into a radial expansion and a rigid translation not only for the current’s front but also for the ring-like solitary waves propagating ahead on the interface between two fluid layers.
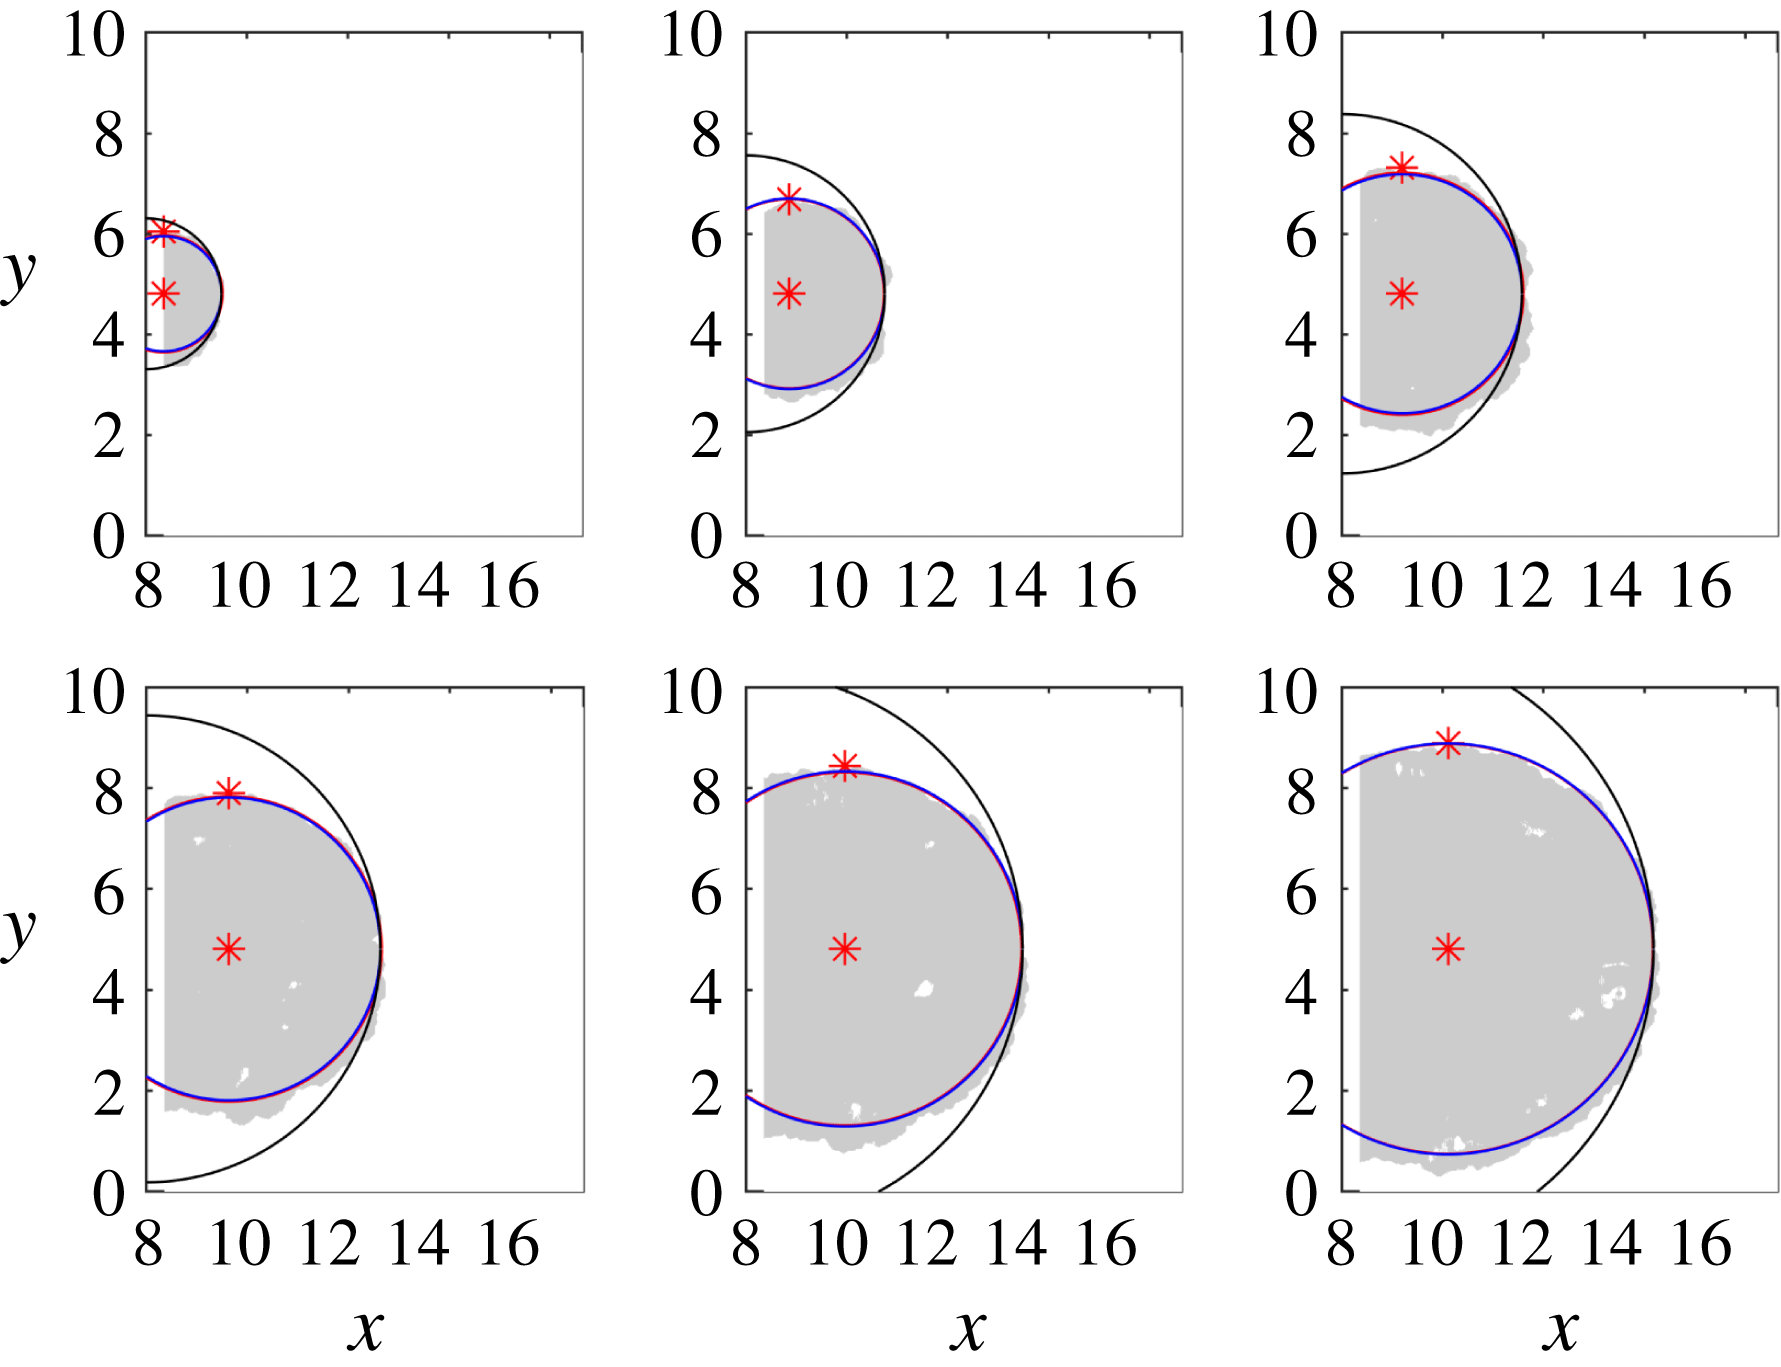
Case S12 (experiment) evolution in time of the frontline at
 $t=2.8$
, 5.7, 8.6, 11.5, 14.4 and 17.3; grey area is the planform of the gravity current; black line: circle centred at the centre of the separating gate and radius equal to the distance from the gate to the frontline on the
$t=2.8$
, 5.7, 8.6, 11.5, 14.4 and 17.3; grey area is the planform of the gravity current; black line: circle centred at the centre of the separating gate and radius equal to the distance from the gate to the frontline on the
 $x$
axis; blue lines: circles centred at
$x$
axis; blue lines: circles centred at
 $x_{c}$
and radius
$x_{c}$
and radius
 $R_{b}=R_{a}$
; asterisks: position of the centre (
$R_{b}=R_{a}$
; asterisks: position of the centre (
 $x_{c}$
,
$x_{c}$
,
 $y_{0}$
) and of the upper extremal (
$y_{0}$
) and of the upper extremal (
 $x_{c}$
,
$x_{c}$
,
 $y_{+}$
).
$y_{+}$
).
In the following, the symbol
 $R$
represents the radius of the axially symmetric current obtained from three-dimensional lock-exchange currents as previously described, whereas
$R$
represents the radius of the axially symmetric current obtained from three-dimensional lock-exchange currents as previously described, whereas
 $r$
indicates the radius of an equivalent axially symmetric current generated by a constant inflow at the axial position (as in Britter Reference Britter1979). In order to study the properties of the purely axially symmetric part of the current, the velocity field
$r$
indicates the radius of an equivalent axially symmetric current generated by a constant inflow at the axial position (as in Britter Reference Britter1979). In order to study the properties of the purely axially symmetric part of the current, the velocity field
 $u$
is decomposed in a plane translating velocity field
$u$
is decomposed in a plane translating velocity field
 ${\dot{x}}(t)_{f}$
and an axially symmetric velocity field
${\dot{x}}(t)_{f}$
and an axially symmetric velocity field
 $u_{r},u_{\unicode[STIX]{x1D703}},u_{z}$
, obtained by applying the ordinary transformation rules from a Cartesian
$u_{r},u_{\unicode[STIX]{x1D703}},u_{z}$
, obtained by applying the ordinary transformation rules from a Cartesian
 $(x,y,z)$
to a cylindrical coordinate system
$(x,y,z)$
to a cylindrical coordinate system
 $(R,\unicode[STIX]{x1D703},z)$
.
$(R,\unicode[STIX]{x1D703},z)$
.
 $\unicode[STIX]{x1D703}$
is, of course, the azimuthal angle.
$\unicode[STIX]{x1D703}$
is, of course, the azimuthal angle.
3.1.1 Low Grashof number
At very low Grashof numbers,
 $Gr=8\times 10^{4}-5\times 10^{5}$
, the current at the bottom assumes an almost circular frontline and spreads uniformly. In these cases
$Gr=8\times 10^{4}-5\times 10^{5}$
, the current at the bottom assumes an almost circular frontline and spreads uniformly. In these cases
 $Re<800$
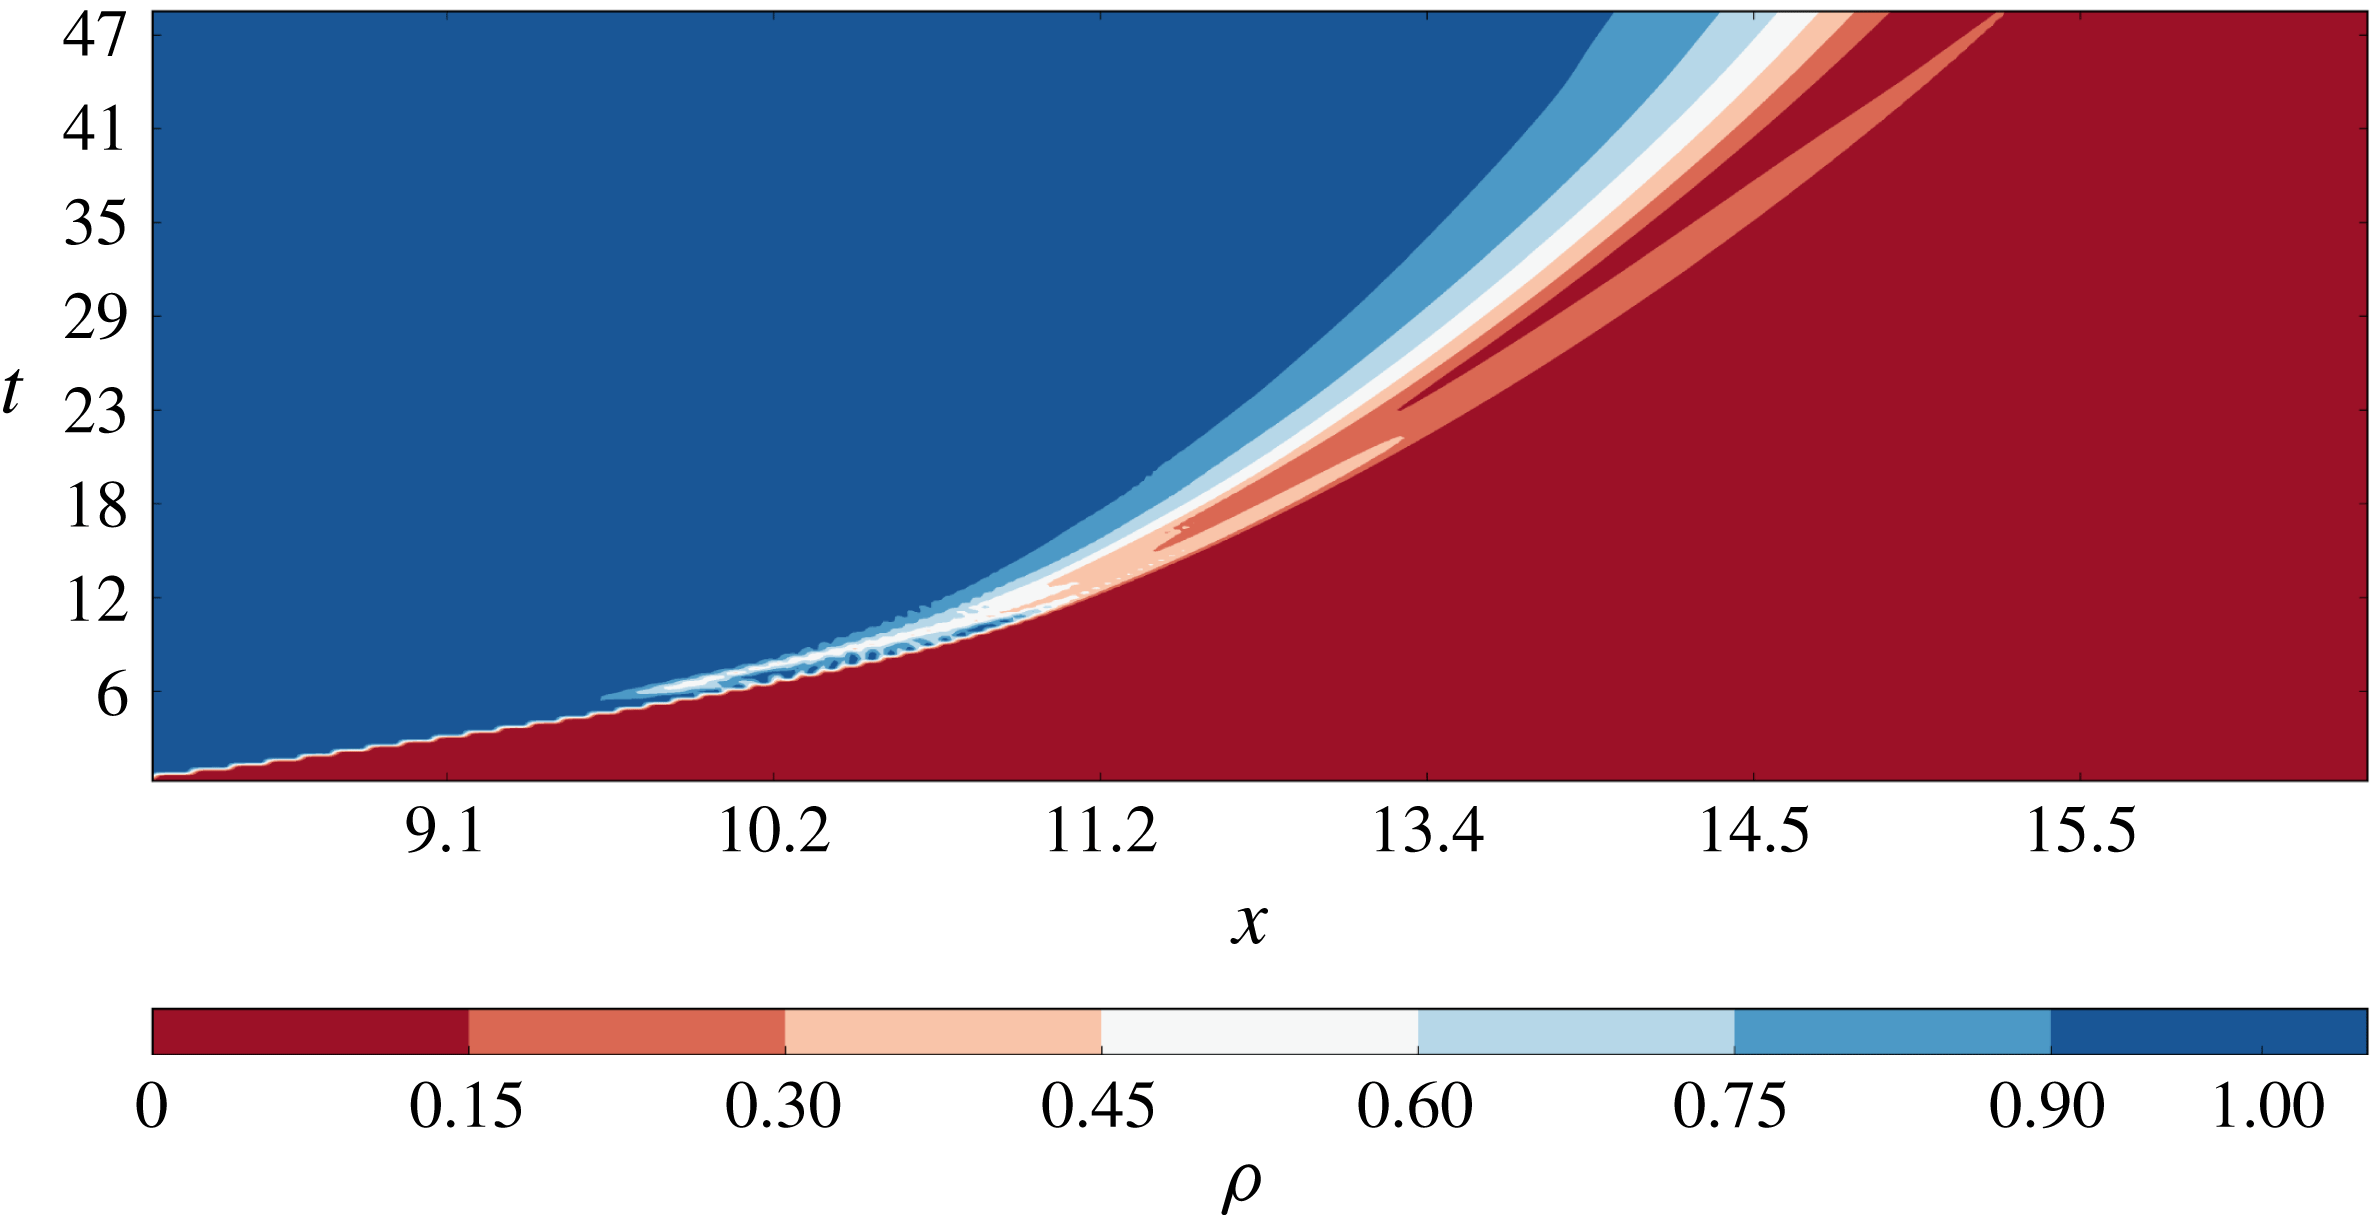
, there is no evidence of lobe and cleft instabilities at the frontline and the flow is essentially laminar. The presence of periodic structures in the flow can be investigated by using Hövmoller diagrams (HDs) in the density field. In the present analysis of the numerical simulations, HDs are created using the time-varying density field
$Re<800$
, there is no evidence of lobe and cleft instabilities at the frontline and the flow is essentially laminar. The presence of periodic structures in the flow can be investigated by using Hövmoller diagrams (HDs) in the density field. In the present analysis of the numerical simulations, HDs are created using the time-varying density field
 $\unicode[STIX]{x1D70C}(x,y_{0},z_{c},t)$
on the centreline of the tank at the point
$\unicode[STIX]{x1D70C}(x,y_{0},z_{c},t)$
on the centreline of the tank at the point
 $z_{c}=0.12$
,
$z_{c}=0.12$
,
 $y=y_{0}$
. The diagram is relatively sensitive to the choice of the vertical level
$y=y_{0}$
. The diagram is relatively sensitive to the choice of the vertical level
 $z_{c}$
, in the sense that, mostly due to the continuously decreasing depth of the current, if
$z_{c}$
, in the sense that, mostly due to the continuously decreasing depth of the current, if
 $z_{c}$
is too low it would show discontinuous bands, while if
$z_{c}$
is too low it would show discontinuous bands, while if
 $z_{c}$
is too high, it would make the bands appear to merge early. In the HDs, the density field extracted at the centreline is mapped in the space
$z_{c}$
is too high, it would make the bands appear to merge early. In the HDs, the density field extracted at the centreline is mapped in the space
 $(x,t)$
. When present, quasi-periodic perturbations in the density field appear in a diagram with series of alternating bands having different colours. As shown in figure 6, at very low
$(x,t)$
. When present, quasi-periodic perturbations in the density field appear in a diagram with series of alternating bands having different colours. As shown in figure 6, at very low
 $Gr$
there is no indication of perturbations in the density field, except for the advancement in time of the external frontline.
$Gr$
there is no indication of perturbations in the density field, except for the advancement in time of the external frontline.
Hövmoller diagram, case S1, simulation
 $Gr=8.1\times 10^{4}$
.
$Gr=8.1\times 10^{4}$
.
Density isosurface at
 $\unicode[STIX]{x1D70C}=3\,\%$
, case S3,
$\unicode[STIX]{x1D70C}=3\,\%$
, case S3,
 $t=8.7$
.
$t=8.7$
.
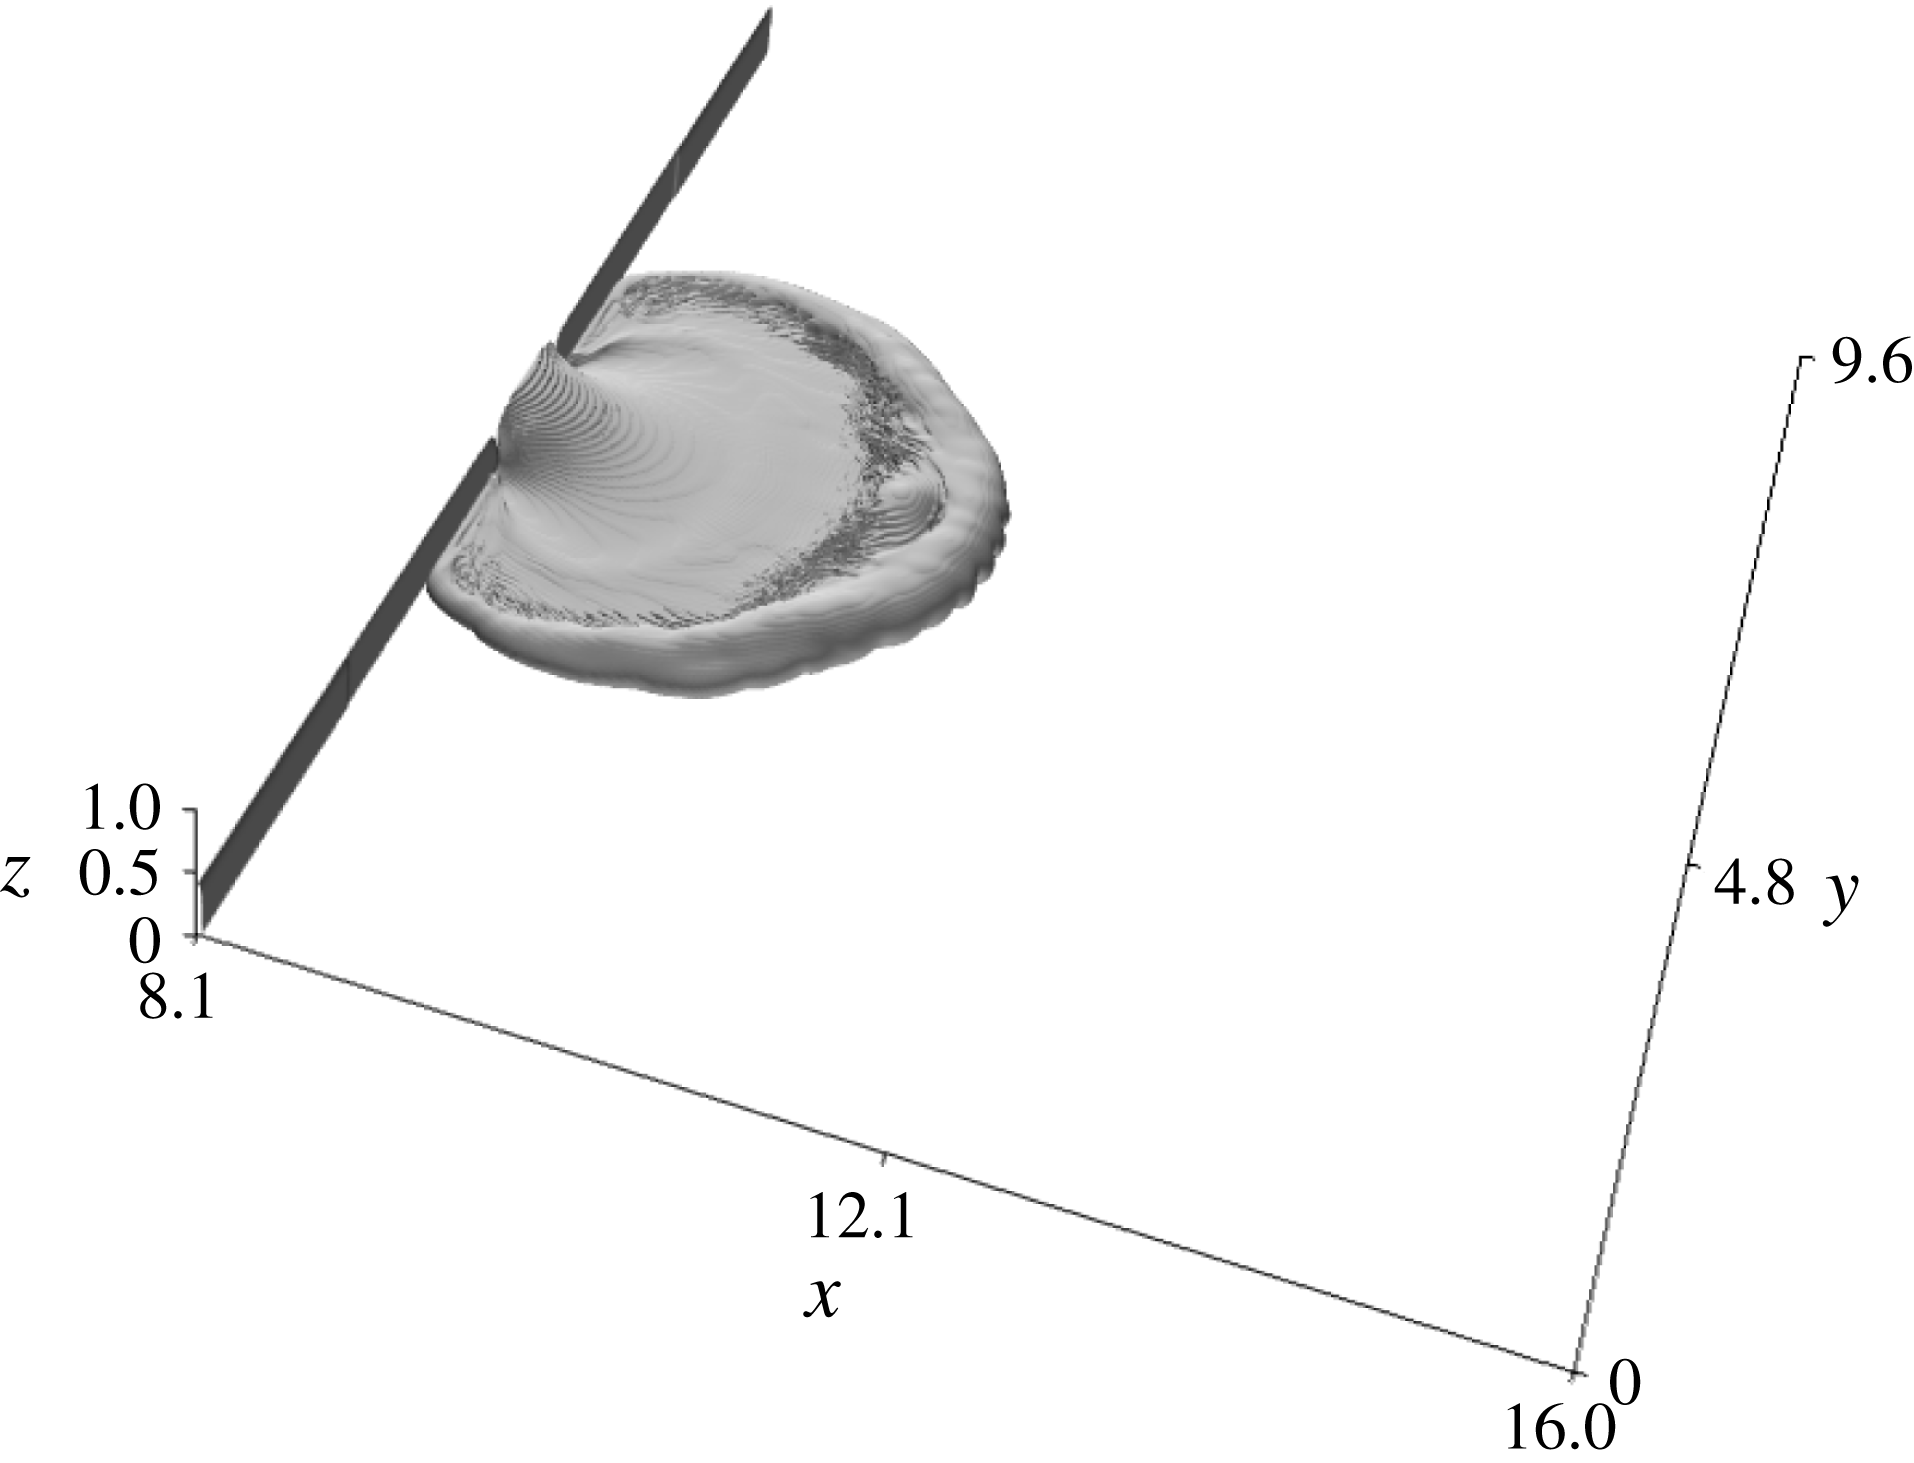
At
 $Gr=2\times 10^{6}$
, after
$Gr=2\times 10^{6}$
, after
 $t\sim 8.7$
from the ‘removal of the gate’, the external front structure assumes toroidal features in the horizontal plane, stretching out from the body of the current (figure 7).
$t\sim 8.7$
from the ‘removal of the gate’, the external front structure assumes toroidal features in the horizontal plane, stretching out from the body of the current (figure 7).
A Froude number
 $Fr_{H}=\bar{u}_{r}/\sqrt{\overline{g^{\prime }h}}$
(Shin, Dalziel & Linden Reference Shin, Dalziel and Linden2004) is introduced in terms of vertically averaged, radial component of velocity
$Fr_{H}=\bar{u}_{r}/\sqrt{\overline{g^{\prime }h}}$
(Shin, Dalziel & Linden Reference Shin, Dalziel and Linden2004) is introduced in terms of vertically averaged, radial component of velocity
 $\bar{u}_{r}$
and the local average buoyancy velocity
$\bar{u}_{r}$
and the local average buoyancy velocity
 $U_{l}=\sqrt{\overline{g^{\prime }h}}$
, where
$U_{l}=\sqrt{\overline{g^{\prime }h}}$
, where
 $\overline{g^{\prime }h}=g\int (\unicode[STIX]{x1D70C}(x,y,z)-\unicode[STIX]{x1D70C}_{2}/\unicode[STIX]{x1D70C}_{1})\,\text{d}z$
. Defined in this way,
$\overline{g^{\prime }h}=g\int (\unicode[STIX]{x1D70C}(x,y,z)-\unicode[STIX]{x1D70C}_{2}/\unicode[STIX]{x1D70C}_{1})\,\text{d}z$
. Defined in this way,
 $Fr_{H}$
is the ratio between the vertically averaged radial outward velocity and the group velocity of the most rapid waves propagating inward at the interface, measured relative to the mean outward flow. When
$Fr_{H}$
is the ratio between the vertically averaged radial outward velocity and the group velocity of the most rapid waves propagating inward at the interface, measured relative to the mean outward flow. When
 $Fr_{H}\,>\,1$
disturbances cannot propagate radially backward, and, as in the planar case, a circular jump in the depth of the fluid is expected between the annular region at high velocity and another region with lower velocity (Thorpe & Kavcic Reference Thorpe and Kavcic2008; Bhattacharjee & Ray Reference Bhattacharjee and Ray2011). The kinematics of the flow on the mid-plane
$Fr_{H}\,>\,1$
disturbances cannot propagate radially backward, and, as in the planar case, a circular jump in the depth of the fluid is expected between the annular region at high velocity and another region with lower velocity (Thorpe & Kavcic Reference Thorpe and Kavcic2008; Bhattacharjee & Ray Reference Bhattacharjee and Ray2011). The kinematics of the flow on the mid-plane
 $y=y_{0}$
is shown in figure 8 using the modulus of the fluid velocity vector scaled by
$y=y_{0}$
is shown in figure 8 using the modulus of the fluid velocity vector scaled by
 $U_{l}$
, i.e.
$U_{l}$
, i.e.
 $|\boldsymbol{u}|/\sqrt{\overline{g^{\prime }h}}$
. The analysis of the figure reveals an ascending band followed by an abruptly descending one, similar to the profile of a breaking wave. This appears associated with the interaction between the external front and a successively generated internal shock that follow closely. The introduction of the local buoyancy scale
$|\boldsymbol{u}|/\sqrt{\overline{g^{\prime }h}}$
. The analysis of the figure reveals an ascending band followed by an abruptly descending one, similar to the profile of a breaking wave. This appears associated with the interaction between the external front and a successively generated internal shock that follow closely. The introduction of the local buoyancy scale
 $h_{l}$
provides a method for evaluating the depth of the current that does not depend on an arbitrary fixed threshold in the density field (Shin et al.
Reference Shin, Dalziel and Linden2004),
$h_{l}$
provides a method for evaluating the depth of the current that does not depend on an arbitrary fixed threshold in the density field (Shin et al.
Reference Shin, Dalziel and Linden2004),
 $h_{l}=\overline{g^{\prime }h}/g^{\prime }$
. A second height
$h_{l}=\overline{g^{\prime }h}/g^{\prime }$
. A second height
 $h_{t}$
is calculated as the height of the
$h_{t}$
is calculated as the height of the
 $\unicode[STIX]{x1D70C}=3\,\%$
isopycnal. While
$\unicode[STIX]{x1D70C}=3\,\%$
isopycnal. While
 $h_{l}$
remains well under the depth at which mixing is effective,
$h_{l}$
remains well under the depth at which mixing is effective,
 $h_{t}$
is largely affected by mixing with the ambient fluid, so where the two curves diverge in figure 8, entrainment must have occurred. In the initial development of the current, the flow has a
$h_{t}$
is largely affected by mixing with the ambient fluid, so where the two curves diverge in figure 8, entrainment must have occurred. In the initial development of the current, the flow has a
 $Fr_{H}>1$
in a disk around the axis, it shows a transition to
$Fr_{H}>1$
in a disk around the axis, it shows a transition to
 $Fr_{H}<1$
around
$Fr_{H}<1$
around
 $x=10.5$
and shows again
$x=10.5$
and shows again
 $Fr_{H}>1$
in a small ring at the head of the current. This behaviour is consistent with the presence of the circular hydraulic jumps in the core of the current shown by the line
$Fr_{H}>1$
in a small ring at the head of the current. This behaviour is consistent with the presence of the circular hydraulic jumps in the core of the current shown by the line
 $h_{l}$
. The depth indicated by the line
$h_{l}$
. The depth indicated by the line
 $h_{t}$
is instead mostly related to the action of the Kelvin–Helmholtz billows.
$h_{t}$
is instead mostly related to the action of the Kelvin–Helmholtz billows.
(a) Non-dimensional velocity
 $|\boldsymbol{u}|/U_{l}$
on the mid-plane
$|\boldsymbol{u}|/U_{l}$
on the mid-plane
 $y=y_{0}$
; the thick black line indicates the depth
$y=y_{0}$
; the thick black line indicates the depth
 $h_{l}=\overline{g^{\prime }h}/g^{\prime }$
and the dashed line marks
$h_{l}=\overline{g^{\prime }h}/g^{\prime }$
and the dashed line marks
 $h_{t}$
, i.e. the interface
$h_{t}$
, i.e. the interface
 $\unicode[STIX]{x1D70C}=3\,\%$
, (b) Froude number
$\unicode[STIX]{x1D70C}=3\,\%$
, (b) Froude number
 $Fr_{H}$
versus
$Fr_{H}$
versus
 $x$
. Case S3,
$x$
. Case S3,
 $t=8.7$
.
$t=8.7$
.
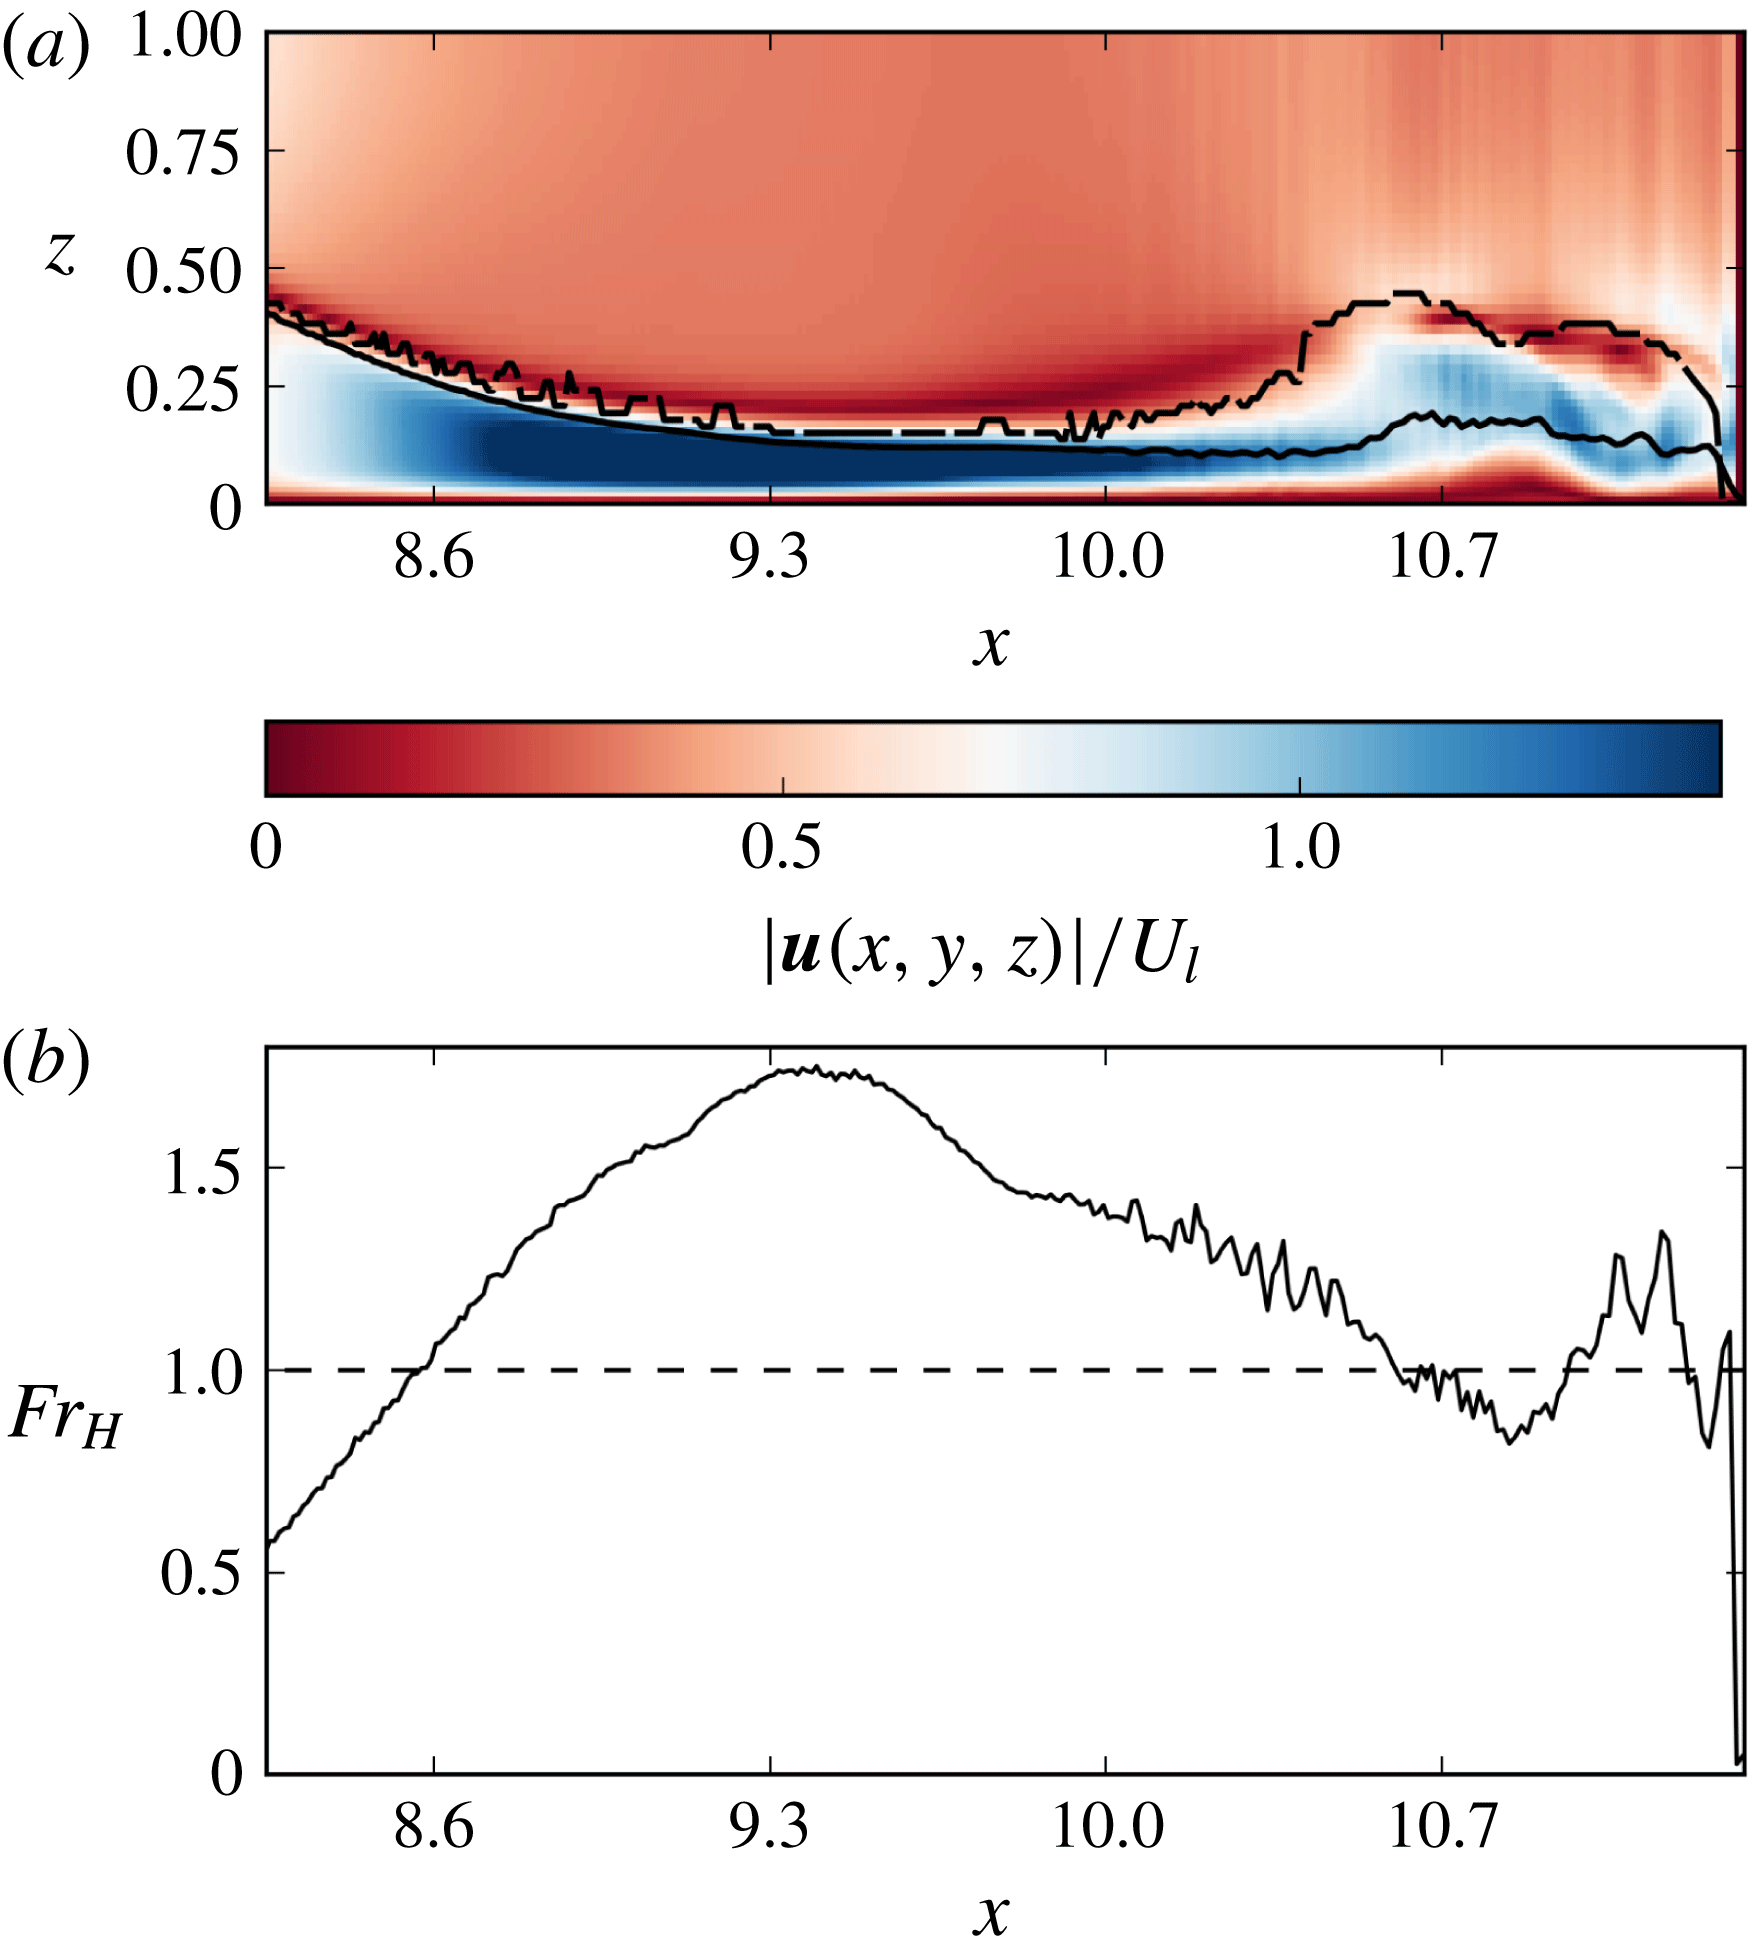
(a) Non-dimensional velocity
 $|\boldsymbol{u}|/U_{l}$
on the mid-plane
$|\boldsymbol{u}|/U_{l}$
on the mid-plane
 $y=y_{0}$
; the thick black line indicates the depth
$y=y_{0}$
; the thick black line indicates the depth
 $h_{l}=\overline{g^{\prime }h}/g^{\prime }$
and the dashed line marks
$h_{l}=\overline{g^{\prime }h}/g^{\prime }$
and the dashed line marks
 $h_{t}$
, i.e. the interface
$h_{t}$
, i.e. the interface
 $\unicode[STIX]{x1D70C}=3\,\%$
, (b) Froude number
$\unicode[STIX]{x1D70C}=3\,\%$
, (b) Froude number
 $Fr_{H}$
versus
$Fr_{H}$
versus
 $x$
. Case S3,
$x$
. Case S3,
 $t=16$
.
$t=16$
.
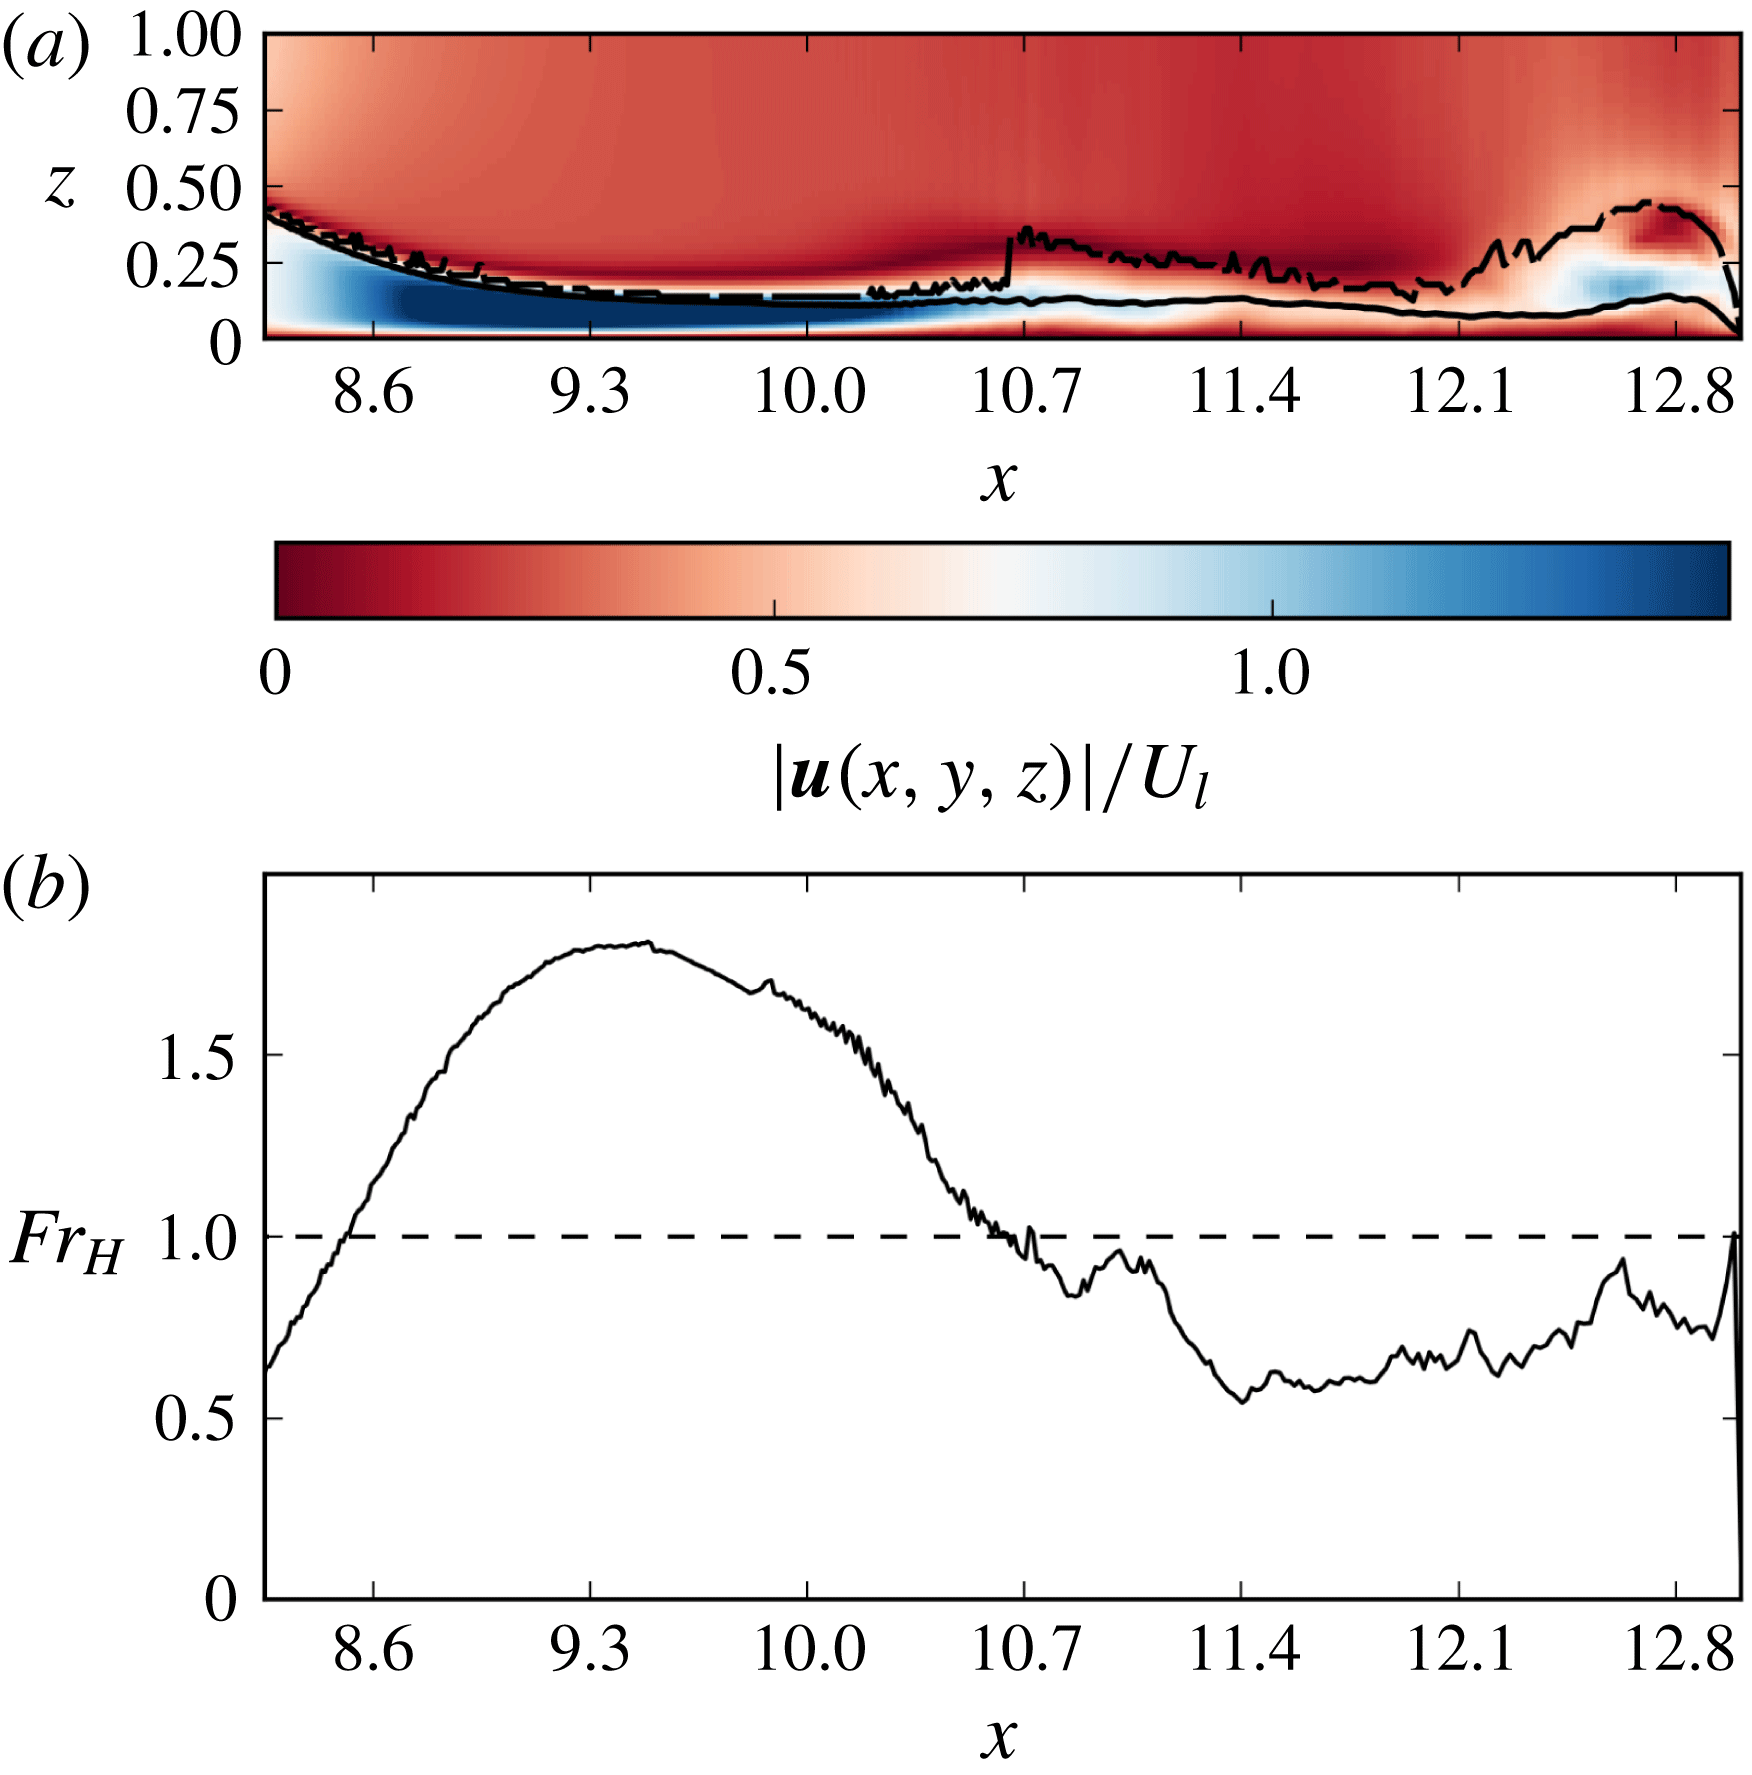
At successive times, the value of
 $|\boldsymbol{u}|/U_{s}$
behind the front decreases in intensity with
$|\boldsymbol{u}|/U_{s}$
behind the front decreases in intensity with
 $R$
, and its distribution becomes more uniform along the body of the current outside the spreading area at
$R$
, and its distribution becomes more uniform along the body of the current outside the spreading area at
 $x<10.5$
(figure 9). Correspondingly, the
$x<10.5$
(figure 9). Correspondingly, the
 $Fr_{H}$
number is always sub-critical beyond the initial spreading area.
$Fr_{H}$
number is always sub-critical beyond the initial spreading area.
Hövmoller diagram, case S3, simulation
 $Gr=2.0\times 10^{6}$
.
$Gr=2.0\times 10^{6}$
.
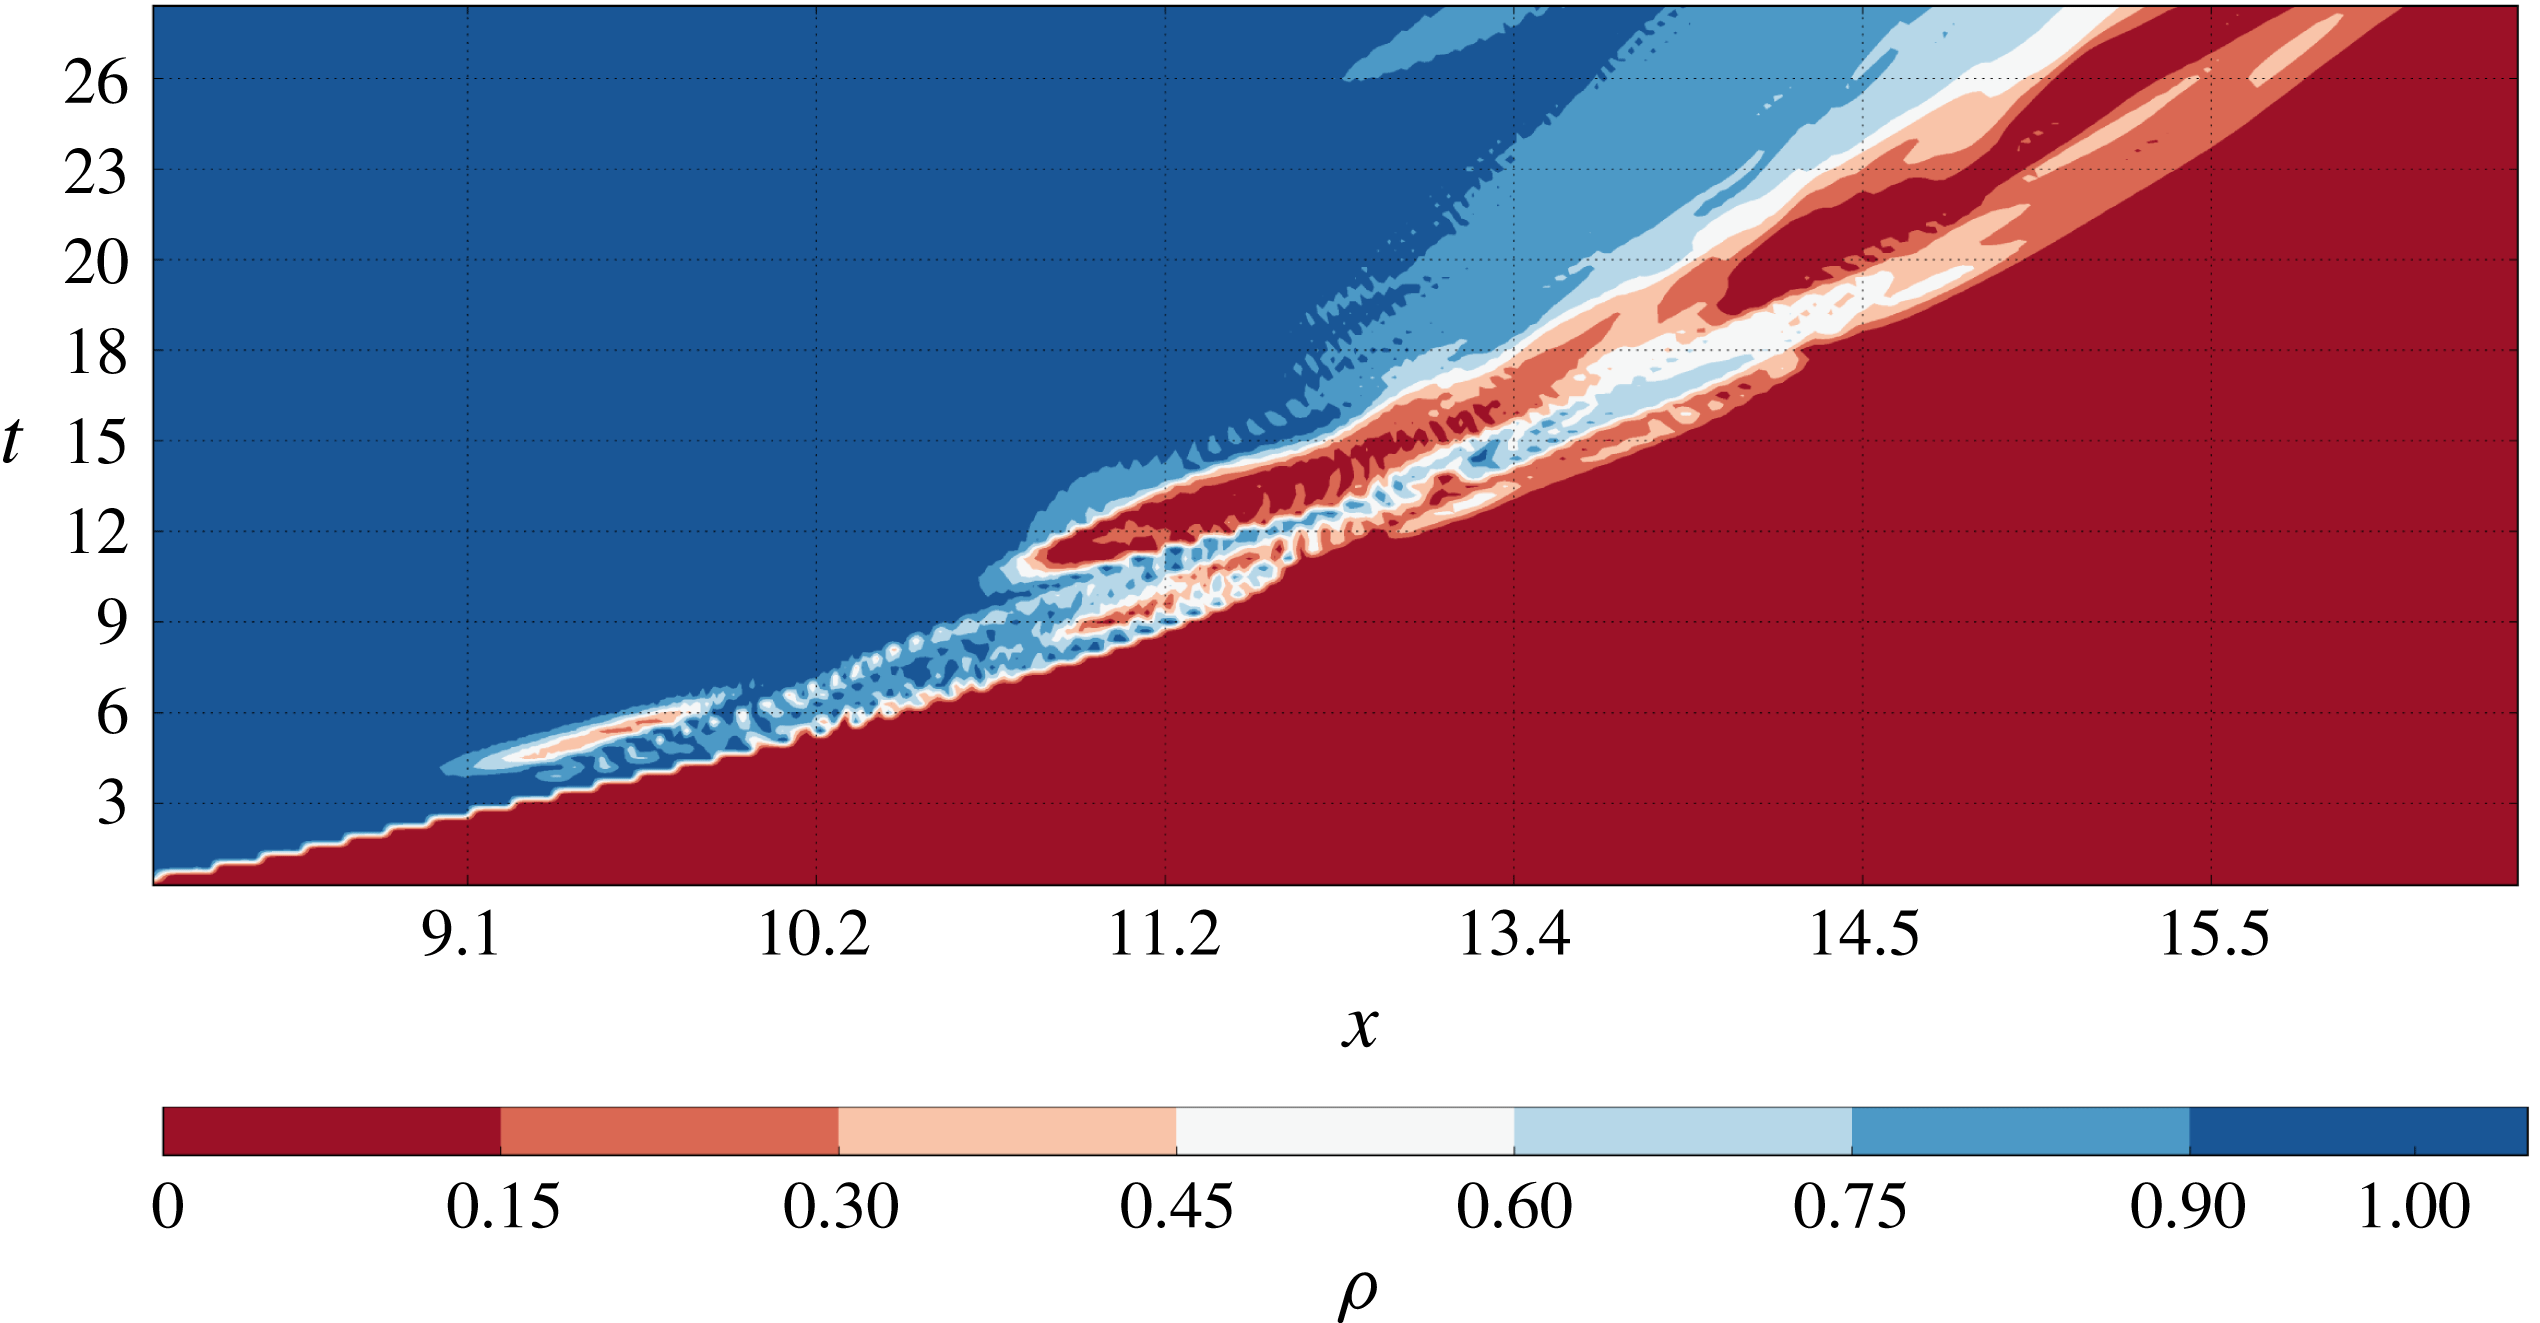
The analysis of the HD in figure 10 shows the evolution in time of the frontline, which is closely followed by a secondary, isolated, perturbation in the density field. Comparing this behaviour with the one in figure 6 it is clear that it represents the trace of an increased complexity in the structure of the head of the current, which is now composed of a ring of flow limited by two close frontal structures, one internal and the other at the external edge. This is consistent with the information provided by the Froude number as a function of
 $x$
shown in figure 8(b).
$x$
shown in figure 8(b).
The formation of isolated hydraulic shocks that follow the external front, bounding the head of the gravity current from the inside, is the distinctive feature of all the cases investigated up to
 $Gr=8\times 10^{6}$
. It is also completely consistent with the solution of the theoretical model proposed by Garvine (Reference Garvine1984). At even larger values of
$Gr=8\times 10^{6}$
. It is also completely consistent with the solution of the theoretical model proposed by Garvine (Reference Garvine1984). At even larger values of
 $Gr$
, starting from case S6 (
$Gr$
, starting from case S6 (
 $Gr=2\times 10^{8}$
), the development of the current is dominated by the continuous production of alternating bands of fluid at different densities in the horizontal plane, i.e. ‘rings’. These features are described in the next subsection.
$Gr=2\times 10^{8}$
), the development of the current is dominated by the continuous production of alternating bands of fluid at different densities in the horizontal plane, i.e. ‘rings’. These features are described in the next subsection.
3.1.2 High Grashof number
At sufficiently high-inflow rates, alternating bands (or rings) can be observed in every horizontal section of the density and velocity fields. Rings appear as axisymmetric, periodic structures (see, for example, figures 11, 12) which persist during the entire simulation and extend mostly over a limited domain of the tank. They form at some distance from the symmetry axis and move inside the current as internal shocks. The rings maintain some sort of individuality for a variable (but relatively short) distance, after which they merge with each other and generally decay beyond a critical distance.
Density field on the horizontal plane at
 $z=0.1$
,
$z=0.1$
,
 $t=8.7$
, case S11.
$t=8.7$
, case S11.
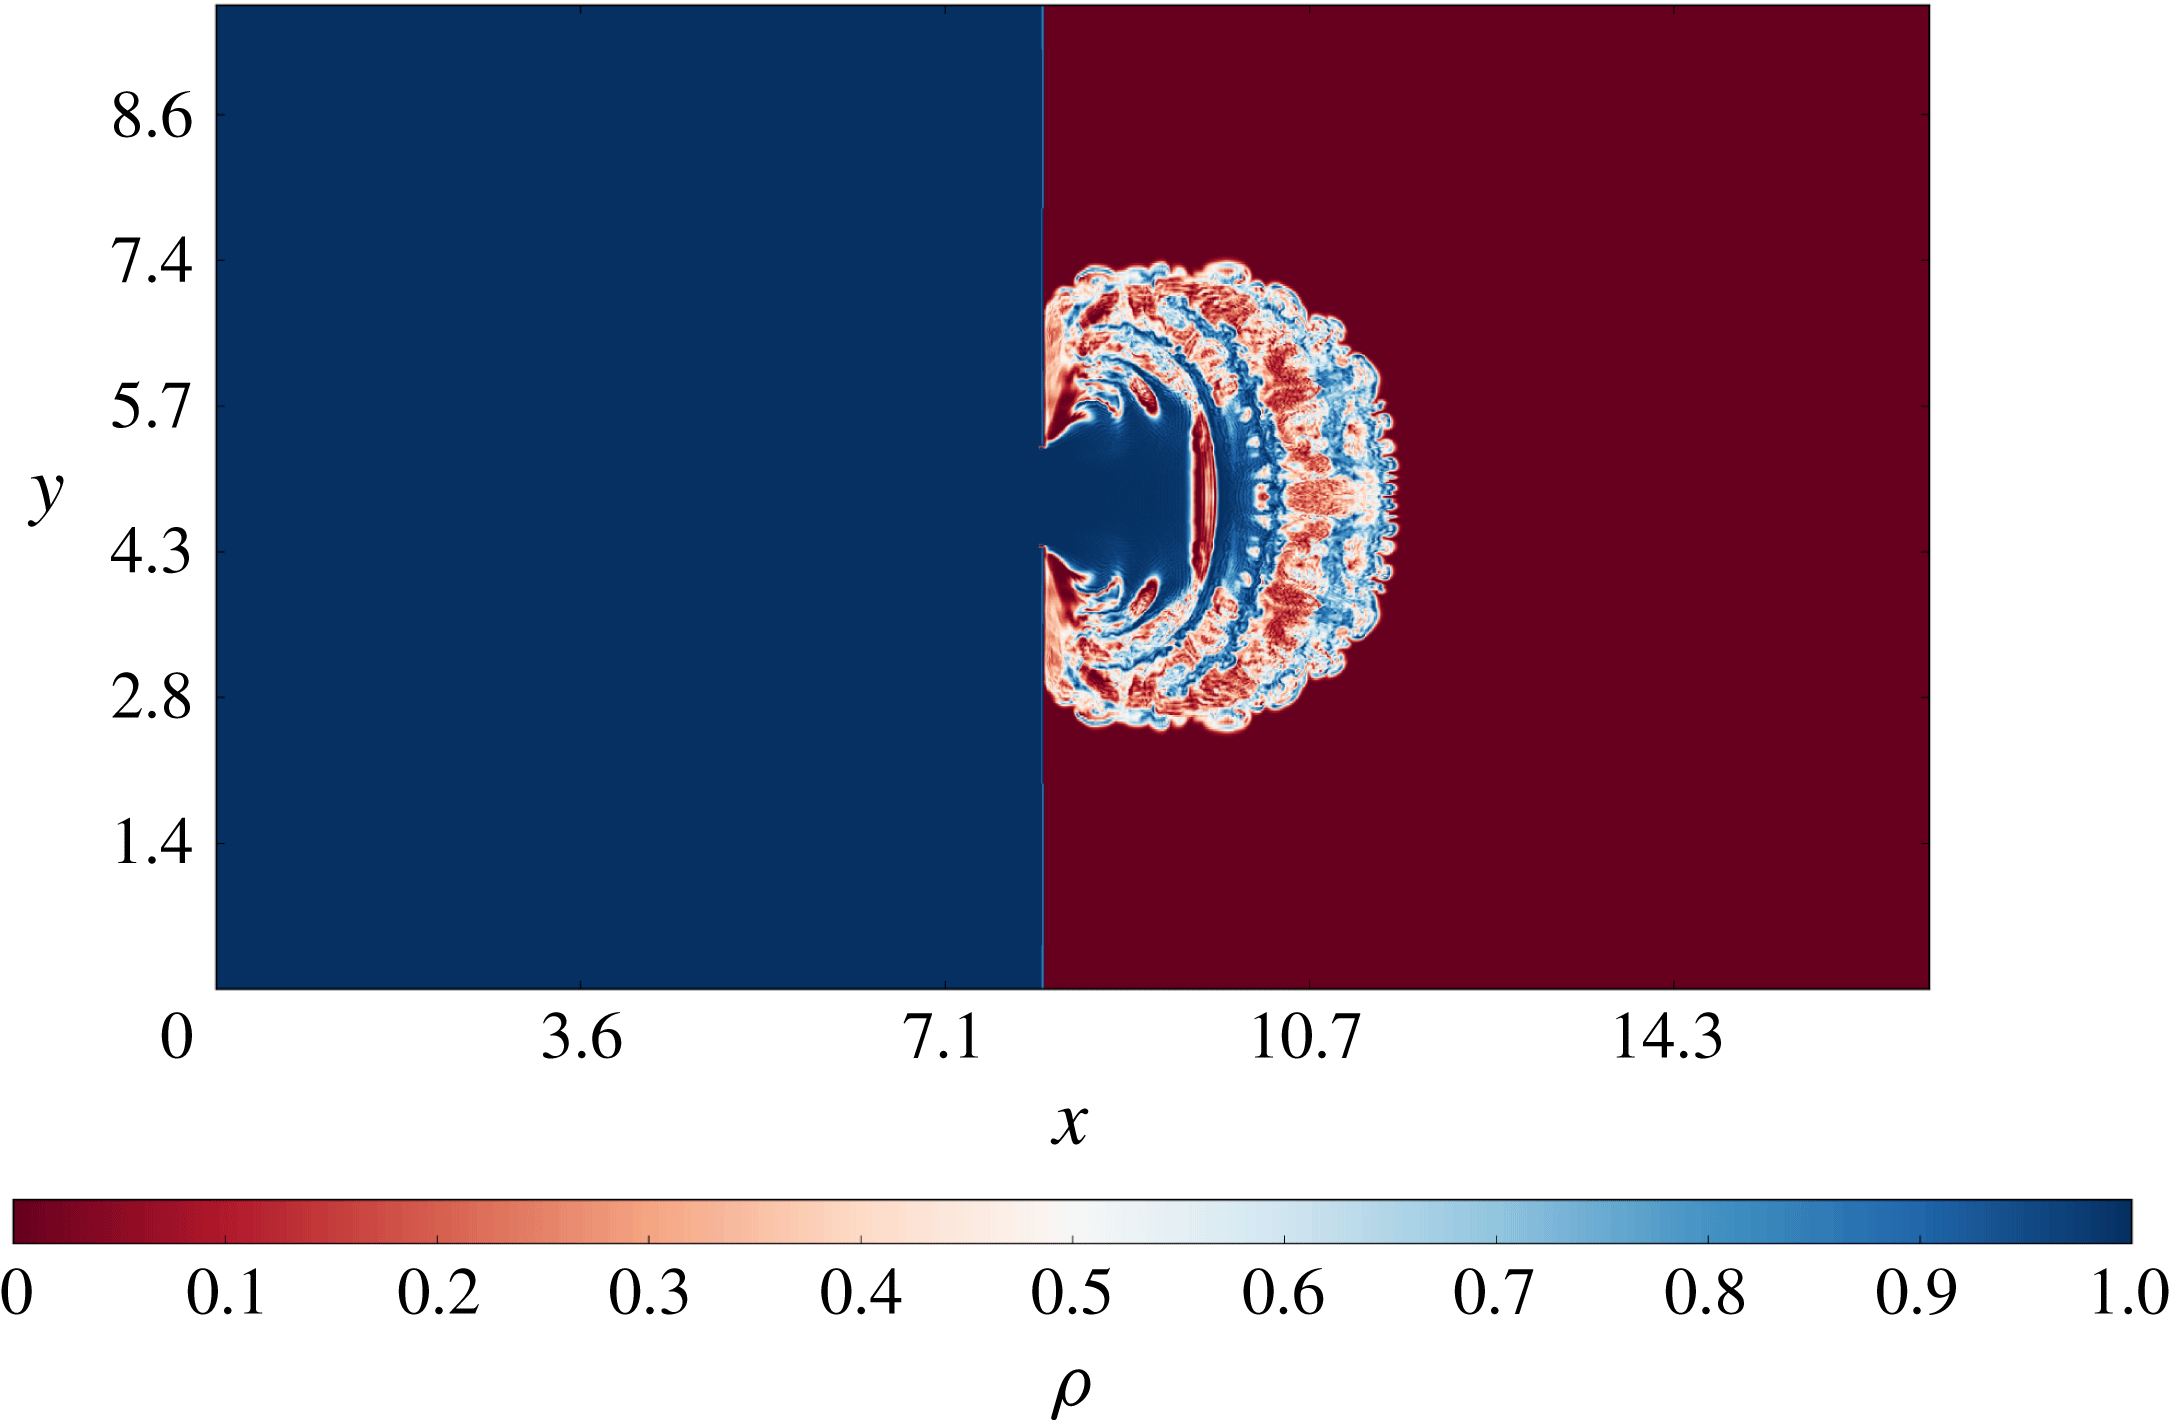
Top view image of the experiment S12,
 $t=14.5.$
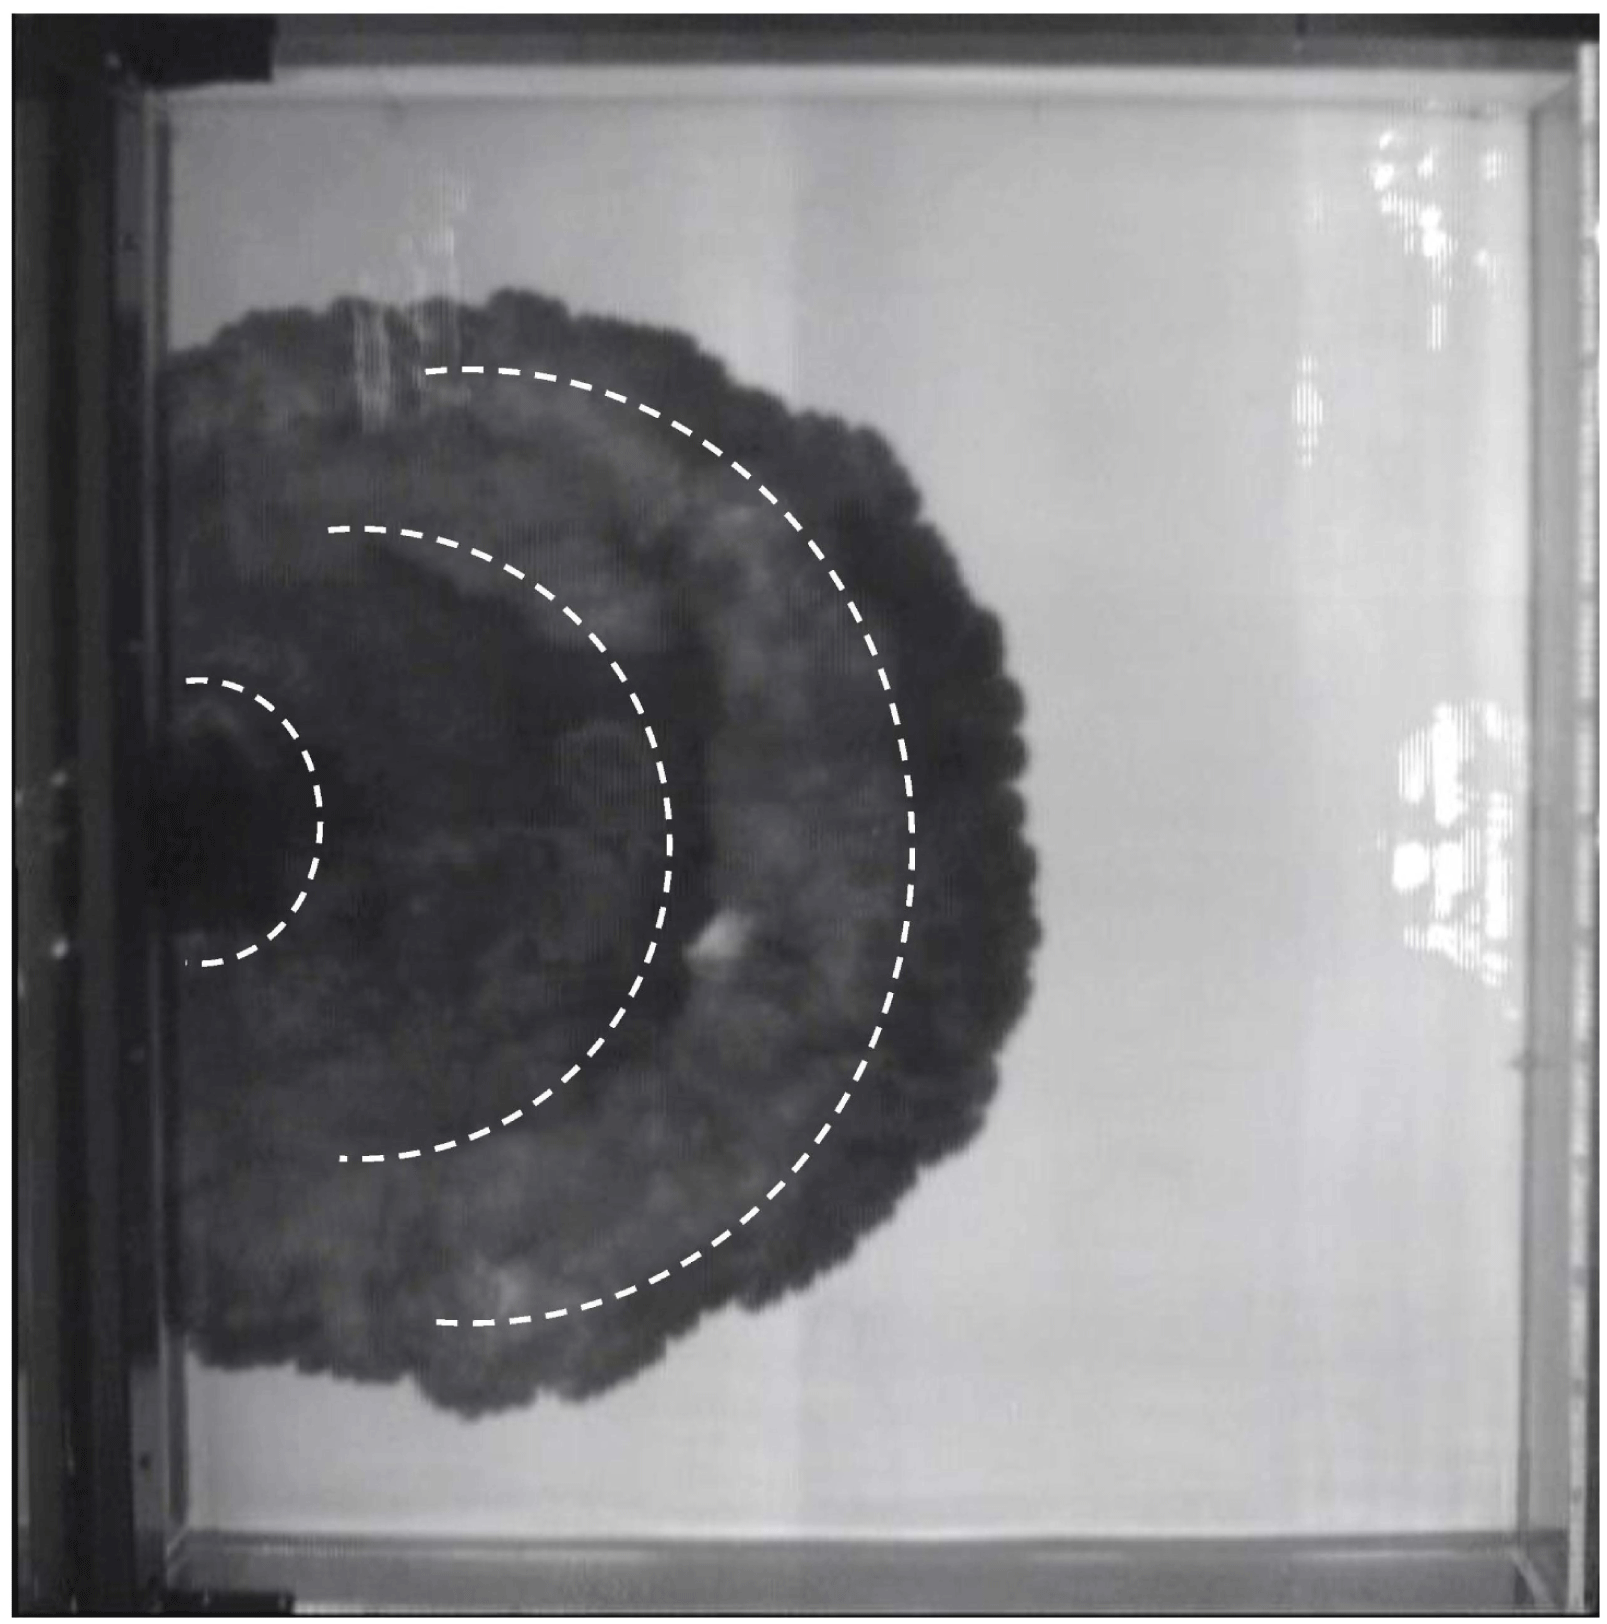
Case S11:
 $3\,\%$
 $\unicode[STIX]{x1D70C}_{\ast }$
surface,
$\unicode[STIX]{x1D70C}_{\ast }$
surface,
 $t=8.7$
.
$t=8.7$
.
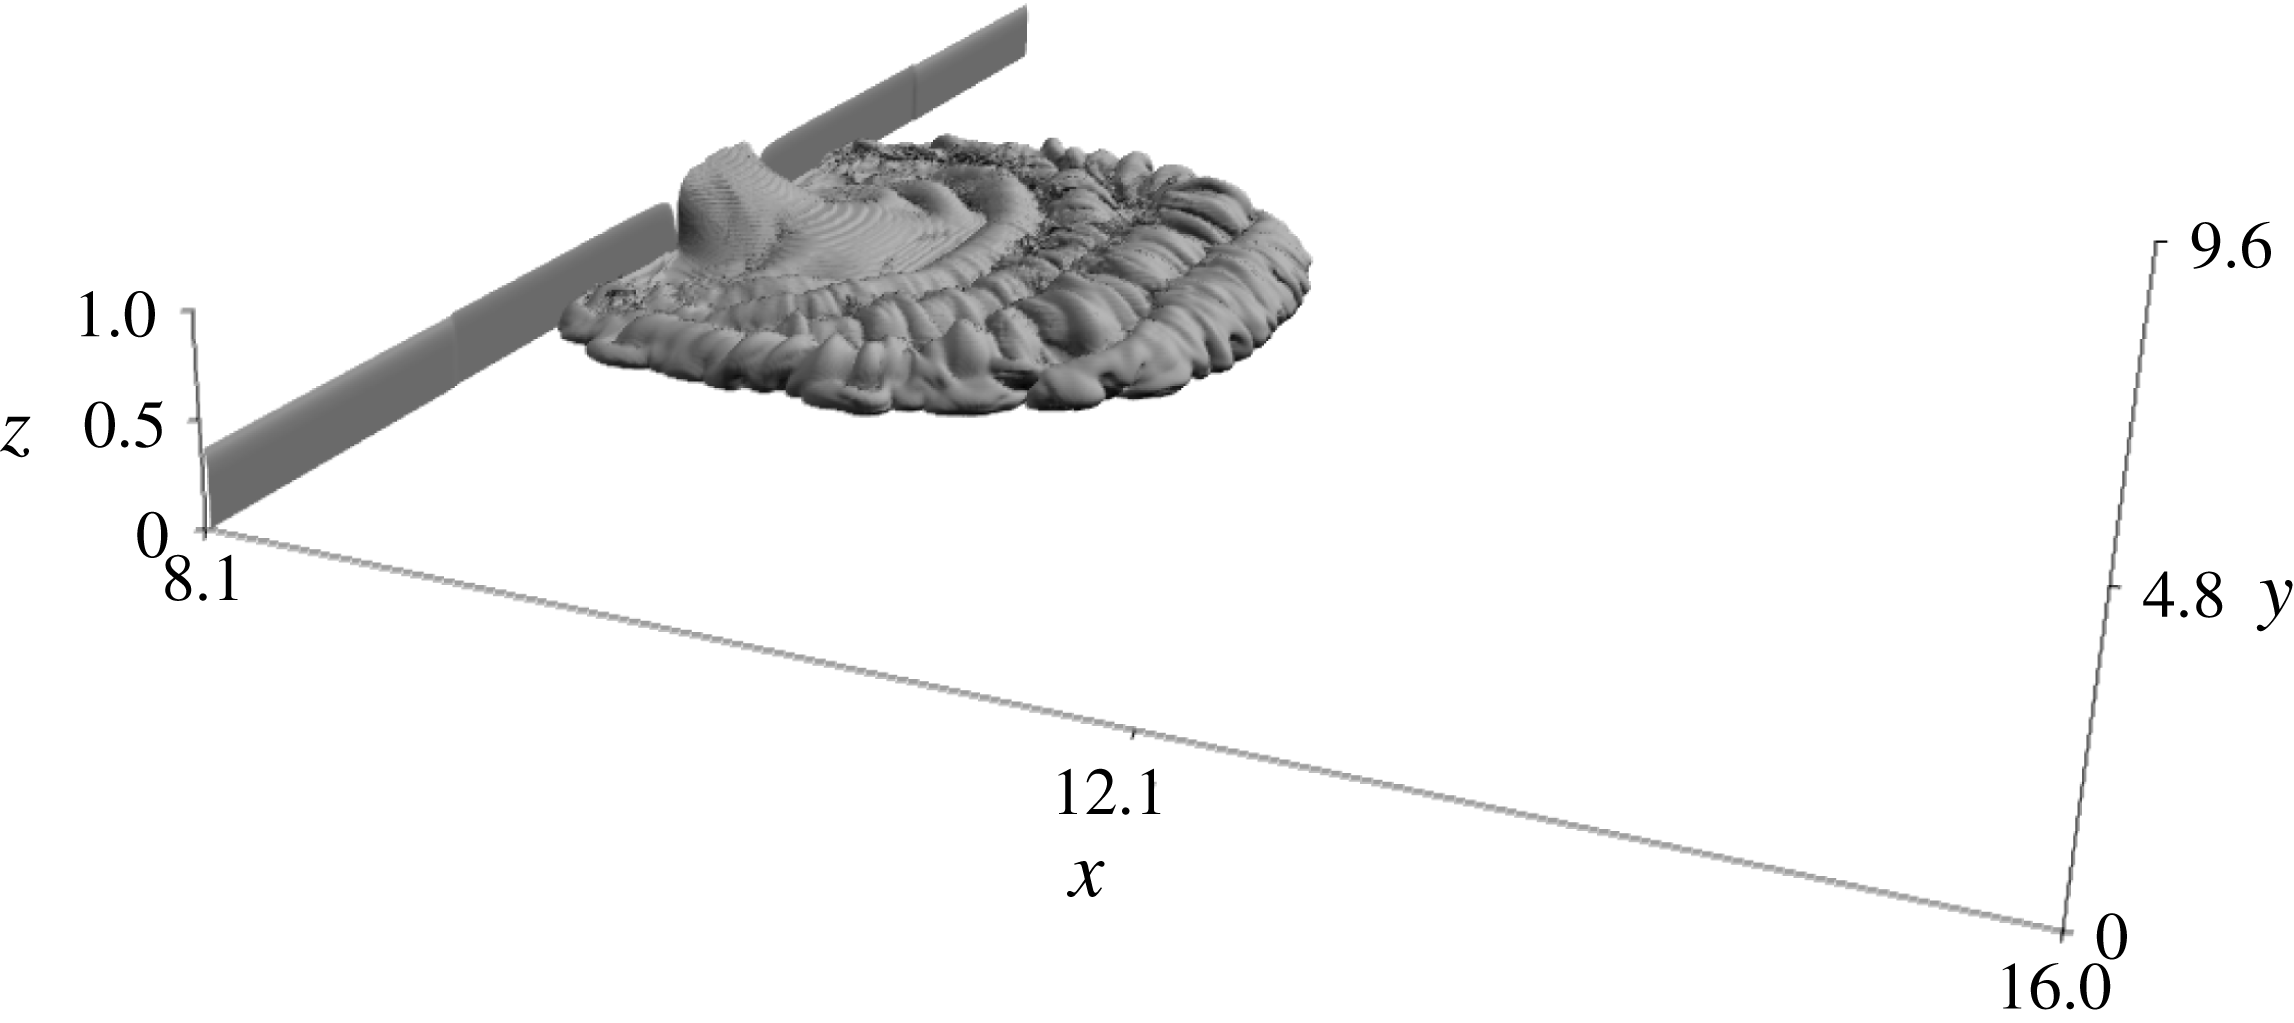
(a) Non-dimensional velocity
 $|\boldsymbol{u}|/U_{l}$
on the mid-plane
$|\boldsymbol{u}|/U_{l}$
on the mid-plane
 $y=y_{0}$
; the thick black line indicates the depth
$y=y_{0}$
; the thick black line indicates the depth
 $h_{l}=\sqrt{\overline{g^{\prime }h}}/g_{0}^{\prime }$
and the dashed line marks the interface
$h_{l}=\sqrt{\overline{g^{\prime }h}}/g_{0}^{\prime }$
and the dashed line marks the interface
 $\unicode[STIX]{x1D70C}=3\,\%$
, (b) Froude number
$\unicode[STIX]{x1D70C}=3\,\%$
, (b) Froude number
 $Fr_{H}$
versus
$Fr_{H}$
versus
 $x$
; case S11,
$x$
; case S11,
 $t=8.7$
.
$t=8.7$
.
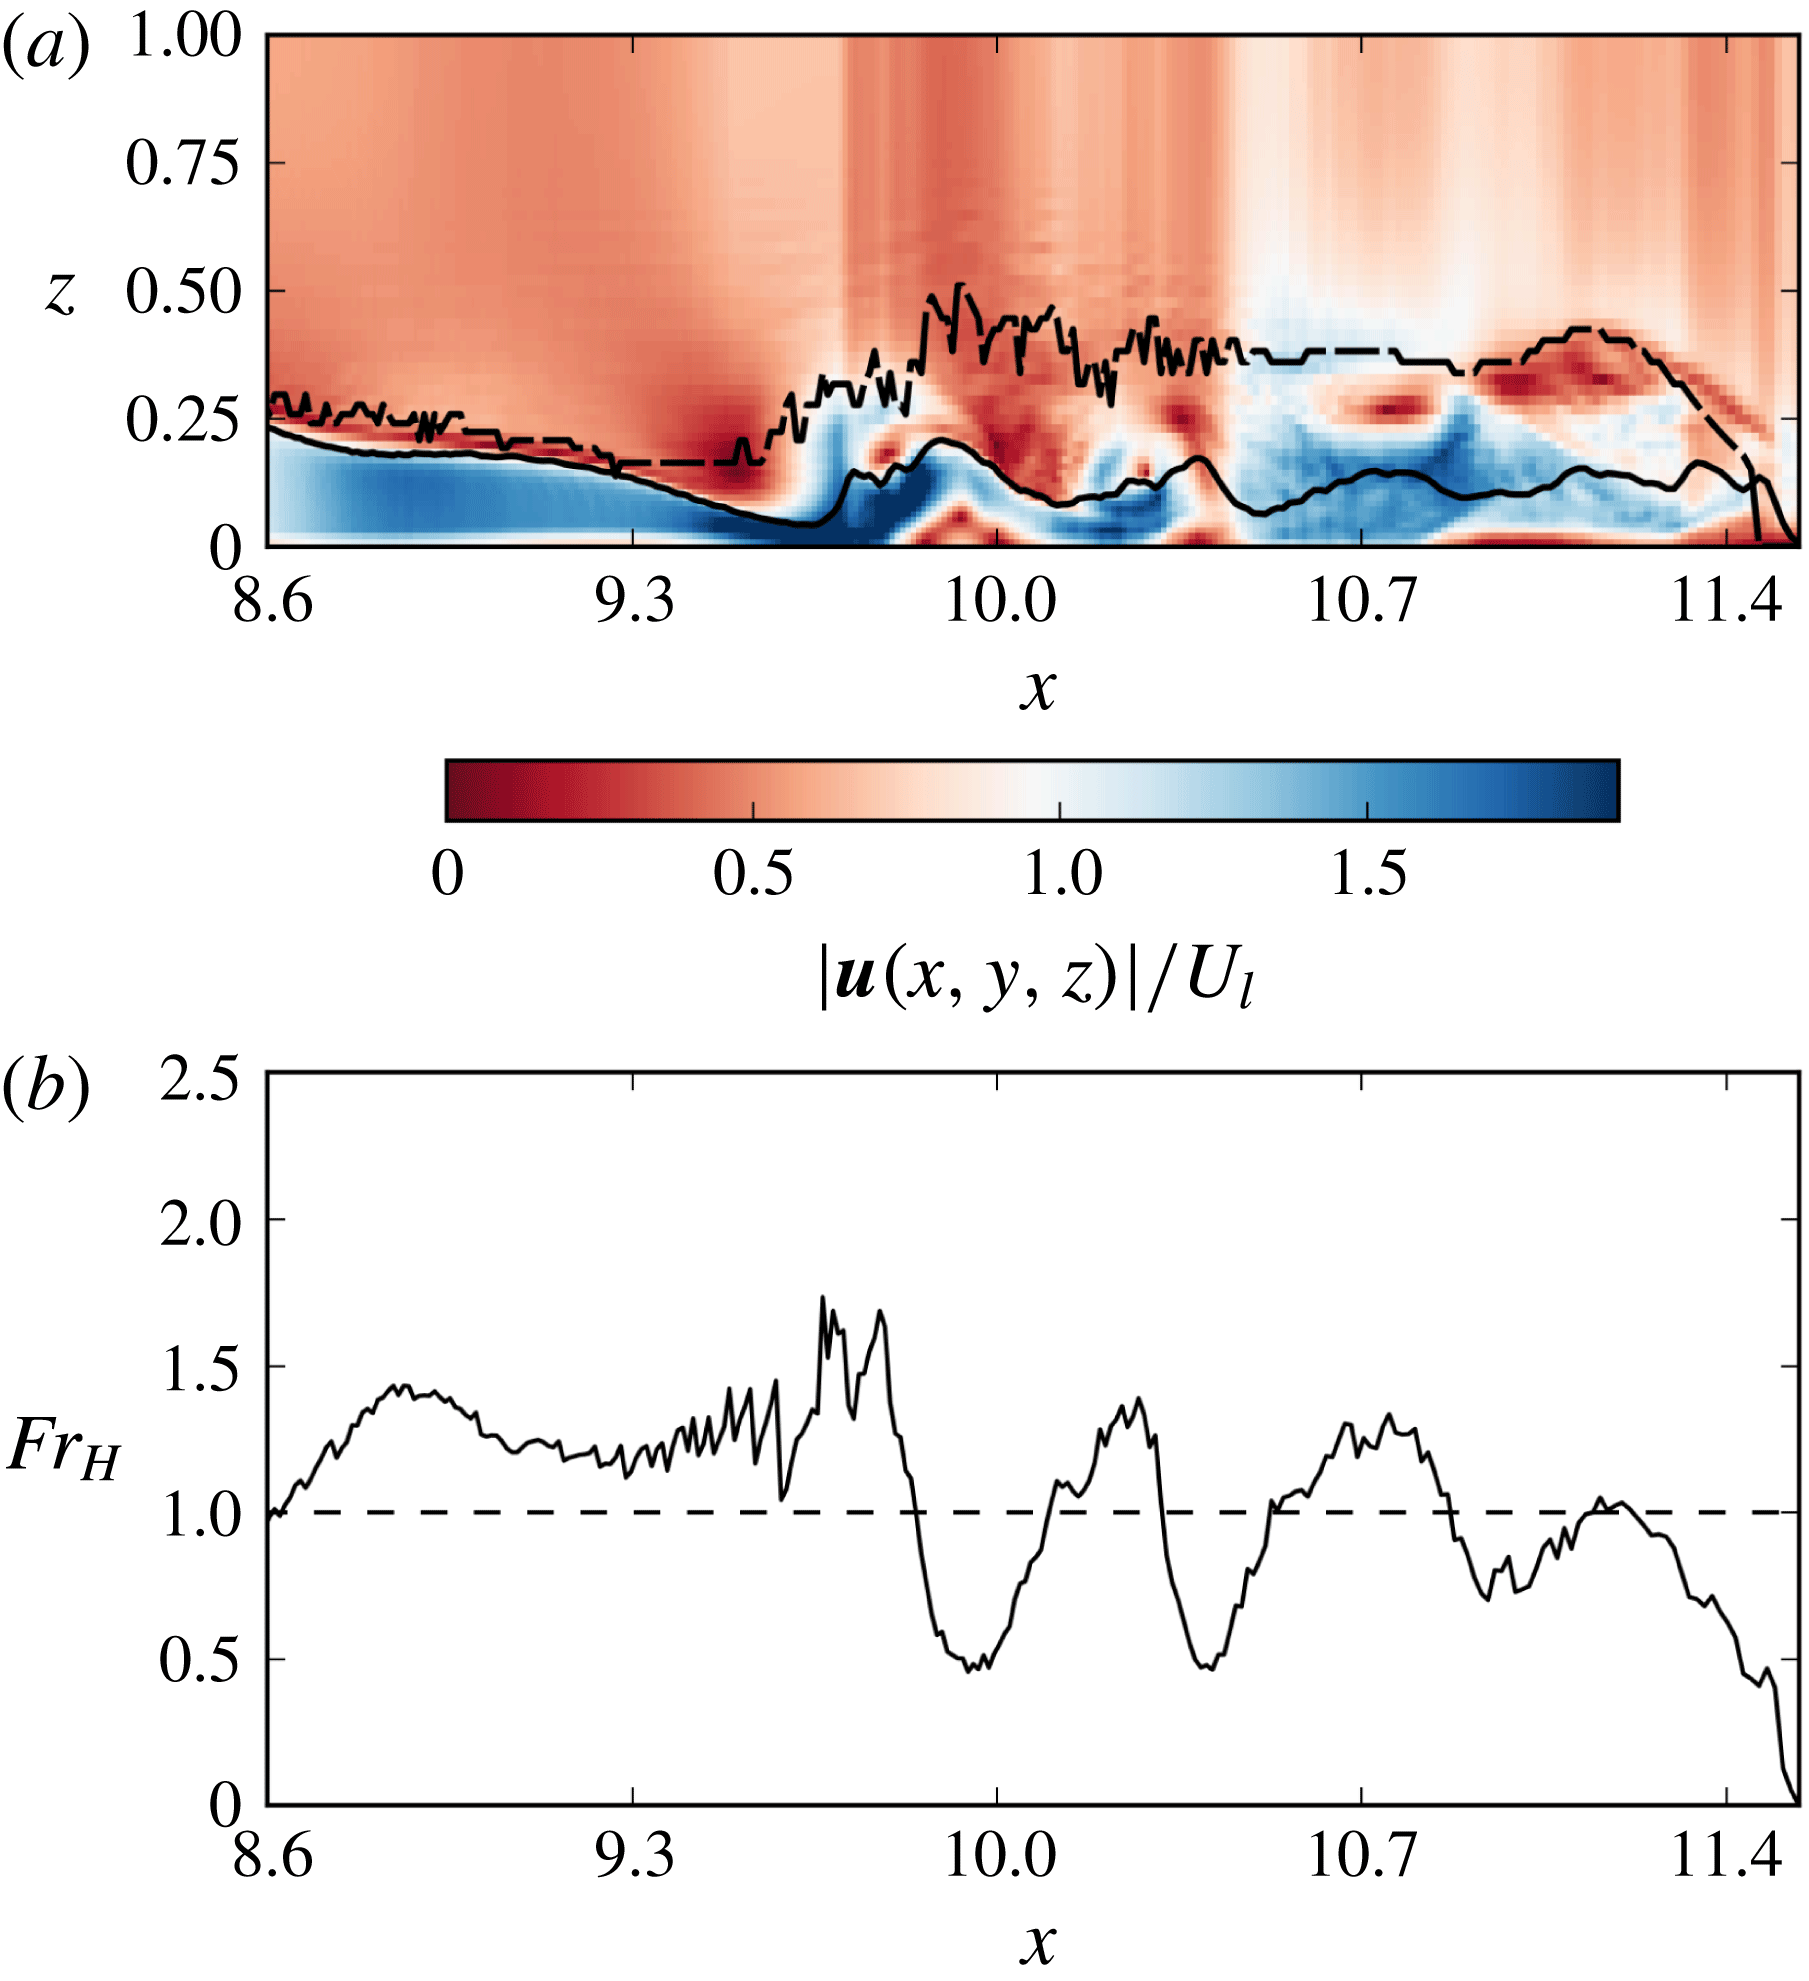
In the case of very high Grashof number, case S11, at
 $t=8.7$
, the position of the front is approximately at
$t=8.7$
, the position of the front is approximately at
 $x_{f}=11.4$
. Three internal ring structures are clearly visible in the
$x_{f}=11.4$
. Three internal ring structures are clearly visible in the
 $\unicode[STIX]{x1D70C}$
field on the horizontal plane at
$\unicode[STIX]{x1D70C}$
field on the horizontal plane at
 $z=0.1$
(shown in figure 11). The three ring structures visible in the horizontal plane section of the density field are related to the axisymmetric bulges in the 3-D view of the surface
$z=0.1$
(shown in figure 11). The three ring structures visible in the horizontal plane section of the density field are related to the axisymmetric bulges in the 3-D view of the surface
 $\unicode[STIX]{x1D70C}=3\,\%$
shown in figure 13. In this range of
$\unicode[STIX]{x1D70C}=3\,\%$
shown in figure 13. In this range of
 $Gr$
the perturbation in the azimuthal direction of the axial symmetry of the vortex rings as they propagate outward is evident, together with the production of small-scale vortical structures radially advected. The map of
$Gr$
the perturbation in the azimuthal direction of the axial symmetry of the vortex rings as they propagate outward is evident, together with the production of small-scale vortical structures radially advected. The map of
 $|\boldsymbol{u}|/U_{s}$
on the mid-plane (
$|\boldsymbol{u}|/U_{s}$
on the mid-plane (
 $x,y=y_{0},z$
) shown in figure 14 highlights a series of three acceleration phases from high velocity,
$x,y=y_{0},z$
) shown in figure 14 highlights a series of three acceleration phases from high velocity,
 $Fr_{H}>1\rightarrow$
low velocity,
$Fr_{H}>1\rightarrow$
low velocity,
 $Fr_{H}<1\rightarrow$
high velocity,
$Fr_{H}<1\rightarrow$
high velocity,
 $Fr_{H}>1$
. The rapid variation in
$Fr_{H}>1$
. The rapid variation in
 $Fr_{H}$
(decreases from close to
$Fr_{H}$
(decreases from close to
 $Fr_{H}=1.6$
at
$Fr_{H}=1.6$
at
 $x=9.6$
to a value of
$x=9.6$
to a value of
 $Fr_{H}\sim 0.5$
at
$Fr_{H}\sim 0.5$
at
 $x=10.0$
in the considered case) is associated with an increase in the depth
$x=10.0$
in the considered case) is associated with an increase in the depth
 $h_{l}$
of the current, marking the presence of a circular hydraulic jump. Similar behaviour is visible at
$h_{l}$
of the current, marking the presence of a circular hydraulic jump. Similar behaviour is visible at
 $x=10.4$
and
$x=10.4$
and
 $x=11.0$
. Corresponding to the high radial velocity regions before the jumps, at heights greater than the depth
$x=11.0$
. Corresponding to the high radial velocity regions before the jumps, at heights greater than the depth
 $h_{l}$
, Kelvin–Helmholtz billows are responsible for the entrainment under the bulges visible in the profile of the
$h_{l}$
, Kelvin–Helmholtz billows are responsible for the entrainment under the bulges visible in the profile of the
 $h_{t}$
line in figure 14 and in the density isosurface shown in figure 11. Figure 15 shows (in shades of grey) the density contour at level
$h_{t}$
line in figure 14 and in the density isosurface shown in figure 11. Figure 15 shows (in shades of grey) the density contour at level
 $\unicode[STIX]{x1D713}=3\,\%$
and (in colour) the velocity vectors on the meridian
$\unicode[STIX]{x1D713}=3\,\%$
and (in colour) the velocity vectors on the meridian
 $(x,y)$
plane at
$(x,y)$
plane at
 $y_{0}$
,
$y_{0}$
,
 $t=12$
. The combined analysis of velocity field and density contour indicates the presence of rings associated with rapid variations in the radial fluid velocity field along
$t=12$
. The combined analysis of velocity field and density contour indicates the presence of rings associated with rapid variations in the radial fluid velocity field along
 $x$
. The velocities are higher on the ascending side of the rings, similar to what is observed at the compressive part of the flow in the development of a shock wave in a volume of gas (Whitham Reference Whitham1999). Here, the velocity of the fluid is considerably higher than the phase velocity of the ring. Kelvin–Helmholtz billows, situated between the core of the current and the ambient fluid, hang above the position of the local maxima of velocity. There are two clearly defined rings in the region
$x$
. The velocities are higher on the ascending side of the rings, similar to what is observed at the compressive part of the flow in the development of a shock wave in a volume of gas (Whitham Reference Whitham1999). Here, the velocity of the fluid is considerably higher than the phase velocity of the ring. Kelvin–Helmholtz billows, situated between the core of the current and the ambient fluid, hang above the position of the local maxima of velocity. There are two clearly defined rings in the region
 $8.9<x_{f}<10.3$
and a weaker third one that is close to
$8.9<x_{f}<10.3$
and a weaker third one that is close to
 $x_{f}=11.4$
. Beyond this position, the velocity is mostly radial and uniform up to the external front. As observed for
$x_{f}=11.4$
. Beyond this position, the velocity is mostly radial and uniform up to the external front. As observed for
 $t=8.7$
, the bulges visible in the
$t=8.7$
, the bulges visible in the
 $\unicode[STIX]{x1D713}=3\,\%$
surface correspond to zones of high radial velocity, and again, Kelvin–Helmholtz billows at the interface between current and ambient fluid are likely producing mixing.
$\unicode[STIX]{x1D713}=3\,\%$
surface correspond to zones of high radial velocity, and again, Kelvin–Helmholtz billows at the interface between current and ambient fluid are likely producing mixing.
Case S11: velocity field on the mid-plane
 $(x,y)$
,
$(x,y)$
,
 $Gr=8.1\times 10^{8}$
,
$Gr=8.1\times 10^{8}$
,
 $\unicode[STIX]{x1D716}=0.03$
,
$\unicode[STIX]{x1D716}=0.03$
,
 $t=12$
.
$t=12$
.
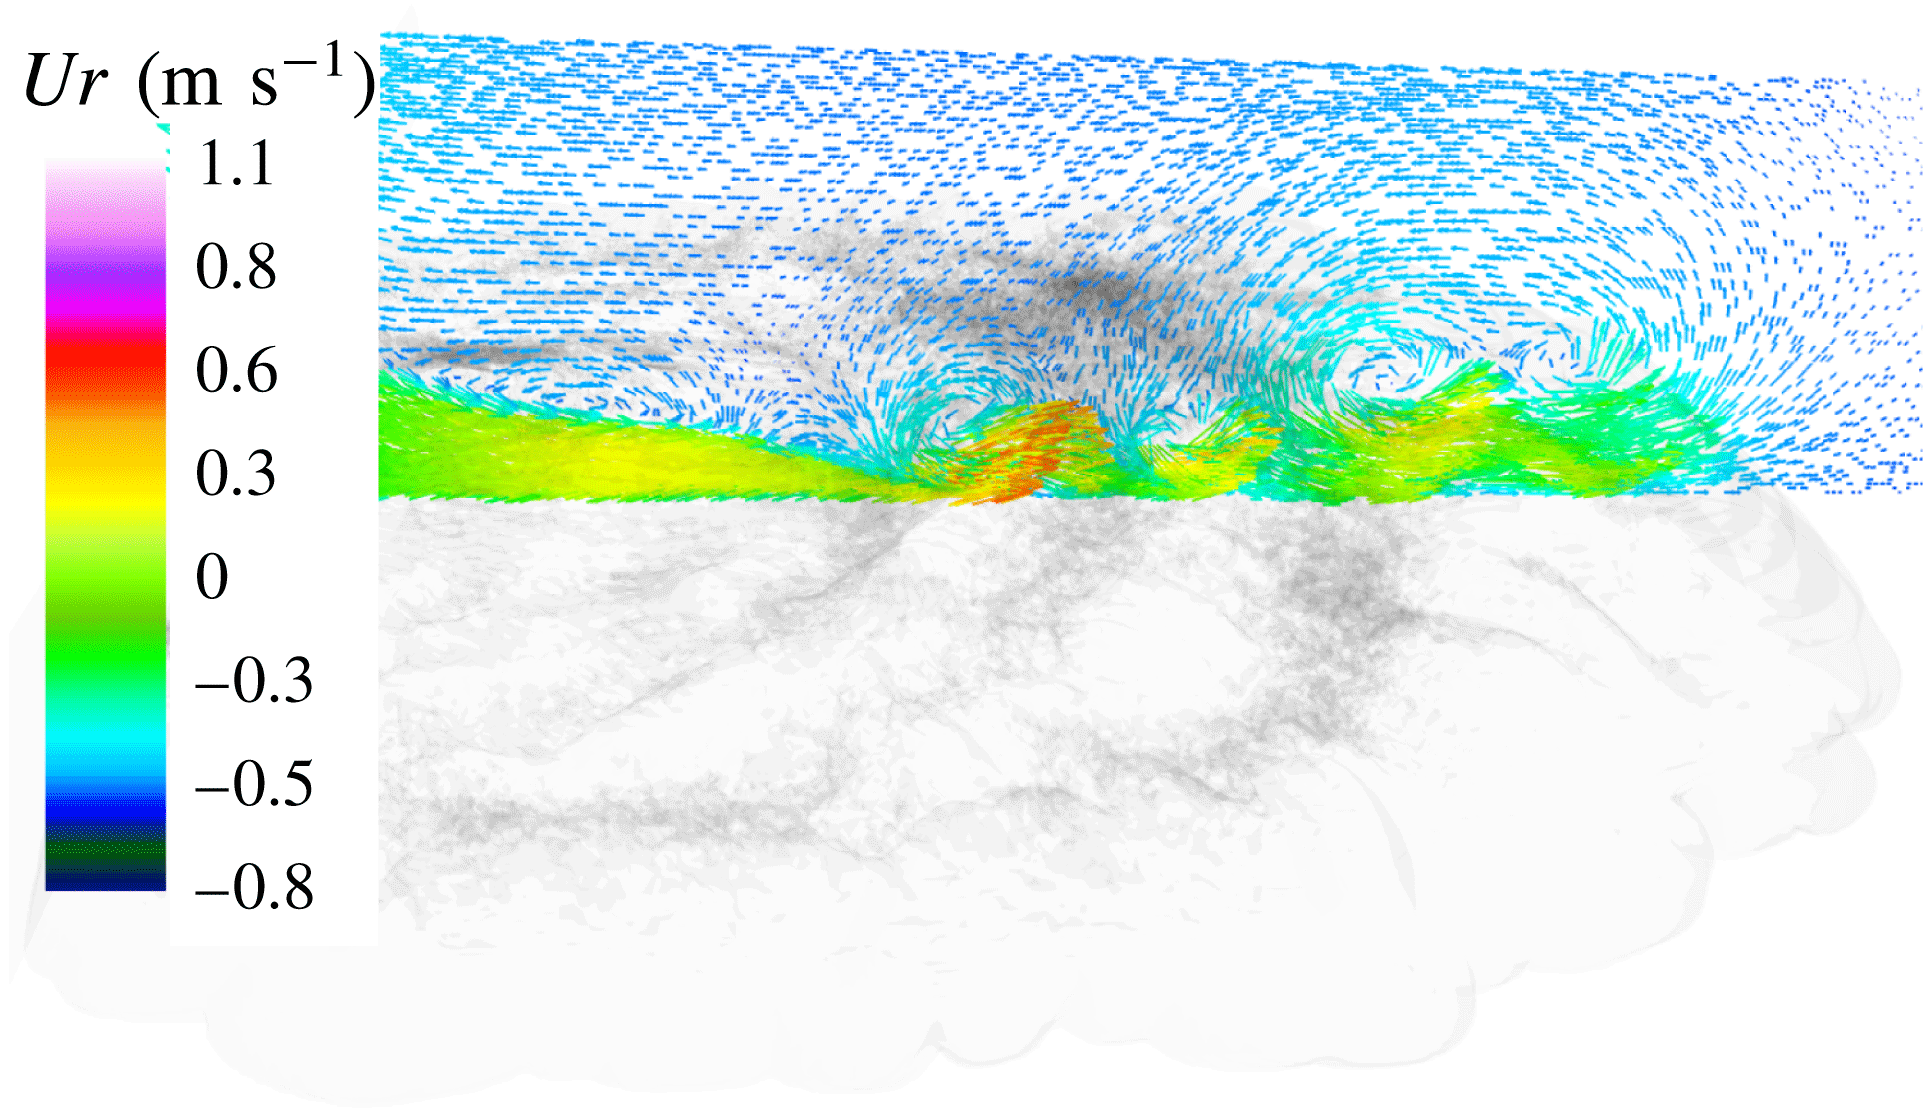
Just before the end of simulation S11, at
 $t=16$
, the planform occupies almost the entire surface of the tank (figure 16). As expected, the depth of the current
$t=16$
, the planform occupies almost the entire surface of the tank (figure 16). As expected, the depth of the current
 $h_{l}$
is much shallower than in the initial phase, there is only one circular hydraulic jump close to the symmetry axis and most of the flow has
$h_{l}$
is much shallower than in the initial phase, there is only one circular hydraulic jump close to the symmetry axis and most of the flow has
 $Fr_{H}<1$
. Most of the Kelvin–Helmholtz billows have faded out, with the exception of the very active instability close to the jump, and the current propagates as a uniformly mixed flow of depth
$Fr_{H}<1$
. Most of the Kelvin–Helmholtz billows have faded out, with the exception of the very active instability close to the jump, and the current propagates as a uniformly mixed flow of depth
 $h_{l}$
.
$h_{l}$
.
(a) Non-dimensional velocity
 $|\boldsymbol{u}|/U_{l}$
on the mid-plane
$|\boldsymbol{u}|/U_{l}$
on the mid-plane
 $y=y_{0}$
; the thick black line indicates the depth
$y=y_{0}$
; the thick black line indicates the depth
 $h_{l}=\sqrt{\overline{g^{\prime }h}}/g_{0}^{\prime }$
and the dashed line marks the interface
$h_{l}=\sqrt{\overline{g^{\prime }h}}/g_{0}^{\prime }$
and the dashed line marks the interface
 $\unicode[STIX]{x1D70C}=3\,\%$
. (b) Froude number
$\unicode[STIX]{x1D70C}=3\,\%$
. (b) Froude number
 $Fr_{H}$
versus
$Fr_{H}$
versus
 $x$
; case S11,
$x$
; case S11,
 $t=16$
.
$t=16$
.
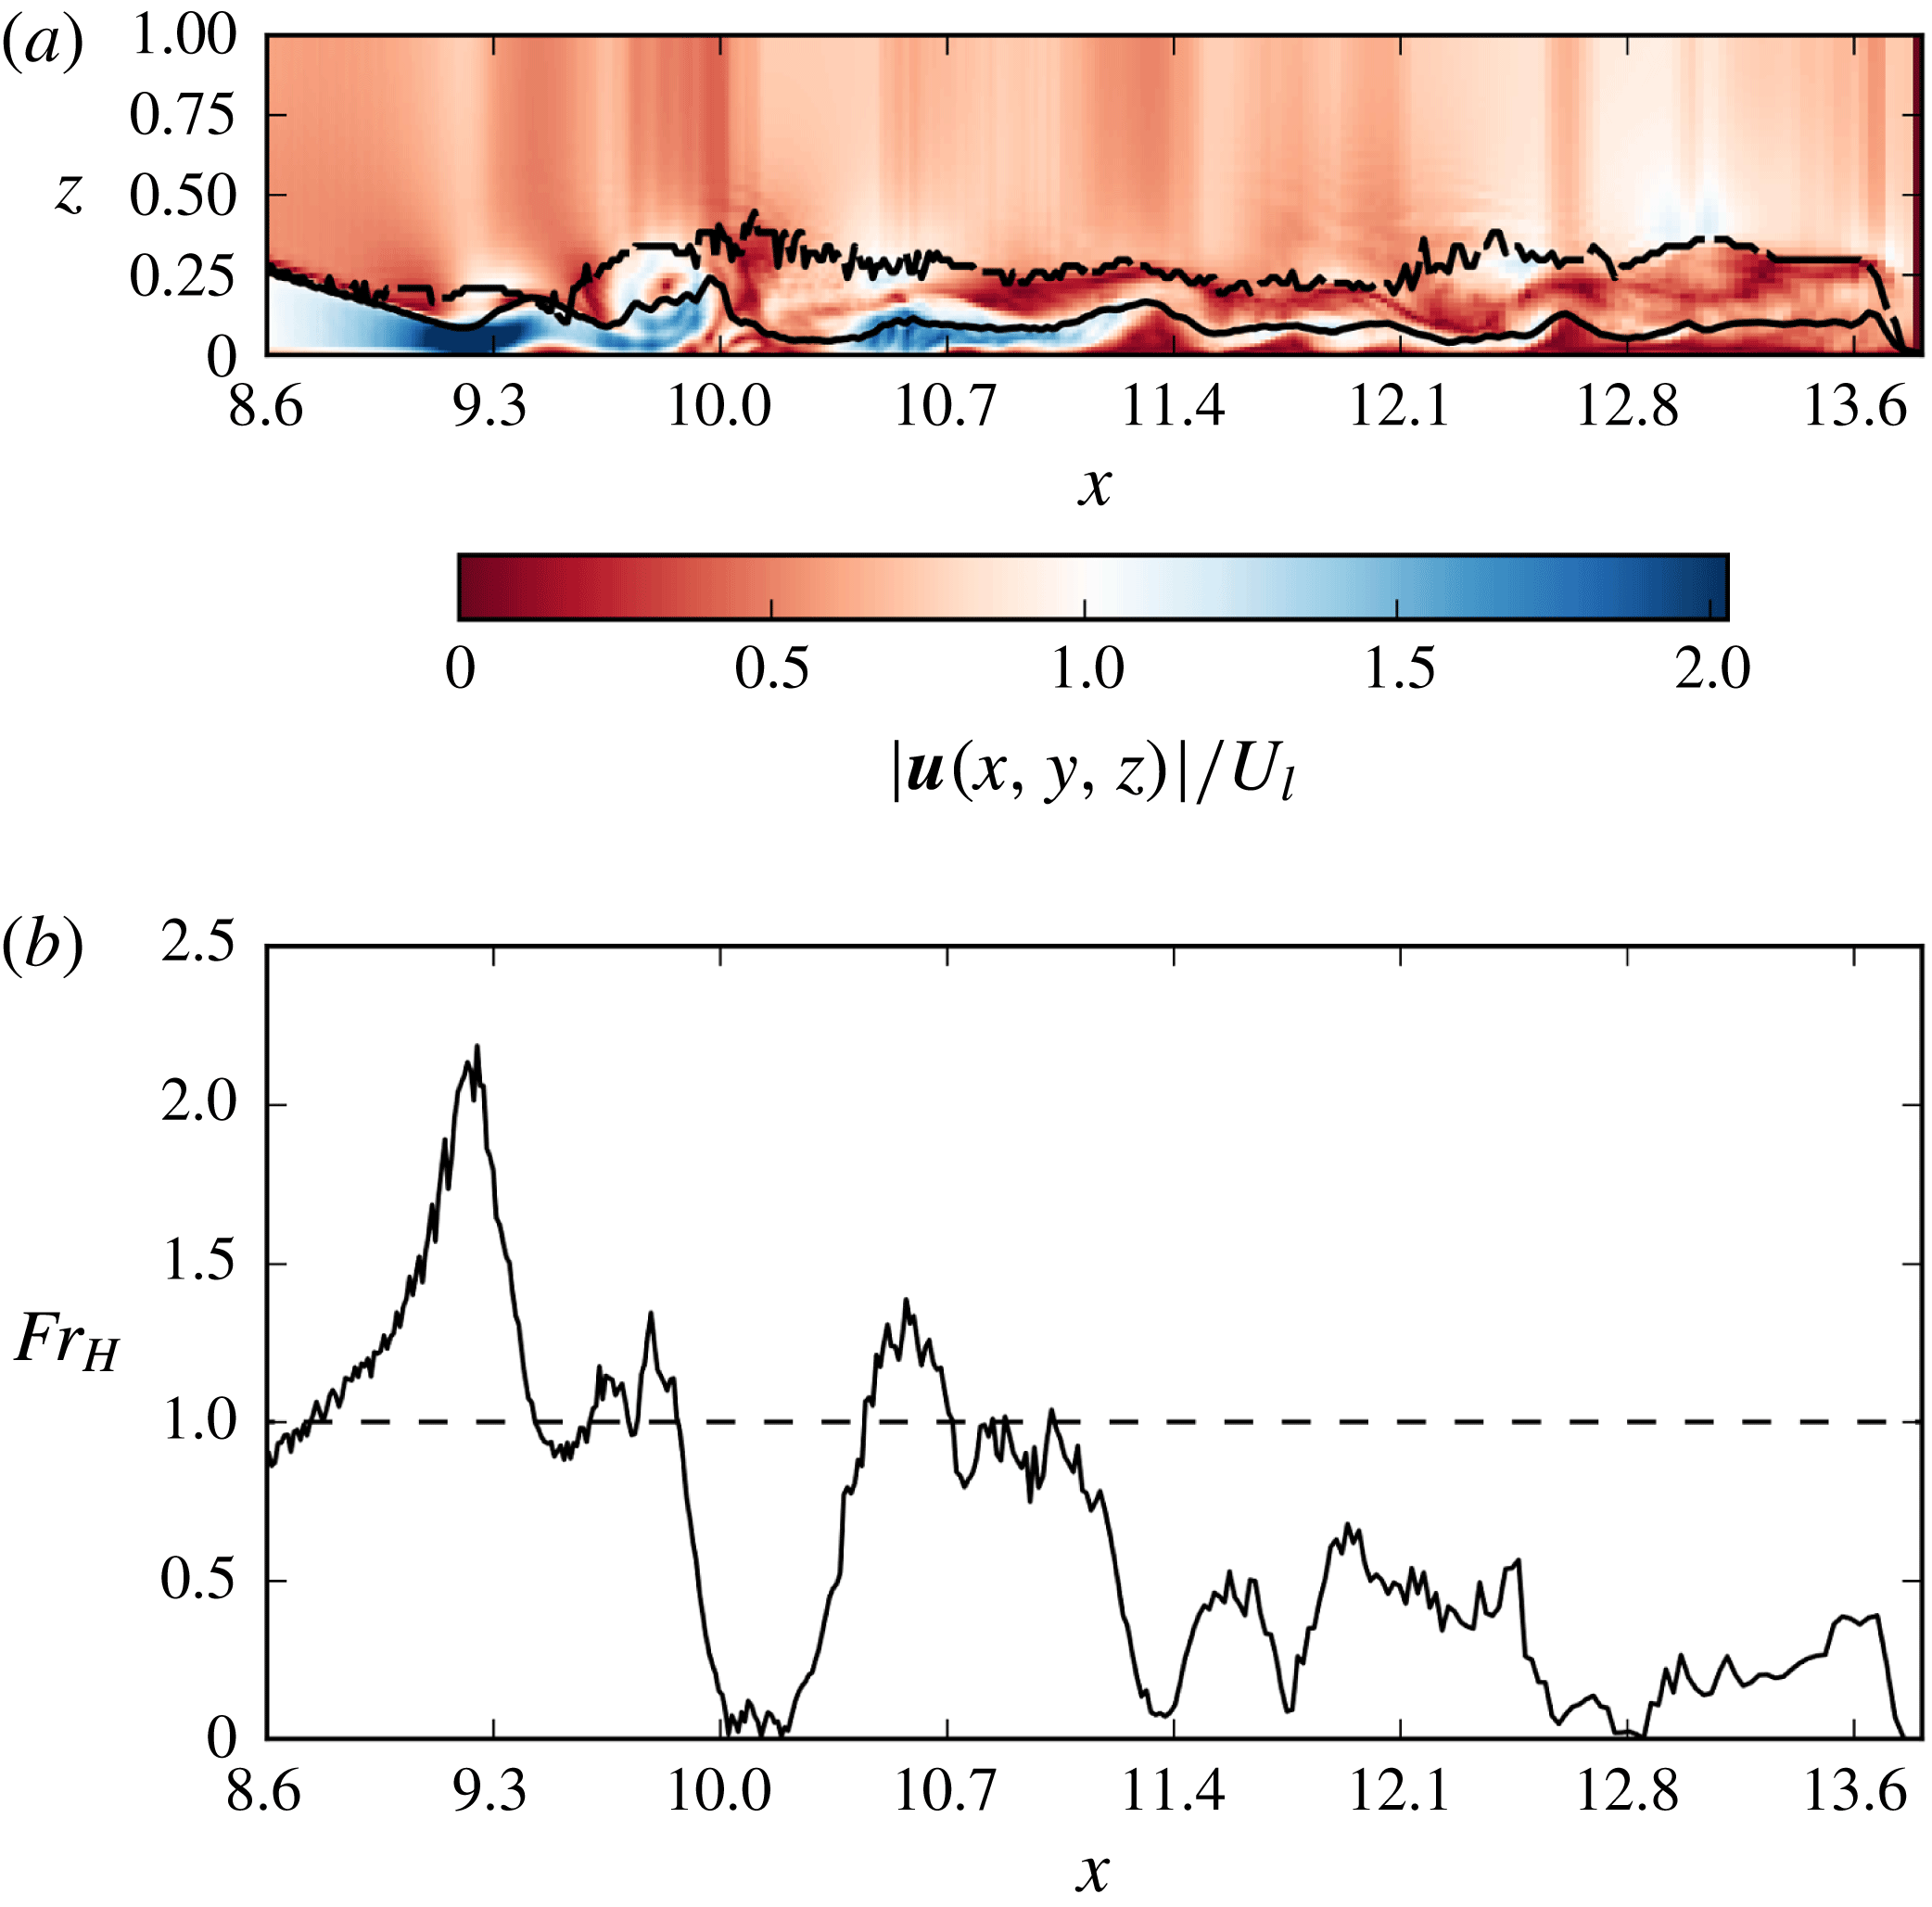
The HD map in figure 17 clearly shows a succession of rings in the region
 $9<x<12$
. A total of 11 rings are clearly identifiable.
$9<x<12$
. A total of 11 rings are clearly identifiable.
The recorded image frames of the experiment (such as the one shown in figure 12) can also be used to produce HD maps. Note that the experimental data are collected using a camera recording the top of the surface, whereas the salinity field used in the simulations is extracted at a carefully chosen level to obtain the best possible resolution of the structures. Moreover, note that the visibility of the rings in the experimental conditions depends on several external factors, such as the concentration of the dye, the depth of the current and the presence of disturbances on the free surface. In the experiment, rings are clearly detectable as alternating bands of different shades of grey due to the mixing associated with the hydraulic jumps. It is possible to verify from the HD (not shown) the presence of several rings. It appears that the rings have some periodicity; however, it is unclear whether the width of the rings is variable or whether some of them are too close to each other to be distinguished. The first small ring starts at approximately
 $t=3$
, and the rings are generated throughout the entire duration of the experiment in a variable area near the origin. Due to the presence of many light reflections from the dark surface of the current, it is unclear whether, after
$t=3$
, and the rings are generated throughout the entire duration of the experiment in a variable area near the origin. Due to the presence of many light reflections from the dark surface of the current, it is unclear whether, after
 $t=9$
, the rings remain confined in a circle or whether they are able to propagate forward towards the external front in the final part of the spreading.
$t=9$
, the rings remain confined in a circle or whether they are able to propagate forward towards the external front in the final part of the spreading.
Most of the features illustrated in the simulated case S11 are also present in cases S6–S10. They differ in that the bulges visible in the
 $\unicode[STIX]{x1D713}=3\,\%$
surface are less numerous but increasing in size at lower
$\unicode[STIX]{x1D713}=3\,\%$
surface are less numerous but increasing in size at lower
 $Gr$
. As an example, the number of rings observed for case S7 (
$Gr$
. As an example, the number of rings observed for case S7 (
 $\unicode[STIX]{x1D716}=0.010$
) is close to
$\unicode[STIX]{x1D716}=0.010$
) is close to
 $1/3$
of the rings present in S11 (
$1/3$
of the rings present in S11 (
 $\unicode[STIX]{x1D716}=0.030$
) in the same time period.
$\unicode[STIX]{x1D716}=0.030$
) in the same time period.
Hövmoller diagram case S11, simulation
 $Gr=8.1\times 10^{8}$
.
$Gr=8.1\times 10^{8}$
.
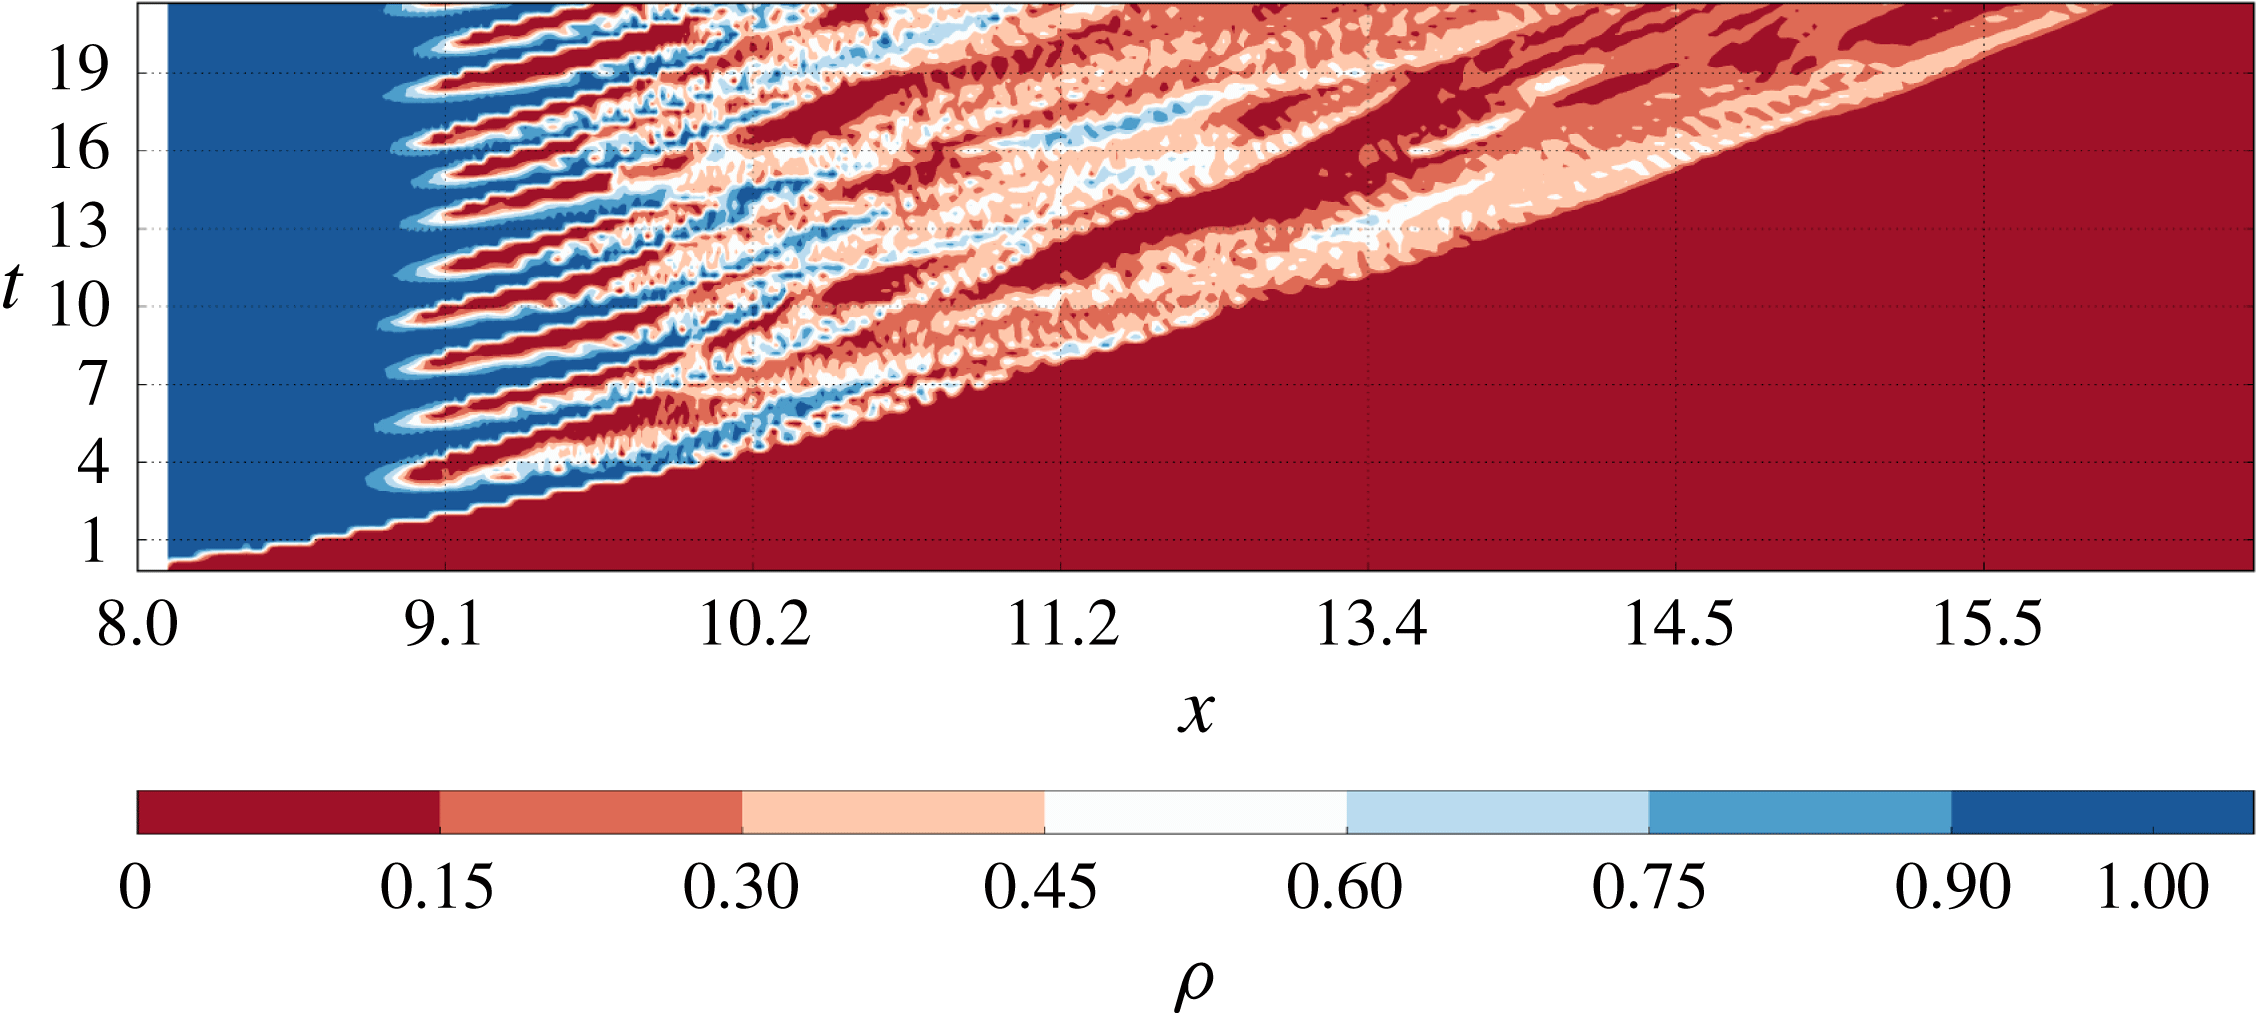
Looking carefully at all the Hövmoller diagrams it seems that the position of the first ring tends to be the closest to the axis of symmetry, the position of the successive rings are gradually shifted outward. The time of formation of the first ring depends on
 $\unicode[STIX]{x1D716}$
and is subsequent to the time
$\unicode[STIX]{x1D716}$
and is subsequent to the time
 $t_{0}$
of formation of the axisymmetric current. The radial position of the first ring is clearly related to the time taken by the fastest gravity wave to travel the distance
$t_{0}$
of formation of the axisymmetric current. The radial position of the first ring is clearly related to the time taken by the fastest gravity wave to travel the distance
 $r_{1r}$
, from the axis of symmetry to the position of the hydraulic jump. As shown in figure 18, in all cases the position of the jump approximately corresponds to the time it takes for a gravity wave with velocity
$r_{1r}$
, from the axis of symmetry to the position of the hydraulic jump. As shown in figure 18, in all cases the position of the jump approximately corresponds to the time it takes for a gravity wave with velocity
 $U_{b}=U_{s}/4$
to cover
$U_{b}=U_{s}/4$
to cover
 $r_{1r}$
.
$r_{1r}$
.
Square of distance of the first ring from the symmetry axis (
 $r_{1r}$
) with respect to the velocity times the travel time (
$r_{1r}$
) with respect to the velocity times the travel time (
 $t_{1r}$
) of the disturbance carried by the fastest gravity wave.
$t_{1r}$
) of the disturbance carried by the fastest gravity wave.
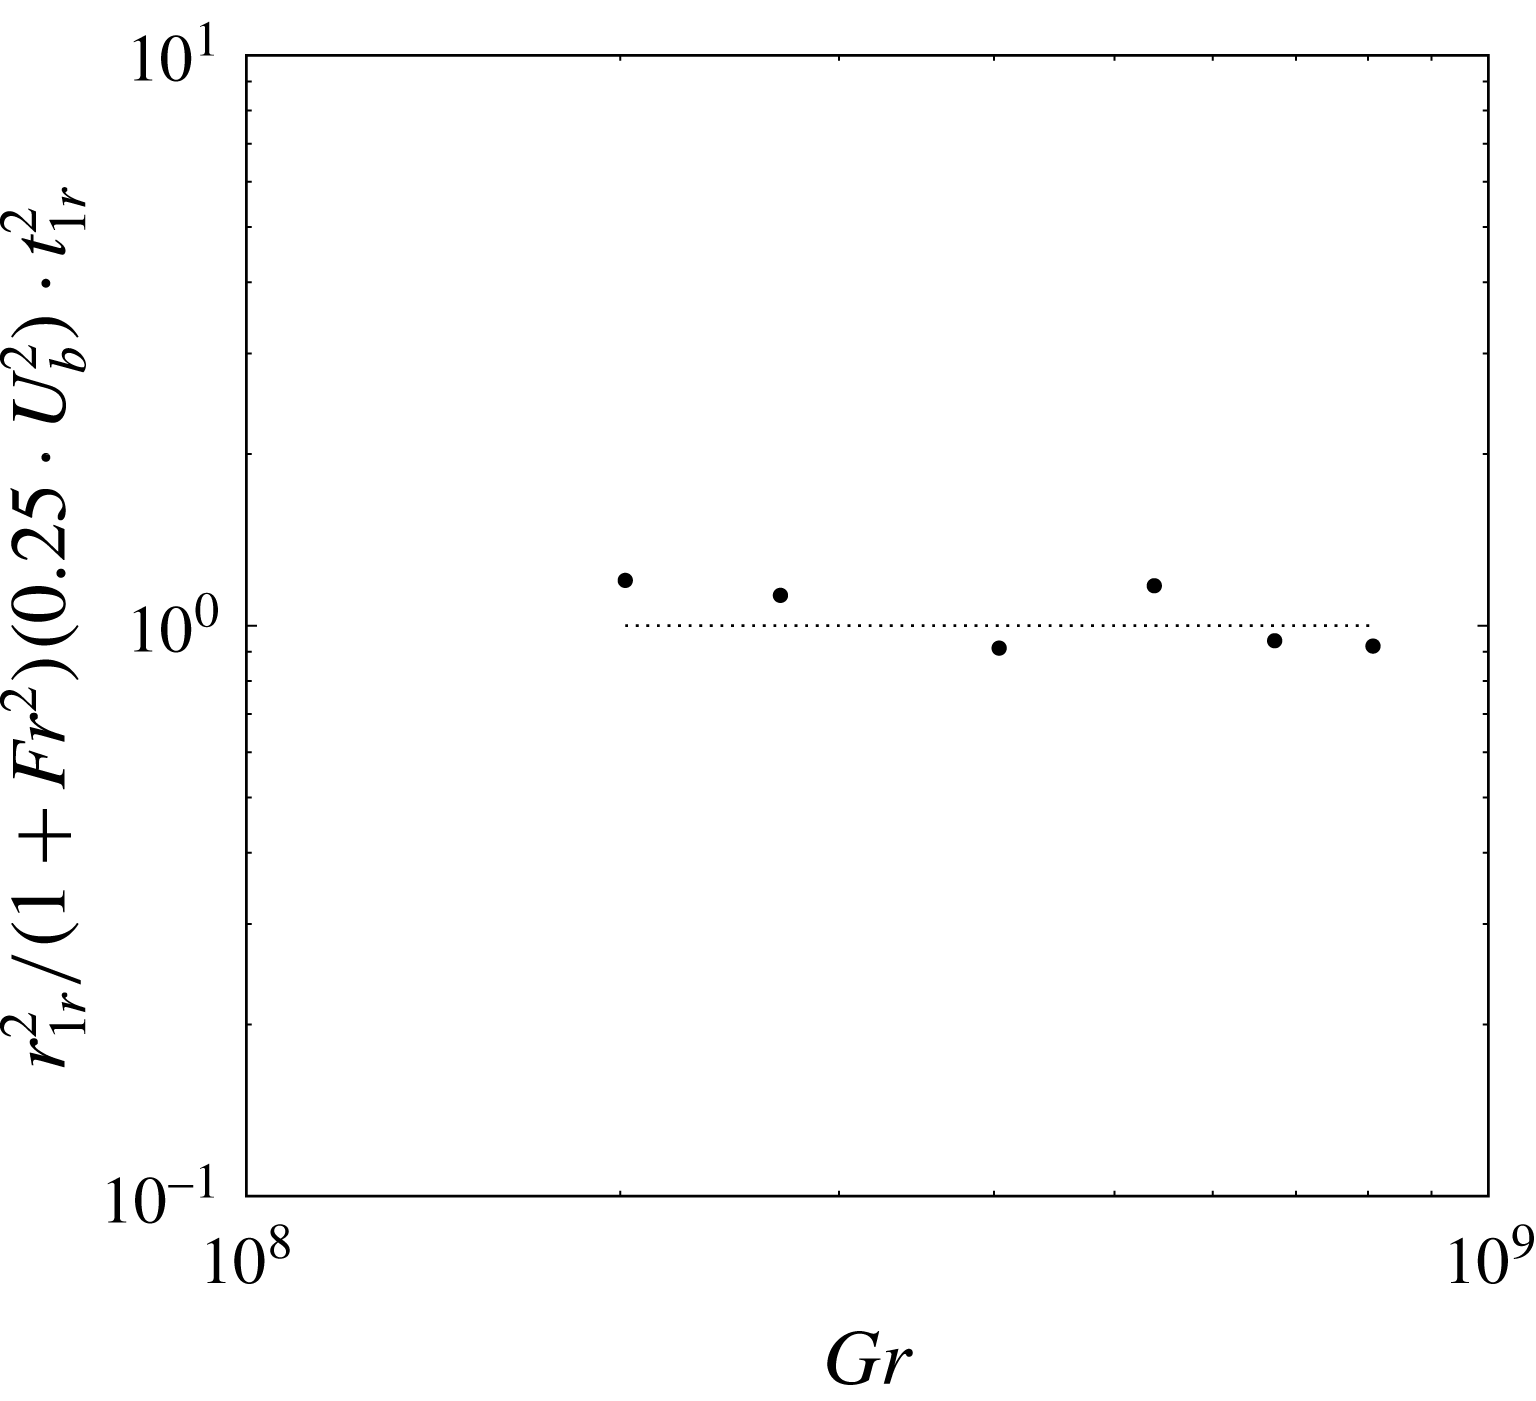
Since
 $U_{b}$
is evaluated with respect to the velocity of the fluid, the velocity with respect to an observer at rest is
$U_{b}$
is evaluated with respect to the velocity of the fluid, the velocity with respect to an observer at rest is
 $(1+Fr_{H}^{2})U_{b}^{2}$
. The value of
$(1+Fr_{H}^{2})U_{b}^{2}$
. The value of
 $Fr_{H}^{2}$
is obtained from
$Fr_{H}^{2}$
is obtained from
 $Fr_{H}(x)$
near the jump position at a time close to the jump formation and does not depend on
$Fr_{H}(x)$
near the jump position at a time close to the jump formation and does not depend on
 $U_{s}$
since it is evaluated as in Shin et al. (Reference Shin, Dalziel and Linden2004). The time interval
$U_{s}$
since it is evaluated as in Shin et al. (Reference Shin, Dalziel and Linden2004). The time interval
 $t_{1r}$
is the time of formation of the first shock determined from the HD with respect to the starting time of the perturbation, visible from the
$t_{1r}$
is the time of formation of the first shock determined from the HD with respect to the starting time of the perturbation, visible from the
 $Fr_{H}(x)$
after the propagation of the external front.
$Fr_{H}(x)$
after the propagation of the external front.
 $U_{b}$
is slower than
$U_{b}$
is slower than
 $U_{s}$
because
$U_{s}$
because
 $U_{s}^{2}$
is defined in terms of
$U_{s}^{2}$
is defined in terms of
 $g^{\prime }H$
, which is clearly an overestimate of the maximum velocity of the gravity waves, since their depth is always less than
$g^{\prime }H$
, which is clearly an overestimate of the maximum velocity of the gravity waves, since their depth is always less than
 $H/2$
. In fact, the effective velocity
$H/2$
. In fact, the effective velocity
 $U_{b}=\sqrt{g^{\prime }H/4}=\sqrt{g^{\prime }h_{e}}$
can be related to a current having effective depth
$U_{b}=\sqrt{g^{\prime }H/4}=\sqrt{g^{\prime }h_{e}}$
can be related to a current having effective depth
 $h_{e}=H/4$
, which is consistent with the value of
$h_{e}=H/4$
, which is consistent with the value of
 $h_{l}$
of the current at the time and position of the jump. If the time of formation of the first ring is scaled using
$h_{l}$
of the current at the time and position of the jump. If the time of formation of the first ring is scaled using
 $T_{s}^{\ast }=H/U_{b}$
, then the non-dimensional relation
$T_{s}^{\ast }=H/U_{b}$
, then the non-dimensional relation
 $R_{r}^{2}=(1+Fr^{2})\times t_{r}^{2}$
holds, as expected.
$R_{r}^{2}=(1+Fr^{2})\times t_{r}^{2}$
holds, as expected.
The HD of S13 (extended domain case) reveals some more features regarding the propagation of the rings, which appear only at large times (figure 19). The most evident aspect is that only few rings (approximately 1 out of 10) are able to exit from the confining area, and only two of them actually reach the external front. This spatial pattern can also be clearly identified by examining the horizontal section of the density field
 $\unicode[STIX]{x1D70C}(x,y,z_{c})$
at the final stage of spreading for
$\unicode[STIX]{x1D70C}(x,y,z_{c})$
at the final stage of spreading for
 $t=65$
(figure 20). The first ring reaching the front is generated at approximately
$t=65$
(figure 20). The first ring reaching the front is generated at approximately
 $t=17$
and meets the front at approximately
$t=17$
and meets the front at approximately
 $t=41$
, indicating that the average phase speed of the ring is close to twice the average velocity of the frontline. The other feature is that rings are produced continuously in the entire 50 s of simulation, i.e. up to
$t=41$
, indicating that the average phase speed of the ring is close to twice the average velocity of the frontline. The other feature is that rings are produced continuously in the entire 50 s of simulation, i.e. up to
 $t=60$
.
$t=60$
.
Hövmoller diagram case S13, simulation
 $Gr=5.4\times 10^{8}$
.
$Gr=5.4\times 10^{8}$
.
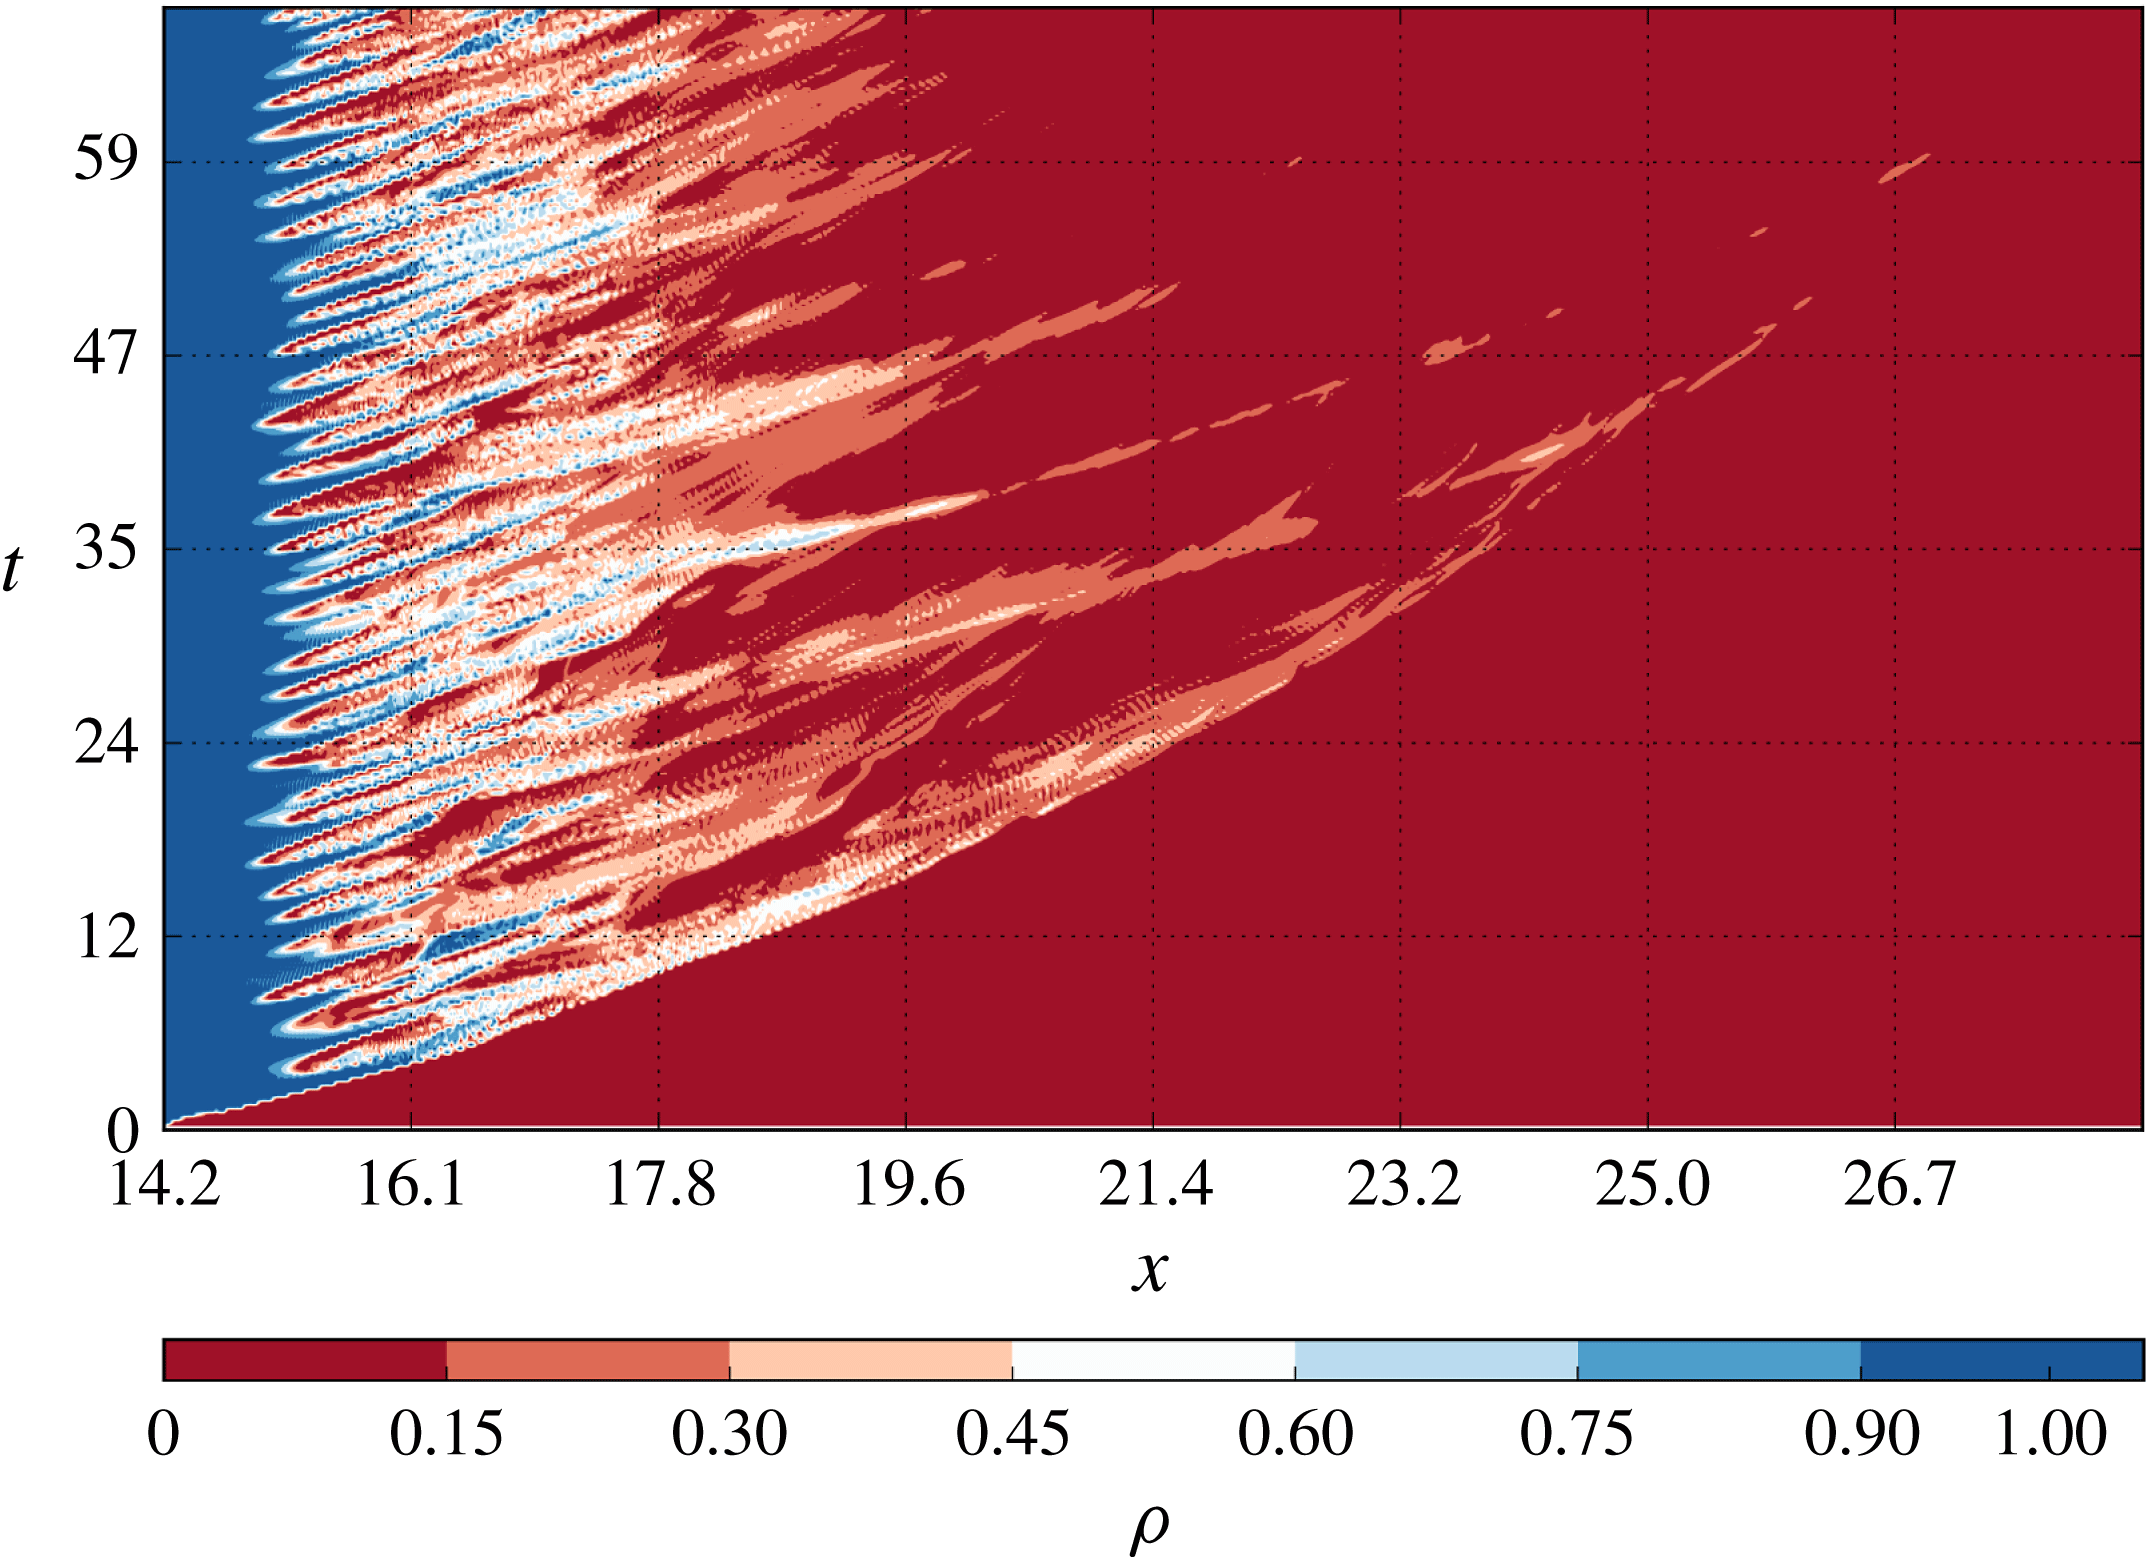
Case S13:
 $\unicode[STIX]{x1D70C}(x,y,z_{c})$
,
$\unicode[STIX]{x1D70C}(x,y,z_{c})$
,
 $t=64$
.
$t=64$
.
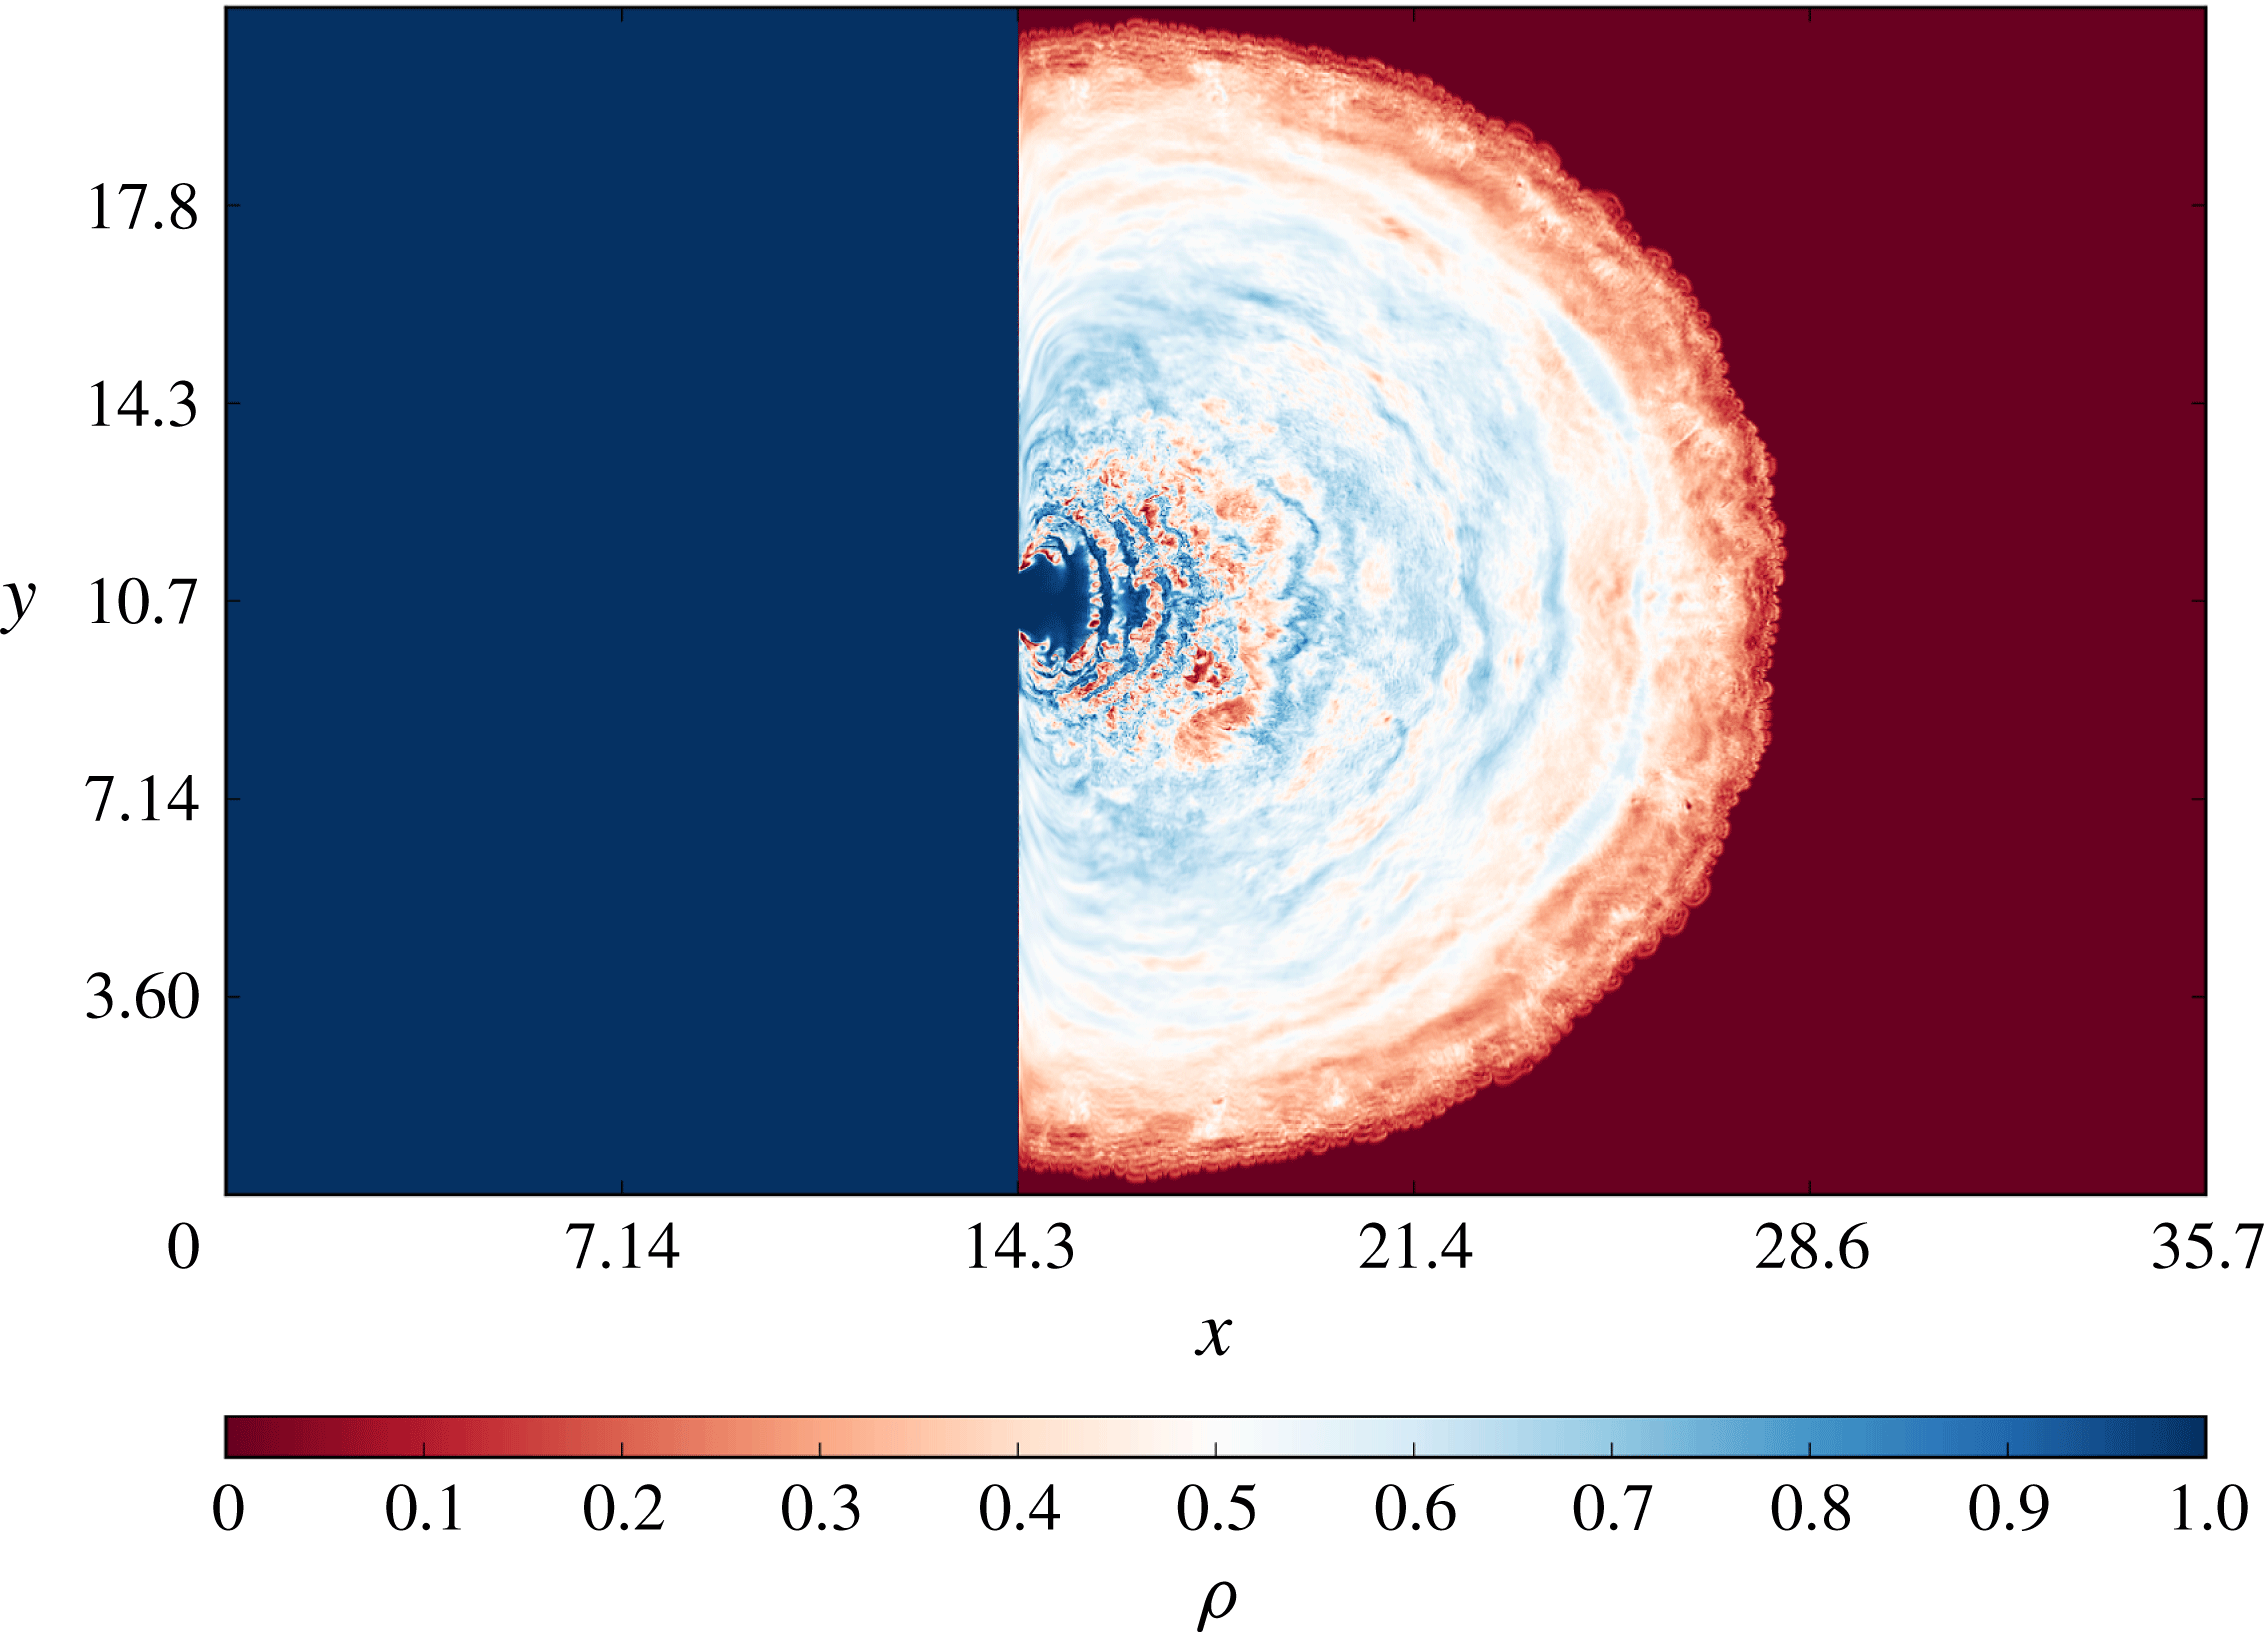
Dimensionless frequency of ring generation
 $\unicode[STIX]{x1D702}$
versus
$\unicode[STIX]{x1D702}$
versus
 $Gr$
; dots represent S6–S11; cross is S13; dashed line indicates
$Gr$
; dots represent S6–S11; cross is S13; dashed line indicates
 $\bar{\unicode[STIX]{x1D702}}$
.
$\bar{\unicode[STIX]{x1D702}}$
.
The frequency of ring generation, defined as the number of rings generated in the total time of simulation divided by the total time,
 $\unicode[STIX]{x1D712}$
, is related to the inflow
$\unicode[STIX]{x1D712}$
, is related to the inflow
 $Q$
. The linear least squares fit indicates a possible functional relationship
$Q$
. The linear least squares fit indicates a possible functional relationship
 $\unicode[STIX]{x1D712}=\unicode[STIX]{x1D6FD}Q^{\unicode[STIX]{x1D6FE}}$
with
$\unicode[STIX]{x1D712}=\unicode[STIX]{x1D6FD}Q^{\unicode[STIX]{x1D6FE}}$
with
 $\unicode[STIX]{x1D6FD}=e^{\unicode[STIX]{x1D6FC}}~\text{m}^{-3}$
. The regression coefficients are
$\unicode[STIX]{x1D6FD}=e^{\unicode[STIX]{x1D6FC}}~\text{m}^{-3}$
. The regression coefficients are
 $\unicode[STIX]{x1D6FC}=(6.577\pm 1.024)$
and
$\unicode[STIX]{x1D6FC}=(6.577\pm 1.024)$
and
 $\unicode[STIX]{x1D6FE}=(0.9635\pm 0.139)$
, and the squared Pearson correlation coefficient is
$\unicode[STIX]{x1D6FE}=(0.9635\pm 0.139)$
, and the squared Pearson correlation coefficient is
 ${\mathcal{R}}^{2}=0.913$
. Unfortunately, the error associated with the determination of the exponent
${\mathcal{R}}^{2}=0.913$
. Unfortunately, the error associated with the determination of the exponent
 $\unicode[STIX]{x1D6FE}$
is large, and the confidence interval at the 95 % level of probability is in the range [0.68–1.24]. The non-dimensional frequency of ring generation
$\unicode[STIX]{x1D6FE}$
is large, and the confidence interval at the 95 % level of probability is in the range [0.68–1.24]. The non-dimensional frequency of ring generation
 $\unicode[STIX]{x1D702}=\unicode[STIX]{x1D712}T_{s}=\unicode[STIX]{x1D712}H/U_{s}$
, shown in figure 21, is nearly constant over the range of
$\unicode[STIX]{x1D702}=\unicode[STIX]{x1D712}T_{s}=\unicode[STIX]{x1D712}H/U_{s}$
, shown in figure 21, is nearly constant over the range of
 $Gr$
considered in the study. The average value is
$Gr$
considered in the study. The average value is
 $$\begin{eqnarray}\bar{\unicode[STIX]{x1D702}}=0.48\pm 0.06,\end{eqnarray}$$
with the error being evaluated as the confidence interval around
 $\bar{\unicode[STIX]{x1D702}}$
at the 95 % level of probability.
$\bar{\unicode[STIX]{x1D702}}$
at the 95 % level of probability.
The estimate of
 $\unicode[STIX]{x1D702}$
for case S13 (indicated by a cross in figure 21) is evaluated on a time period that is five times longer than the duration of the other cases. Some similarity between the results obtained by Maxworthy (Reference Maxworthy1980) for the frequency of generation of ring-like solitary waves produced by collapsing volumes of fluids, propagating in a stratified ambient fluid, and the present results (e.g. see plates 7 and 8 in the original paper) is devisable. In both cases, the number of ring-shaped structures depends on the Grashof number in the same way, but in the former, the solitary waves move in the stratified fluid externally to the generating gravity current, whereas in the latter, the rings are embedded in the current propagating in a homogeneous environment. Moreover, the rings discussed here have the structure of hydrodynamic shocks and are related to a three-dimensional, intrinsically hyperbolic nonlinear problem, whereas the solitary waves described in Maxworthy (Reference Maxworthy1980) are nonlinear dispersive waves moving along the interface between two shallow layers of a stratified fluid.
$\unicode[STIX]{x1D702}$
for case S13 (indicated by a cross in figure 21) is evaluated on a time period that is five times longer than the duration of the other cases. Some similarity between the results obtained by Maxworthy (Reference Maxworthy1980) for the frequency of generation of ring-like solitary waves produced by collapsing volumes of fluids, propagating in a stratified ambient fluid, and the present results (e.g. see plates 7 and 8 in the original paper) is devisable. In both cases, the number of ring-shaped structures depends on the Grashof number in the same way, but in the former, the solitary waves move in the stratified fluid externally to the generating gravity current, whereas in the latter, the rings are embedded in the current propagating in a homogeneous environment. Moreover, the rings discussed here have the structure of hydrodynamic shocks and are related to a three-dimensional, intrinsically hyperbolic nonlinear problem, whereas the solitary waves described in Maxworthy (Reference Maxworthy1980) are nonlinear dispersive waves moving along the interface between two shallow layers of a stratified fluid.
3.2 Spreading regimes for axisymmetric, constant-volume flow gravity currents
3.2.1 Slumping asymptotic solutions
The existence of an additional regime, the ‘slumping phase’, was proposed by Huppert & Simpson (Reference Huppert and Simpson1980). The slumping, which dominates the short times prior to the onset of the inertial–buoyancy equilibrium, has been investigated by several authors, e.g. Ungarish & Zemach (Reference Ungarish and Zemach2005), in the limited context of planar and fixed-volume axisymmetric gravity currents. The presence of a slumping phase in constant-flow-rate, axisymmetric gravity currents has not yet been given proper attention, probably due to the uncertainties already found in the theoretical assessment of the inertial–buoyancy regime. Its presence, however, might justify the inconsistency between the ‘spreading regime’ introduced by Garvine (Reference Garvine1984) and the solution found by Chen (Reference Chen1980) as part of the asymptotic solution of the initial value problem. The geometry of the problem here considered is slightly different from that used in the formulation of the slumping theory. In fact, the box model of Huppert & Simpson (Reference Huppert and Simpson1980) is based on two conditions: the first is that in the slumping regime, the current conserves the volume, i.e. the volume of the current at any time is the same as the cylindrical initial volume of the denser fluid; the second is that the Froude number at the front of the current can be expressed as a monotonic function of the fractional height
 $\unicode[STIX]{x1D719}=h/H$
of the depth of the current
$\unicode[STIX]{x1D719}=h/H$
of the depth of the current
 $h$
divided by the total depth of the fluid
$h$
divided by the total depth of the fluid
 $H$
. The functional relationship is based on the experiments at a constant flow rate of Simpson & Britter (Reference Simpson and Britter1979).
$H$
. The functional relationship is based on the experiments at a constant flow rate of Simpson & Britter (Reference Simpson and Britter1979).
The extension of the original slumping concept to the constant-flow-rate problem can be simply obtained by replacing the condition of fixed volume with a condition in which the volume increases in time at a fixed rate. The result is not as simple as the constant-velocity law found for planar and axisymmetric constant-volume gravity currents. In the present case, it is found that
 $$\begin{eqnarray}r^{4/3}-r_{0}^{4/3}\propto C_{sl}t^{7/6},\end{eqnarray}$$
where
 $$\begin{eqnarray}C_{sl}=\left(\frac{g^{\prime 3}QH^{2}}{\unicode[STIX]{x03C0}}\right)^{1/6}.\end{eqnarray}$$
The time after which the current exits the slumping regime can be evaluated as
 $$\begin{eqnarray}t_{i}=\frac{aQ}{\unicode[STIX]{x03C0}g^{\prime }H^{2}},\end{eqnarray}$$
where
 $a=(7/4\;\unicode[STIX]{x1D719}_{0}^{-2/3})^{2}$
is a numerical coefficient.
$a=(7/4\;\unicode[STIX]{x1D719}_{0}^{-2/3})^{2}$
is a numerical coefficient.
The details of the calculations are presented in appendix A.
3.2.2 Statistical analysis
To investigate the spreading regimes obtained in our simulation and to check whether they fit the theoretical expressions, the radial spreading rates obtained in the simulations are evaluated and compared with the expected ones. The position of the external front is obtained from the non-dimensional density field
 $\unicode[STIX]{x1D70C}(x,y,z_{b},t)$
provided by the numerical simulations with the non-dimensional frequency of the numerical output being in the range
$\unicode[STIX]{x1D70C}(x,y,z_{b},t)$
provided by the numerical simulations with the non-dimensional frequency of the numerical output being in the range
 $[3.5{-}6.0]$
. The highest non-dimensional frequency is clearly in S7, which has the lowest
$[3.5{-}6.0]$
. The highest non-dimensional frequency is clearly in S7, which has the lowest
 $\unicode[STIX]{x1D716}$
. The filtering procedure applied to remove the effects of lobes and clefts provides a decomposition of the frontline kinematics into a radial spreading
$\unicode[STIX]{x1D716}$
. The filtering procedure applied to remove the effects of lobes and clefts provides a decomposition of the frontline kinematics into a radial spreading
 $R(t)$
about a centre of symmetry
$R(t)$
about a centre of symmetry
 $(x_{c}(t),y_{0})$
that translates in time along
$(x_{c}(t),y_{0})$
that translates in time along
 $x$
. The statistical analysis is successively applied on the series of radial positions about the symmetry axis,
$x$
. The statistical analysis is successively applied on the series of radial positions about the symmetry axis,
 $R(t)$
.
$R(t)$
.
The time series
 $R(t)$
is subdivided into three different time intervals separated by the transition times corresponding to the onset of the inertial regime and the beginning of the viscous phase. The sub-series are then compared with the asymptotic expressions expected for the slumping, inertial and viscous phases. In the case of the onset of the viscous–buoyancy regime, a simple similarity scaling provides a reasonable first guess of the time beyond which viscosity–buoyancy equilibrium holds,
$R(t)$
is subdivided into three different time intervals separated by the transition times corresponding to the onset of the inertial regime and the beginning of the viscous phase. The sub-series are then compared with the asymptotic expressions expected for the slumping, inertial and viscous phases. In the case of the onset of the viscous–buoyancy regime, a simple similarity scaling provides a reasonable first guess of the time beyond which viscosity–buoyancy equilibrium holds,
 $t_{v}=(Q/\unicode[STIX]{x1D708}g^{\prime })^{1/2}$
(Britter Reference Britter1979). For the onset of the inertial–buoyancy regime, the time estimate (3.5) is a starting reference to find the beginning of the inertial–buoyancy regime. As discussed in § 2.2, data corresponding to times
$t_{v}=(Q/\unicode[STIX]{x1D708}g^{\prime })^{1/2}$
(Britter Reference Britter1979). For the onset of the inertial–buoyancy regime, the time estimate (3.5) is a starting reference to find the beginning of the inertial–buoyancy regime. As discussed in § 2.2, data corresponding to times
 $t/t_{0}<1$
, i.e. when the inflow was not yet stabilised, are discarded from the analysis. The actual transition times are determined from the initial guesses by determining the best fit interval for each regime. The estimated times of transition
$t/t_{0}<1$
, i.e. when the inflow was not yet stabilised, are discarded from the analysis. The actual transition times are determined from the initial guesses by determining the best fit interval for each regime. The estimated times of transition
 $t_{0}$
,
$t_{0}$
,
 $t_{i}$
and
$t_{i}$
and
 $t_{v}$
are listed in table 2 together with the total duration of each test case. It can easily be verified that only the cases at lower Grashof numbers are expected to enter the viscous phase. In high
$t_{v}$
are listed in table 2 together with the total duration of each test case. It can easily be verified that only the cases at lower Grashof numbers are expected to enter the viscous phase. In high
 $Gr$
cases, i.e. S6–S11, the duration of the simulation is not expected to last long enough to approach the transition to the viscous–buoyancy regime. This is the reason why case S13 has been set up on an extended domain. To summarise, the expressions considered in the statistical fitting procedure are as follows (see § 3.2.1 and Britter Reference Britter1979):
$Gr$
cases, i.e. S6–S11, the duration of the simulation is not expected to last long enough to approach the transition to the viscous–buoyancy regime. This is the reason why case S13 has been set up on an extended domain. To summarise, the expressions considered in the statistical fitting procedure are as follows (see § 3.2.1 and Britter Reference Britter1979):
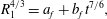 $$\begin{eqnarray}\displaystyle & \displaystyle R_{1}^{4/3}=a_{f}+b_{f}t^{7/6}, & \displaystyle\end{eqnarray}$$
 $$\begin{eqnarray}\displaystyle & \displaystyle R_{2}=c_{f}+d_{f}t^{3/4}, & \displaystyle\end{eqnarray}$$
 $$\begin{eqnarray}\displaystyle & \displaystyle R_{3}=e_{f}+g_{f}\sqrt{t}, & \displaystyle\end{eqnarray}$$
for the slumping, inertial–buoyancy and viscous–buoyancy regimes, respectively. Even though the transition times
 $t_{i}$
and
$t_{i}$
and
 $t_{v}$
represent the ‘best’ subdivision for the series to follow the theoretical laws, the starting point of each regime is generally located at some small distance from the radius which corresponds to the transition time. The introduction of the coefficients
$t_{v}$
represent the ‘best’ subdivision for the series to follow the theoretical laws, the starting point of each regime is generally located at some small distance from the radius which corresponds to the transition time. The introduction of the coefficients
 $a_{f}$
,
$a_{f}$
,
 $c_{f}$
and
$c_{f}$
and
 $e_{f}$
allows all points to be retained in the analysis, thereby avoiding the need to exclude transition periods.
$e_{f}$
allows all points to be retained in the analysis, thereby avoiding the need to exclude transition periods.
‘Best’ transition times and corresponding front positions estimated from the statistical evaluation of the time series.
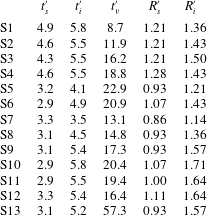
For each time interval, the series
 $R_{i}(t)$
,
$R_{i}(t)$
,
 $i=1,~2,~3$
, is processed through a standard least squares regression analysis and fitted to the corresponding analytical expression. The first interval considered is the time period
$i=1,~2,~3$
, is processed through a standard least squares regression analysis and fitted to the corresponding analytical expression. The first interval considered is the time period
 $[t_{s}^{\prime },t_{i}^{\prime }]$
in which the
$[t_{s}^{\prime },t_{i}^{\prime }]$
in which the
 $R_{1}(t)$
is expressed by (3.6), i.e. it is in the slumping regime. The second interval
$R_{1}(t)$
is expressed by (3.6), i.e. it is in the slumping regime. The second interval
 $[t_{i}^{\prime },t_{v}^{\prime }]$
is where the front position
$[t_{i}^{\prime },t_{v}^{\prime }]$
is where the front position
 $R_{2}(t)$
follows (3.7), i.e. where the current is in the buoyancy–inertial equilibrium. The transition times
$R_{2}(t)$
follows (3.7), i.e. where the current is in the buoyancy–inertial equilibrium. The transition times
 $t_{s}^{\prime },t_{i}^{\prime },t_{v}^{\prime }$
in table 3 may be compared with the expected values
$t_{s}^{\prime },t_{i}^{\prime },t_{v}^{\prime }$
in table 3 may be compared with the expected values
 $t_{i},t_{v}$
and the time of stabilisation of the volume flow at the gate
$t_{i},t_{v}$
and the time of stabilisation of the volume flow at the gate
 $t_{0}$
in table 2.
$t_{0}$
in table 2.
 $t_{s}^{\prime }$
is the time used as a lower bound of the slumping phase.
$t_{s}^{\prime }$
is the time used as a lower bound of the slumping phase.
The comparison of
 $R_{i}^{\prime }$
in table 3 with the non-dimensional expression for the position of the first hydraulic jump
$R_{i}^{\prime }$
in table 3 with the non-dimensional expression for the position of the first hydraulic jump
 $r_{r}=(r_{1r}/H)^{2}$
from figure 18 shows that in all cases S6–S11, the position of the first ring is just after
$r_{r}=(r_{1r}/H)^{2}$
from figure 18 shows that in all cases S6–S11, the position of the first ring is just after
 $R_{i}^{\prime }$
, i.e. at the beginning of the inertial regime.
$R_{i}^{\prime }$
, i.e. at the beginning of the inertial regime.
Non-dimensional radial front position versus non-dimensional time. The vertical dashed line at
 $t/t_{v}=1$
represents the transition to the viscous phase. Cases S1–S5: low Grashof number.
$t/t_{v}=1$
represents the transition to the viscous phase. Cases S1–S5: low Grashof number.
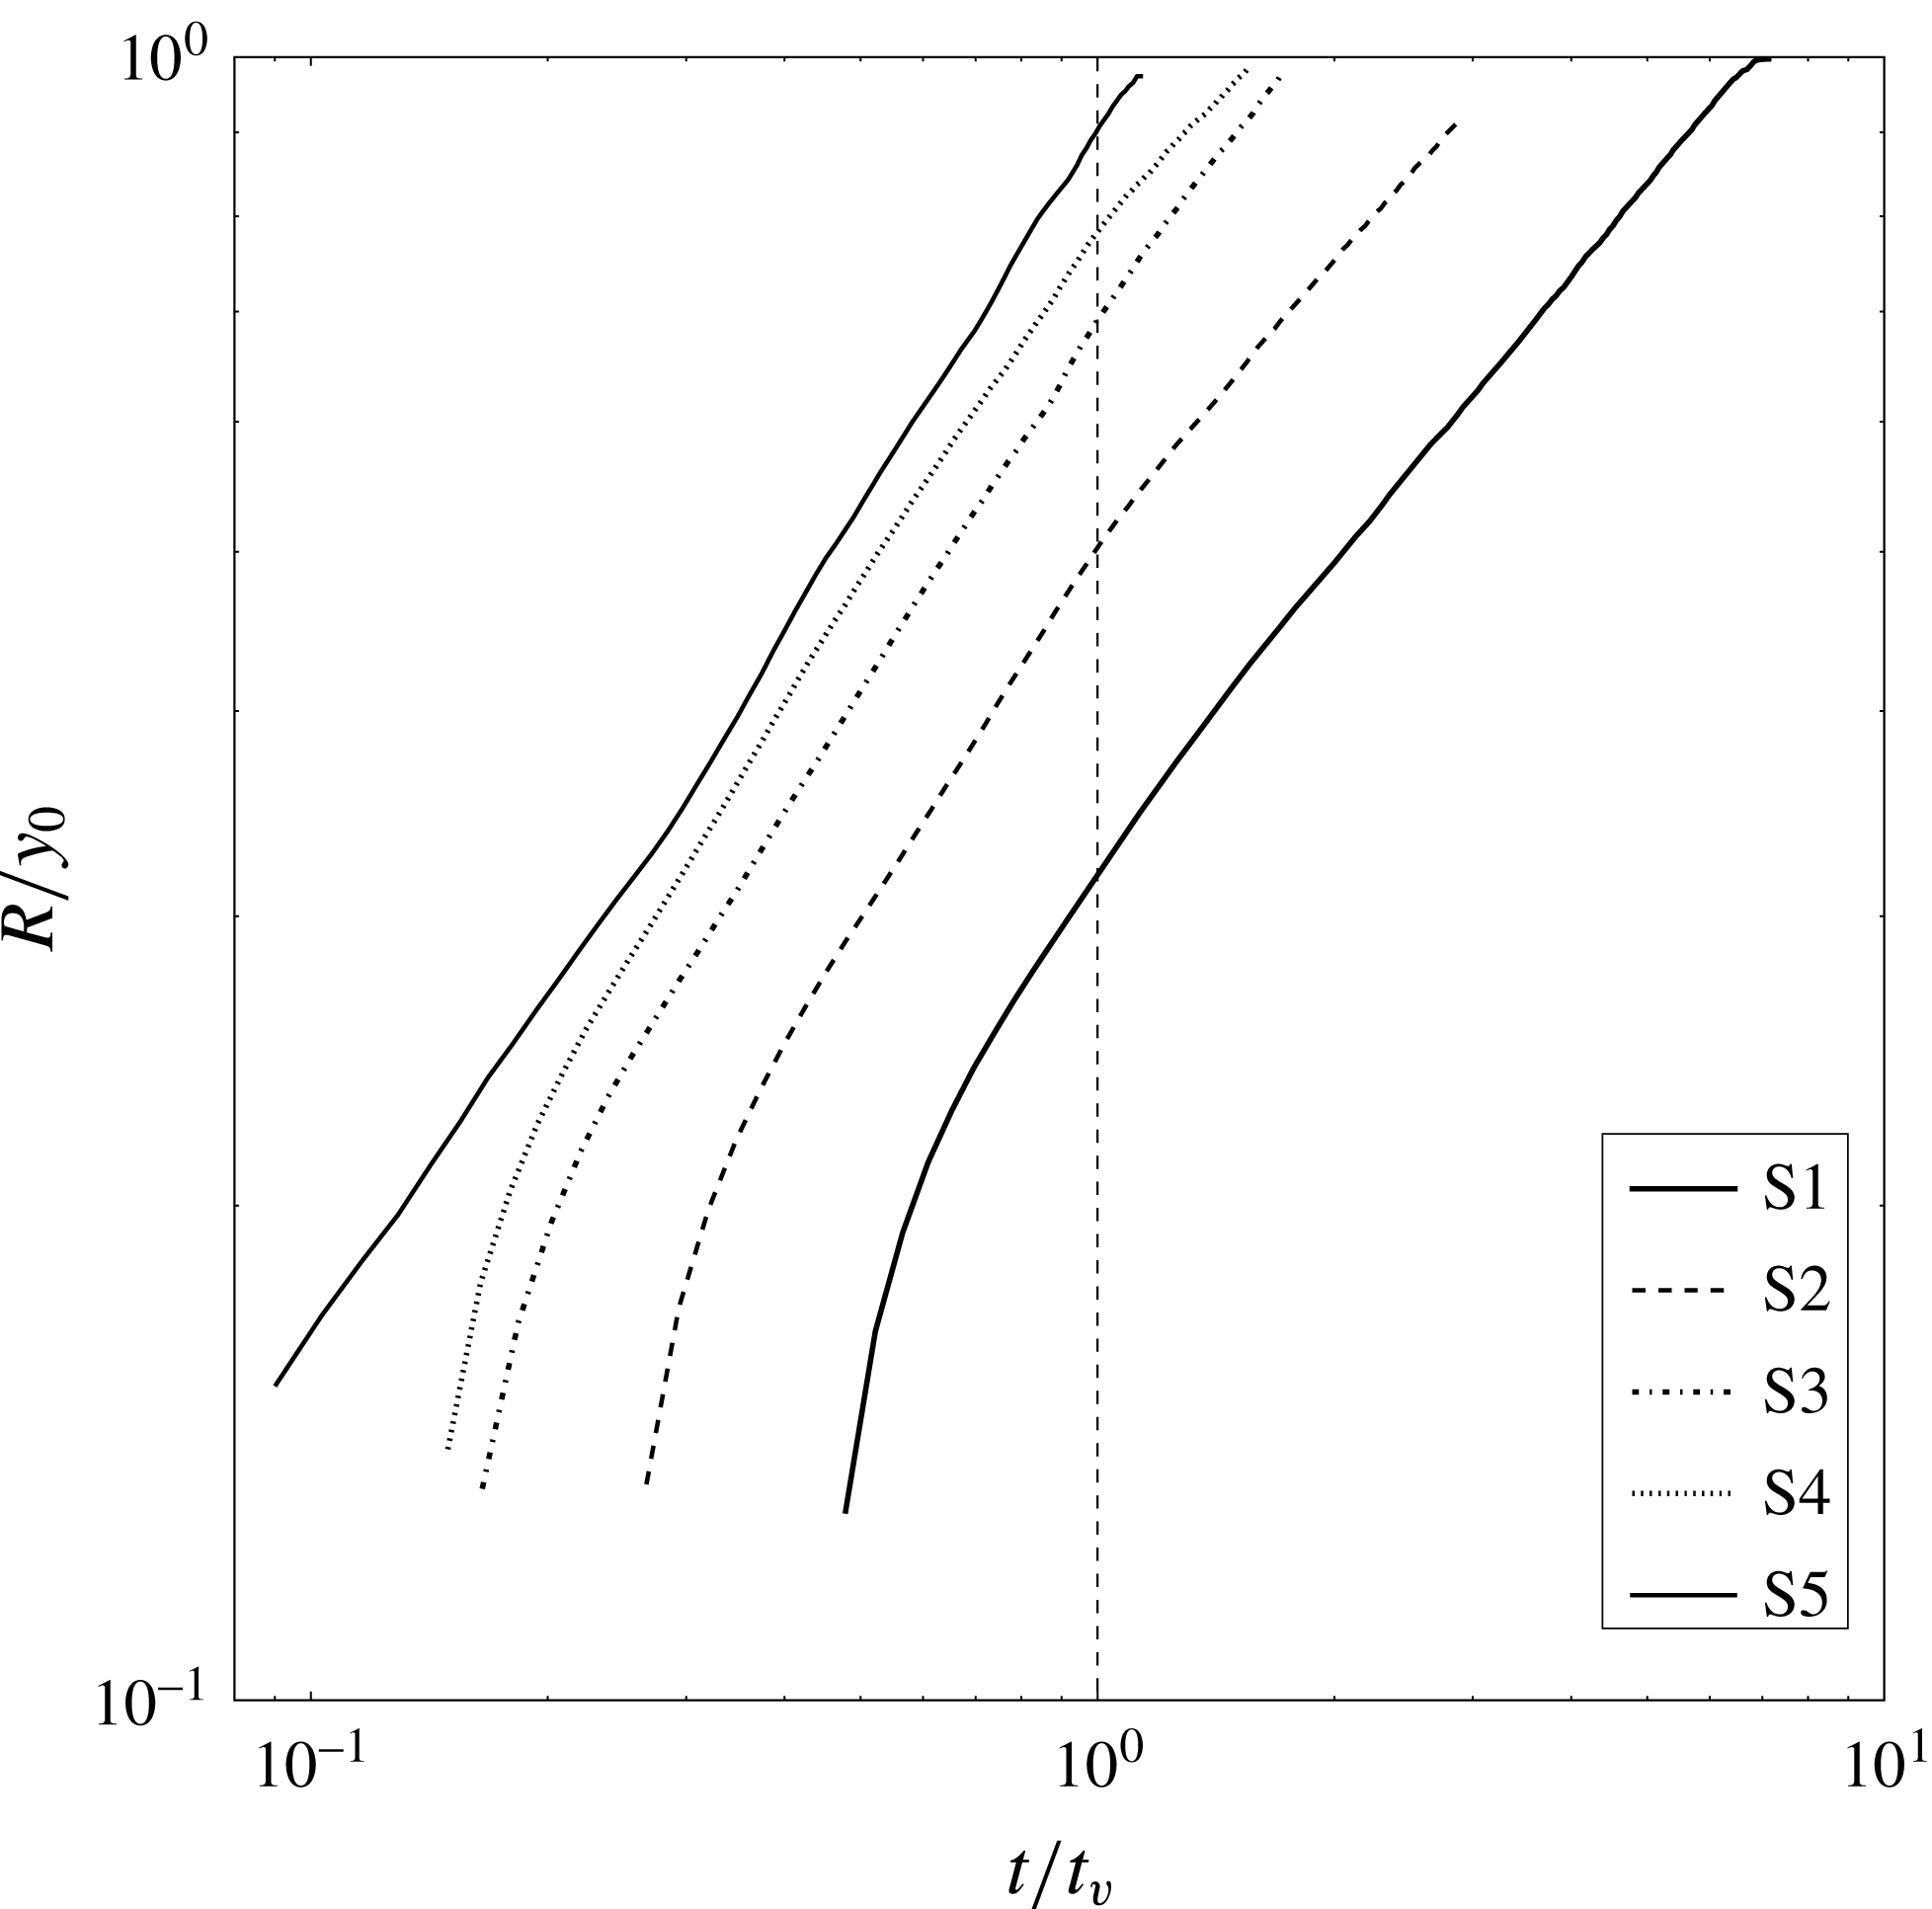
The time evolution of the radial front position for the entire duration of the simulations is investigated herein. The cases at low Grashof numbers (cases S1–S5) are plotted in figure 22, the adopted scaling highlights the transition between the inertial phase and the viscous one. In these cases, it is clearly observed that the gravity currents do enter the buoyancy–viscous equilibrium regime, although the duration of the buoyancy–inertial equilibrium regime increases at the expense of the viscous phase with increasing
 $Gr$
. Within this range of
$Gr$
. Within this range of
 $Gr$
values,
$Gr$
values,
 $[10^{4}{-}10^{6}]$
, the slumping phase hardly appears (as discussed later).
$[10^{4}{-}10^{6}]$
, the slumping phase hardly appears (as discussed later).
Non-dimensional radial front position versus non-dimensional time cases S6–S11: high Grashof number; red dots are experimental data from S12.
The time evolution of the currents at medium–large
 $Gr$
(simulations S6–S11 and experimental data S12) is presented in figure 23, where time is made non-dimensional with
$Gr$
(simulations S6–S11 and experimental data S12) is presented in figure 23, where time is made non-dimensional with
 $t_{v}$
. Note that in these cases, the currents do not develop enough to enter the viscous phase. This is the reason why if the scale
$t_{v}$
. Note that in these cases, the currents do not develop enough to enter the viscous phase. This is the reason why if the scale
 $t_{i}$
were used, all the radial front time evolutions would collapse over a single line. All lines are parallel in the inertial–buoyancy domain. The series S11 and S12 are very close, indicating a good correspondence between experiment and numerical simulation. An inspection reveals that the two series show signs of a small-amplitude, large-scale oscillation due to the interactions between rings and the external front.
$t_{i}$
were used, all the radial front time evolutions would collapse over a single line. All lines are parallel in the inertial–buoyancy domain. The series S11 and S12 are very close, indicating a good correspondence between experiment and numerical simulation. An inspection reveals that the two series show signs of a small-amplitude, large-scale oscillation due to the interactions between rings and the external front.
Note that
 $t_{v}$
increases with
$t_{v}$
increases with
 $Gr$
; consequently, the part of the inertial phase described by the simulation progressively decreases due to the finite dimension of the domain LD. For high
$Gr$
; consequently, the part of the inertial phase described by the simulation progressively decreases due to the finite dimension of the domain LD. For high
 $Gr$
cases, S13 is the only one for which the numerical simulation completely describes the entire inertial phase.
$Gr$
cases, S13 is the only one for which the numerical simulation completely describes the entire inertial phase.
3.2.3 Slumping phase
The squared Pearson correlation coefficient
 ${\mathcal{R}}^{2}$
is approximately 1.00 for all cases considered, indicating that the regression analysis of each numerical simulation (3.6) closely follows the proposed asymptotic expression for the slumping regime (3.3). In figure 24, the presence of a slumping phase is visible to the left of the vertical dashed line
${\mathcal{R}}^{2}$
is approximately 1.00 for all cases considered, indicating that the regression analysis of each numerical simulation (3.6) closely follows the proposed asymptotic expression for the slumping regime (3.3). In figure 24, the presence of a slumping phase is visible to the left of the vertical dashed line
 $t/t_{i}=1$
. All points collapse towards the horizontal line at
$t/t_{i}=1$
. All points collapse towards the horizontal line at
 $R^{4/3}/(a_{f}+b_{f}t^{7/6})=1$
in the slumping region, where
$R^{4/3}/(a_{f}+b_{f}t^{7/6})=1$
in the slumping region, where
 $a_{f}$
is found to be very small in all cases.
$a_{f}$
is found to be very small in all cases.
To relate
 $b_{f}$
to the parameter
$b_{f}$
to the parameter
 $C_{sl}$
in (3.3), the ratio between the value of the statistical estimate
$C_{sl}$
in (3.3), the ratio between the value of the statistical estimate
 $b_{f}$
and the coefficient of the asymptotic law
$b_{f}$
and the coefficient of the asymptotic law
 $C_{sl}$
is shown in figure 25. The average of the points, i.e.
$C_{sl}$
is shown in figure 25. The average of the points, i.e.
 $\bar{\unicode[STIX]{x1D707}}=\langle b_{f}/C_{sl}\rangle$
, is indicated as a dashed line. A single star indicates the value of
$\bar{\unicode[STIX]{x1D707}}=\langle b_{f}/C_{sl}\rangle$
, is indicated as a dashed line. A single star indicates the value of
 $\bar{b}_{fexp}$
, where
$\bar{b}_{fexp}$
, where
 $b_{f}$
is calculated using the data from experiment S12, and it is normalised with the scale of S11, which is the closest numerical simulation. The box model (3.3) is found to be in reasonable agreement with (3.6), where
$b_{f}$
is calculated using the data from experiment S12, and it is normalised with the scale of S11, which is the closest numerical simulation. The box model (3.3) is found to be in reasonable agreement with (3.6), where
 $\bar{b_{f}}=\bar{\unicode[STIX]{x1D707}}C_{sl}$
, and
$\bar{b_{f}}=\bar{\unicode[STIX]{x1D707}}C_{sl}$
, and
 $\bar{\unicode[STIX]{x1D707}}=(0.37\pm 0.05)$
. The error is taken as the statistical error at the 95 % confidence level. The expression of the front position with time in the slumping regime would then be expressed as
$\bar{\unicode[STIX]{x1D707}}=(0.37\pm 0.05)$
. The error is taken as the statistical error at the 95 % confidence level. The expression of the front position with time in the slumping regime would then be expressed as
 $$\begin{eqnarray}r(t)^{4/3}=\bar{\unicode[STIX]{x1D707}}C_{sl}~t^{7/6}.\end{eqnarray}$$
Cases S1 and S2 have been excluded due to the very short duration of the phase. Comparing the duration of the phase obtained from figure 24 with the differences
 $t_{i}-t_{0}$
(see table 2), it is apparent that in the three cases (S7, S8, and S9/S13) where the duration is longer, the slumping phase starts before the flow rate at the gate
$t_{i}-t_{0}$
(see table 2), it is apparent that in the three cases (S7, S8, and S9/S13) where the duration is longer, the slumping phase starts before the flow rate at the gate
 $Q$
stabilises. In some other cases (S4, S5, S6 and S11), the slumping starts at approximately
$Q$
stabilises. In some other cases (S4, S5, S6 and S11), the slumping starts at approximately
 $t_{0}$
. The remaining cases, S1, S2 and S3, are the cases with the shortest slumping duration.
$t_{0}$
. The remaining cases, S1, S2 and S3, are the cases with the shortest slumping duration.
Domain of existence of the slumping regime (3.6), non-dimensional radial front position versus non-dimensional time. Vertical dashed line indicates the expected transition from the slumping phase to the inertial phase.
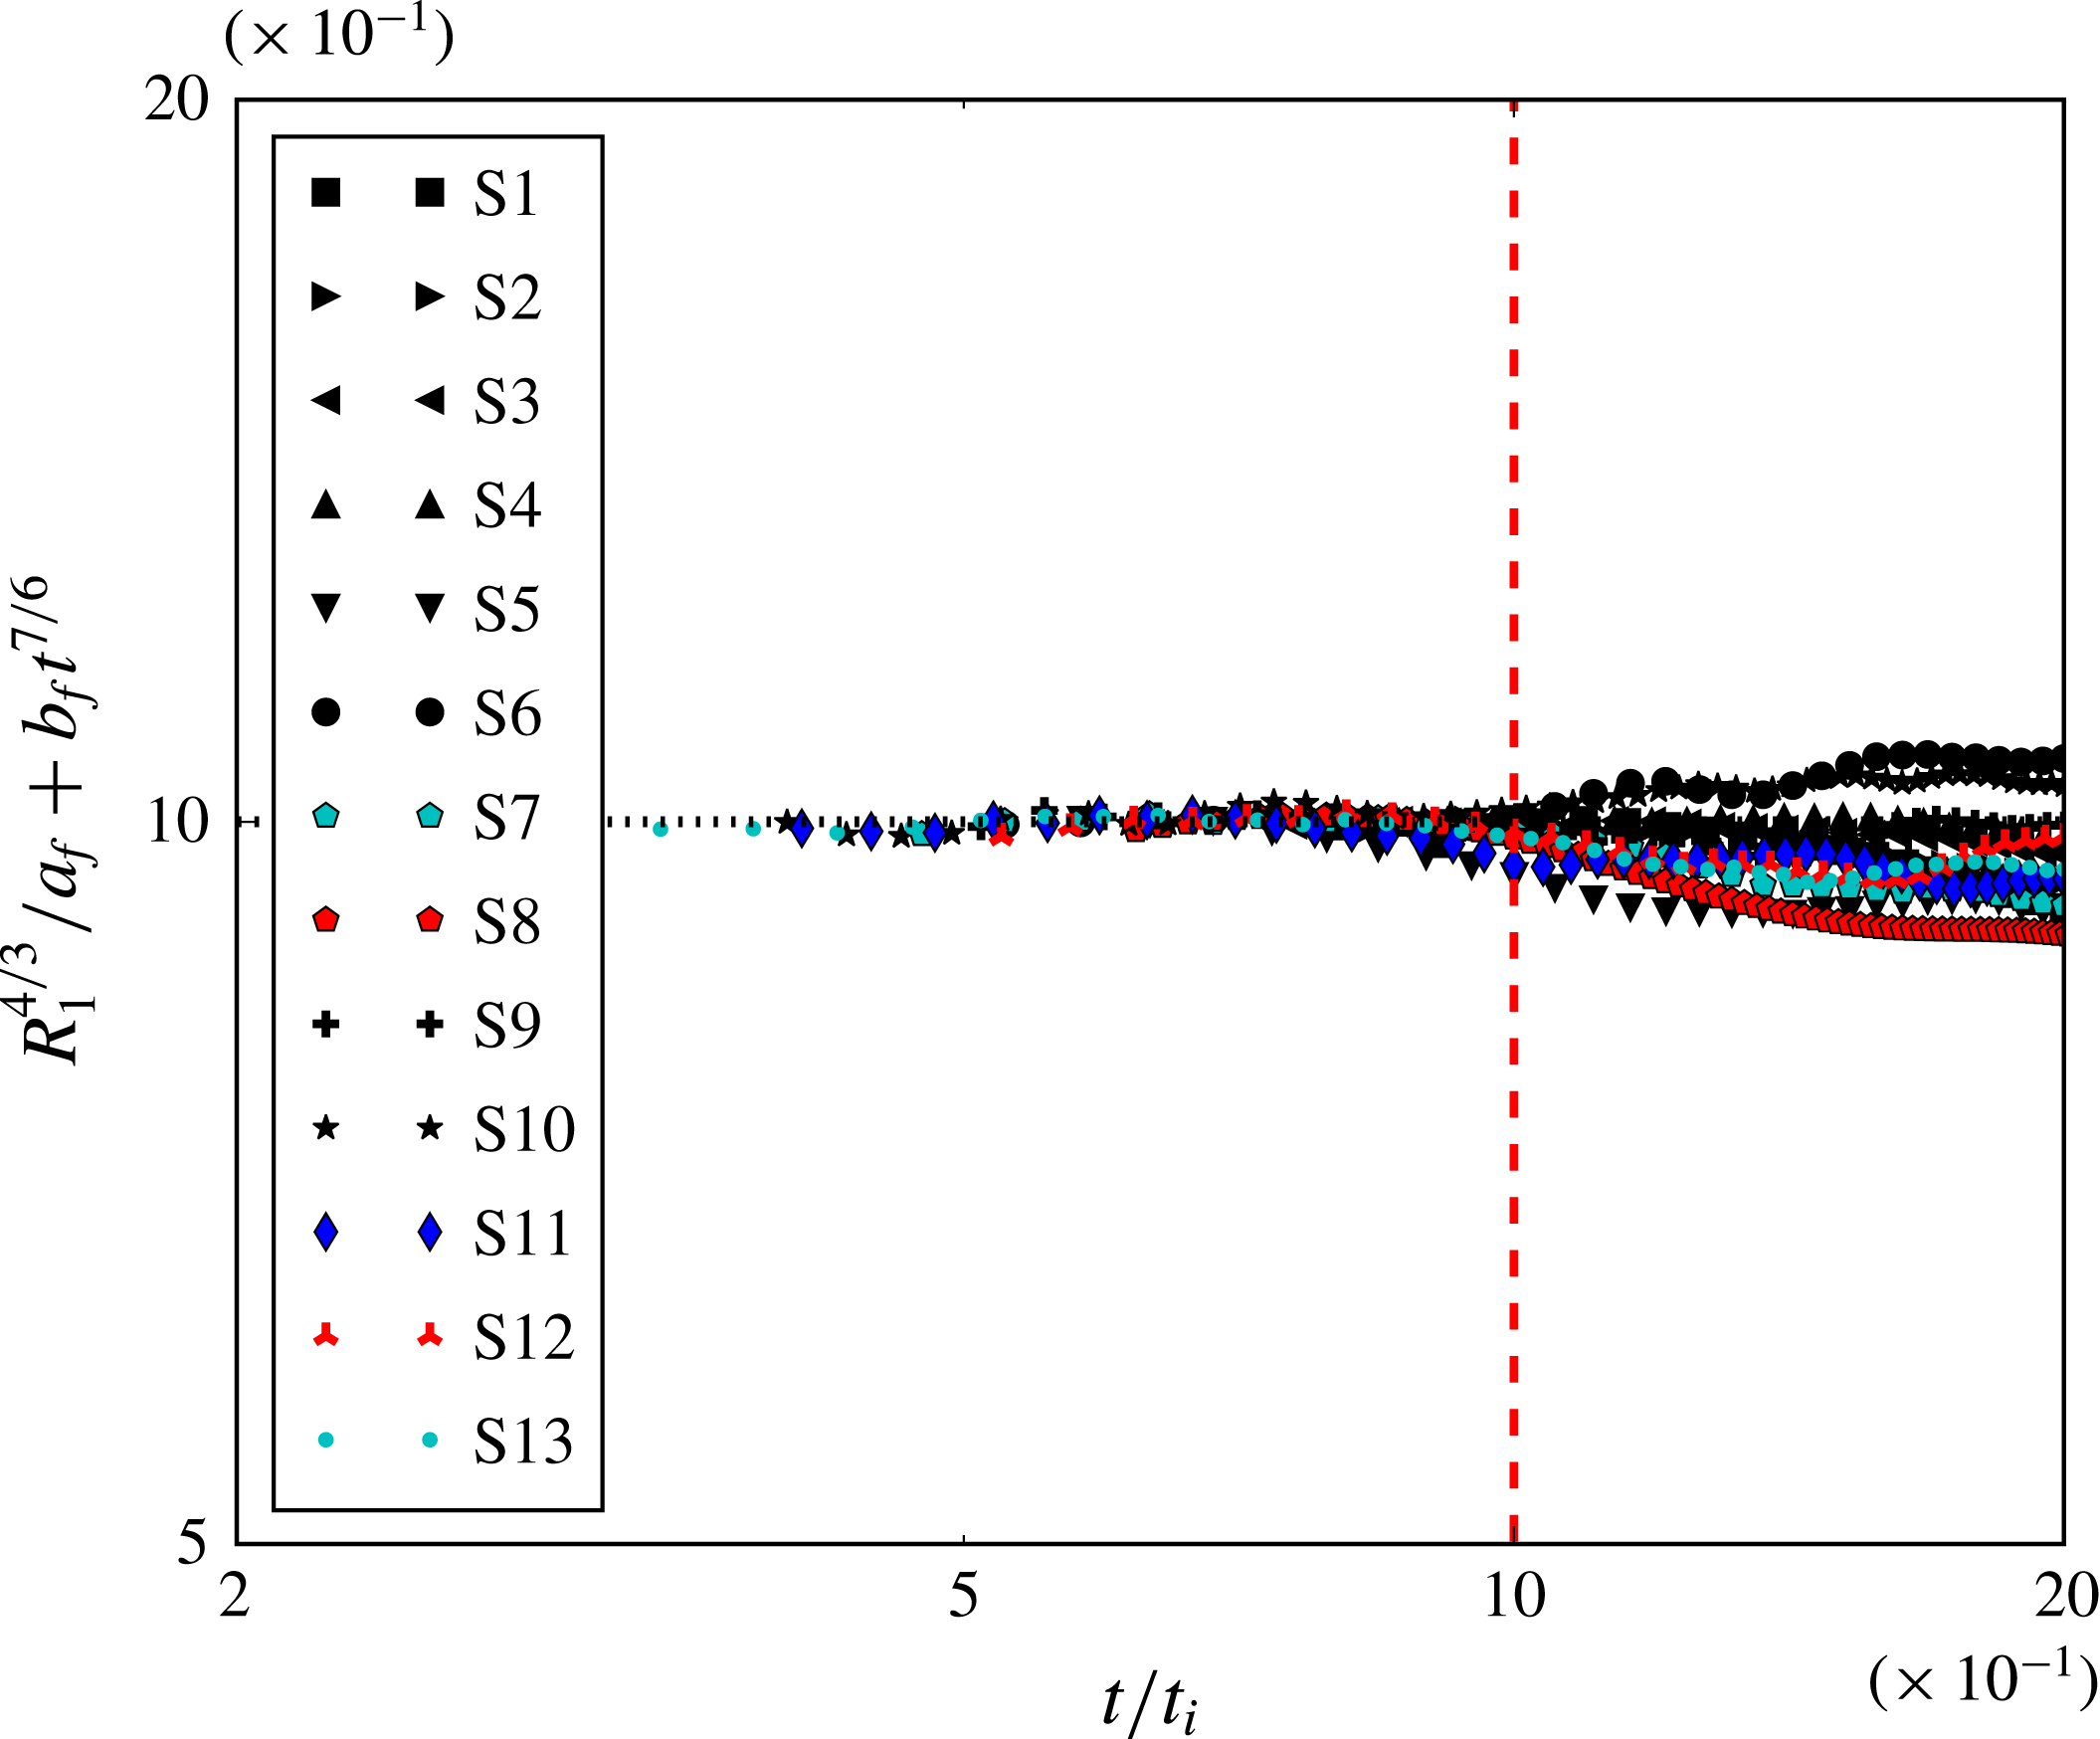
Non-dimensional coefficient
 $b_{f}$
normalised by
$b_{f}$
normalised by
 $C_{sl}$
(3.6) versus
$C_{sl}$
(3.6) versus
 $Gr$
, cases S1–S11. Dashed line represents
$Gr$
, cases S1–S11. Dashed line represents
 $\bar{\unicode[STIX]{x1D707}}=\langle b_{f}/C_{sl}\rangle$
.
$\bar{\unicode[STIX]{x1D707}}=\langle b_{f}/C_{sl}\rangle$
.
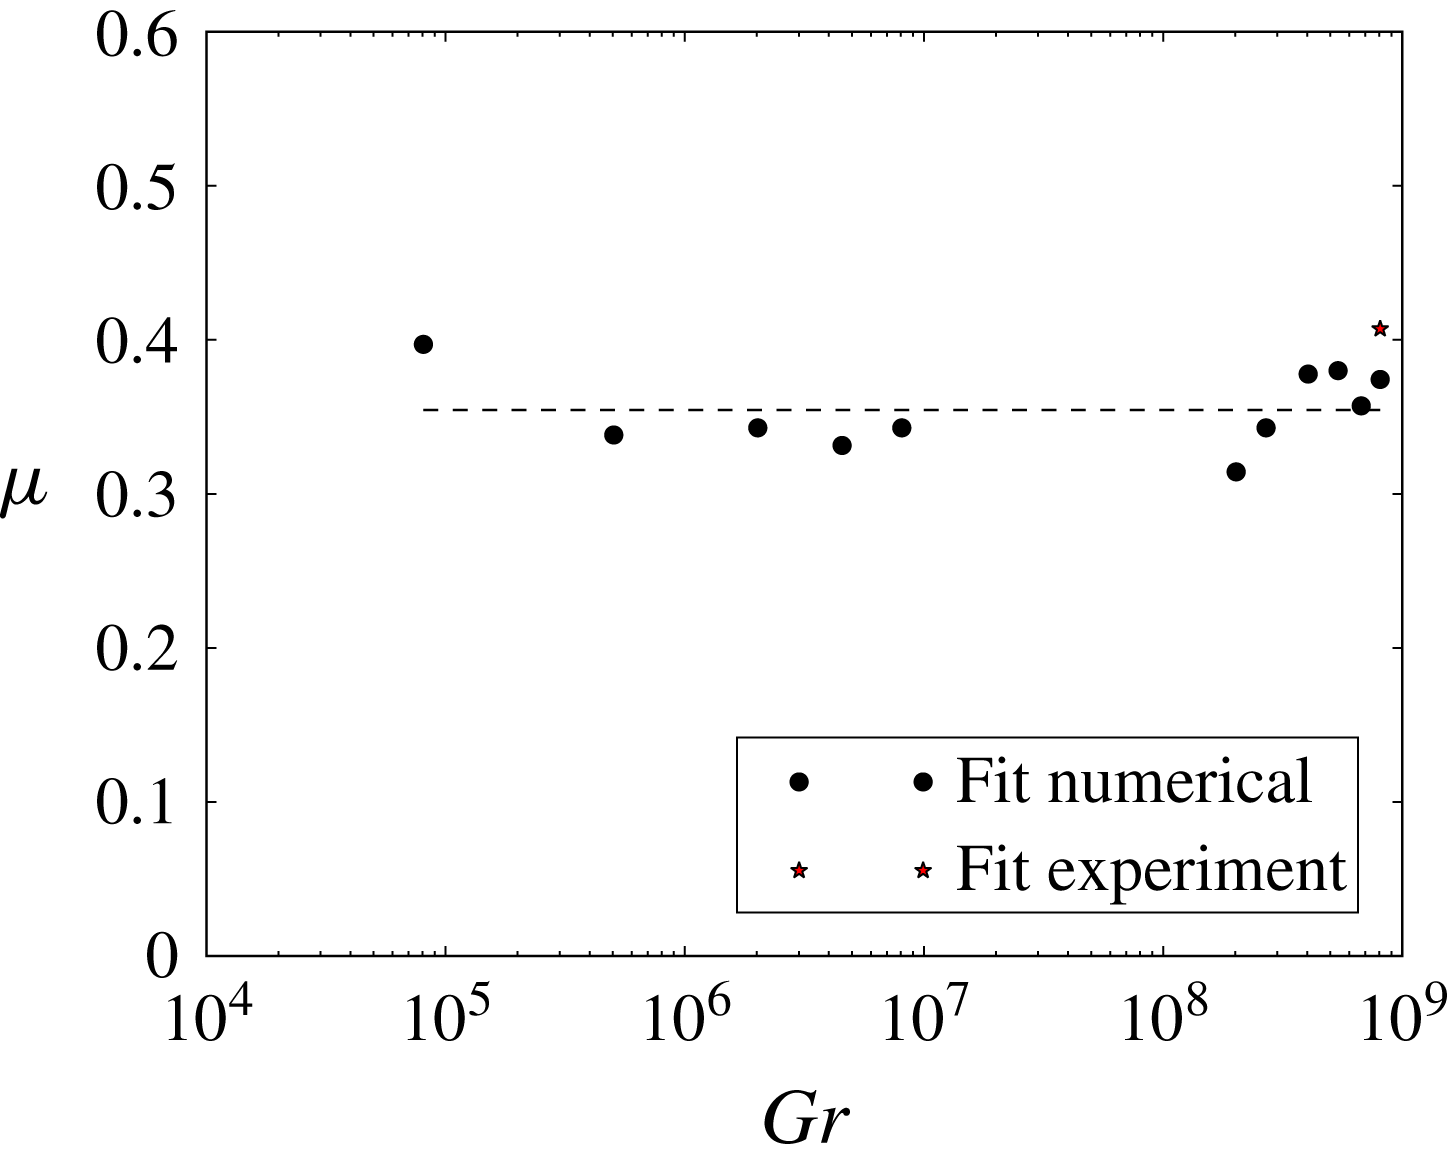
3.2.4 Garvine model
The radial expansion in time given by the slumping model,
 $r\propto t^{7/8}$
, is similar to the ‘spreading’ law
$r\propto t^{7/8}$
, is similar to the ‘spreading’ law
 $r\propto t^{0.92}$
proposed analytically by Garvine (Reference Garvine1984). The present results help to clarify the controversial theoretical results found for the initial spread of the gravity current by Chen (Reference Chen1980) and Garvine (Reference Garvine1984): the former, proceeding forward in time in the solution of the initial value problem, found a ‘spreading’ phase before a hydraulic jump region (‘a trailing front’), whereas the latter, proceeding backward in solving the similarity differential equation, hit the discontinuity while still in the inertial range. In other words, they may have fallen in different ‘initial’ asymptotic regimes.
$r\propto t^{0.92}$
proposed analytically by Garvine (Reference Garvine1984). The present results help to clarify the controversial theoretical results found for the initial spread of the gravity current by Chen (Reference Chen1980) and Garvine (Reference Garvine1984): the former, proceeding forward in time in the solution of the initial value problem, found a ‘spreading’ phase before a hydraulic jump region (‘a trailing front’), whereas the latter, proceeding backward in solving the similarity differential equation, hit the discontinuity while still in the inertial range. In other words, they may have fallen in different ‘initial’ asymptotic regimes.
3.2.5 Inertial–buoyancy equilibrium phase
The presence of an inertial–buoyancy equilibrium phase following (3.7) and corresponding to the similarity expression (1.6) is observed in all cases, with a very high value of the Pearson correlation coefficient (
 ${\mathcal{R}}^{2}$
exceeding
${\mathcal{R}}^{2}$
exceeding
 $0.997$
) found in all regressions used for estimating
$0.997$
) found in all regressions used for estimating
 $d_{f}$
. In figure 26, the inertial regime appears as a region with a constant value of the non-dimensional front position
$d_{f}$
. In figure 26, the inertial regime appears as a region with a constant value of the non-dimensional front position
 $R/(c_{f}+d_{f}t^{3/4})$
versus non-dimensional time
$R/(c_{f}+d_{f}t^{3/4})$
versus non-dimensional time
 $t/t_{i}$
. Again, since
$t/t_{i}$
. Again, since
 $c_{f}\ll d_{f}$
in all cases, the value of the ordinate corresponding to the dashed horizontal line indicates the coefficient
$c_{f}\ll d_{f}$
in all cases, the value of the ordinate corresponding to the dashed horizontal line indicates the coefficient
 $\unicode[STIX]{x1D705}_{s}$
in
$\unicode[STIX]{x1D705}_{s}$
in
 $$\begin{eqnarray}r=\unicode[STIX]{x1D705}_{s}d_{f}t^{3/4}.\end{eqnarray}$$
The estimated value is
 $$\begin{eqnarray}\unicode[STIX]{x1D705}_{s}=(2.4\pm 0.1),\end{eqnarray}$$
where the error indicates the band of values between which all points are bounded in the inertial regime area to the right of
 $t/t_{i}=1$
.
$t/t_{i}=1$
.
Domain of existence of the inertial–buoyancy regime (3.7): non-dimensional radial front position versus non-dimensional time. Dashed line indicates
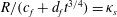 $R/(c_{f}+d_{f}t^{3/4})=\unicode[STIX]{x1D705}_{s}$
; dotted lines indicate the interval at the 95 % confidence level. Vertical dash-dot line indicates the theoretical transition to the inertial regime.
$R/(c_{f}+d_{f}t^{3/4})=\unicode[STIX]{x1D705}_{s}$
; dotted lines indicate the interval at the 95 % confidence level. Vertical dash-dot line indicates the theoretical transition to the inertial regime.
The inertial parameter
 $d_{f}$
can be related to
$d_{f}$
can be related to
 $C_{in}$
in (3.7), considering the non-dimensional parameter
$C_{in}$
in (3.7), considering the non-dimensional parameter
 $\unicode[STIX]{x1D6FF}=d_{f}/C_{in}$
where
$\unicode[STIX]{x1D6FF}=d_{f}/C_{in}$
where
 $$\begin{eqnarray}C_{in}=(g^{\prime }Q)^{1/4}.\end{eqnarray}$$
The distribution of the parameter
 $\unicode[STIX]{x1D6FF}=d_{f}/C_{in}$
is shown in figure 27. The average
$\unicode[STIX]{x1D6FF}=d_{f}/C_{in}$
is shown in figure 27. The average
 $\bar{\unicode[STIX]{x1D6FF}}=\langle d_{f}/C_{in}\rangle$
is shown as a dashed line. Cases S1 and S2 are excluded from the analysis due to the very short duration of their inertial phase (see table 2).
$\bar{\unicode[STIX]{x1D6FF}}=\langle d_{f}/C_{in}\rangle$
is shown as a dashed line. Cases S1 and S2 are excluded from the analysis due to the very short duration of their inertial phase (see table 2).
Non-dimensional coefficient
 $\unicode[STIX]{x1D6FF}=d_{f}/C_{in}$
in (3.7) versus
$\unicode[STIX]{x1D6FF}=d_{f}/C_{in}$
in (3.7) versus
 $Gr$
, cases S3–S12. Dashed line represents
$Gr$
, cases S3–S12. Dashed line represents
 $\bar{\unicode[STIX]{x1D6FF}}=\langle d_{f}/C_{in}\rangle$
.
$\bar{\unicode[STIX]{x1D6FF}}=\langle d_{f}/C_{in}\rangle$
.
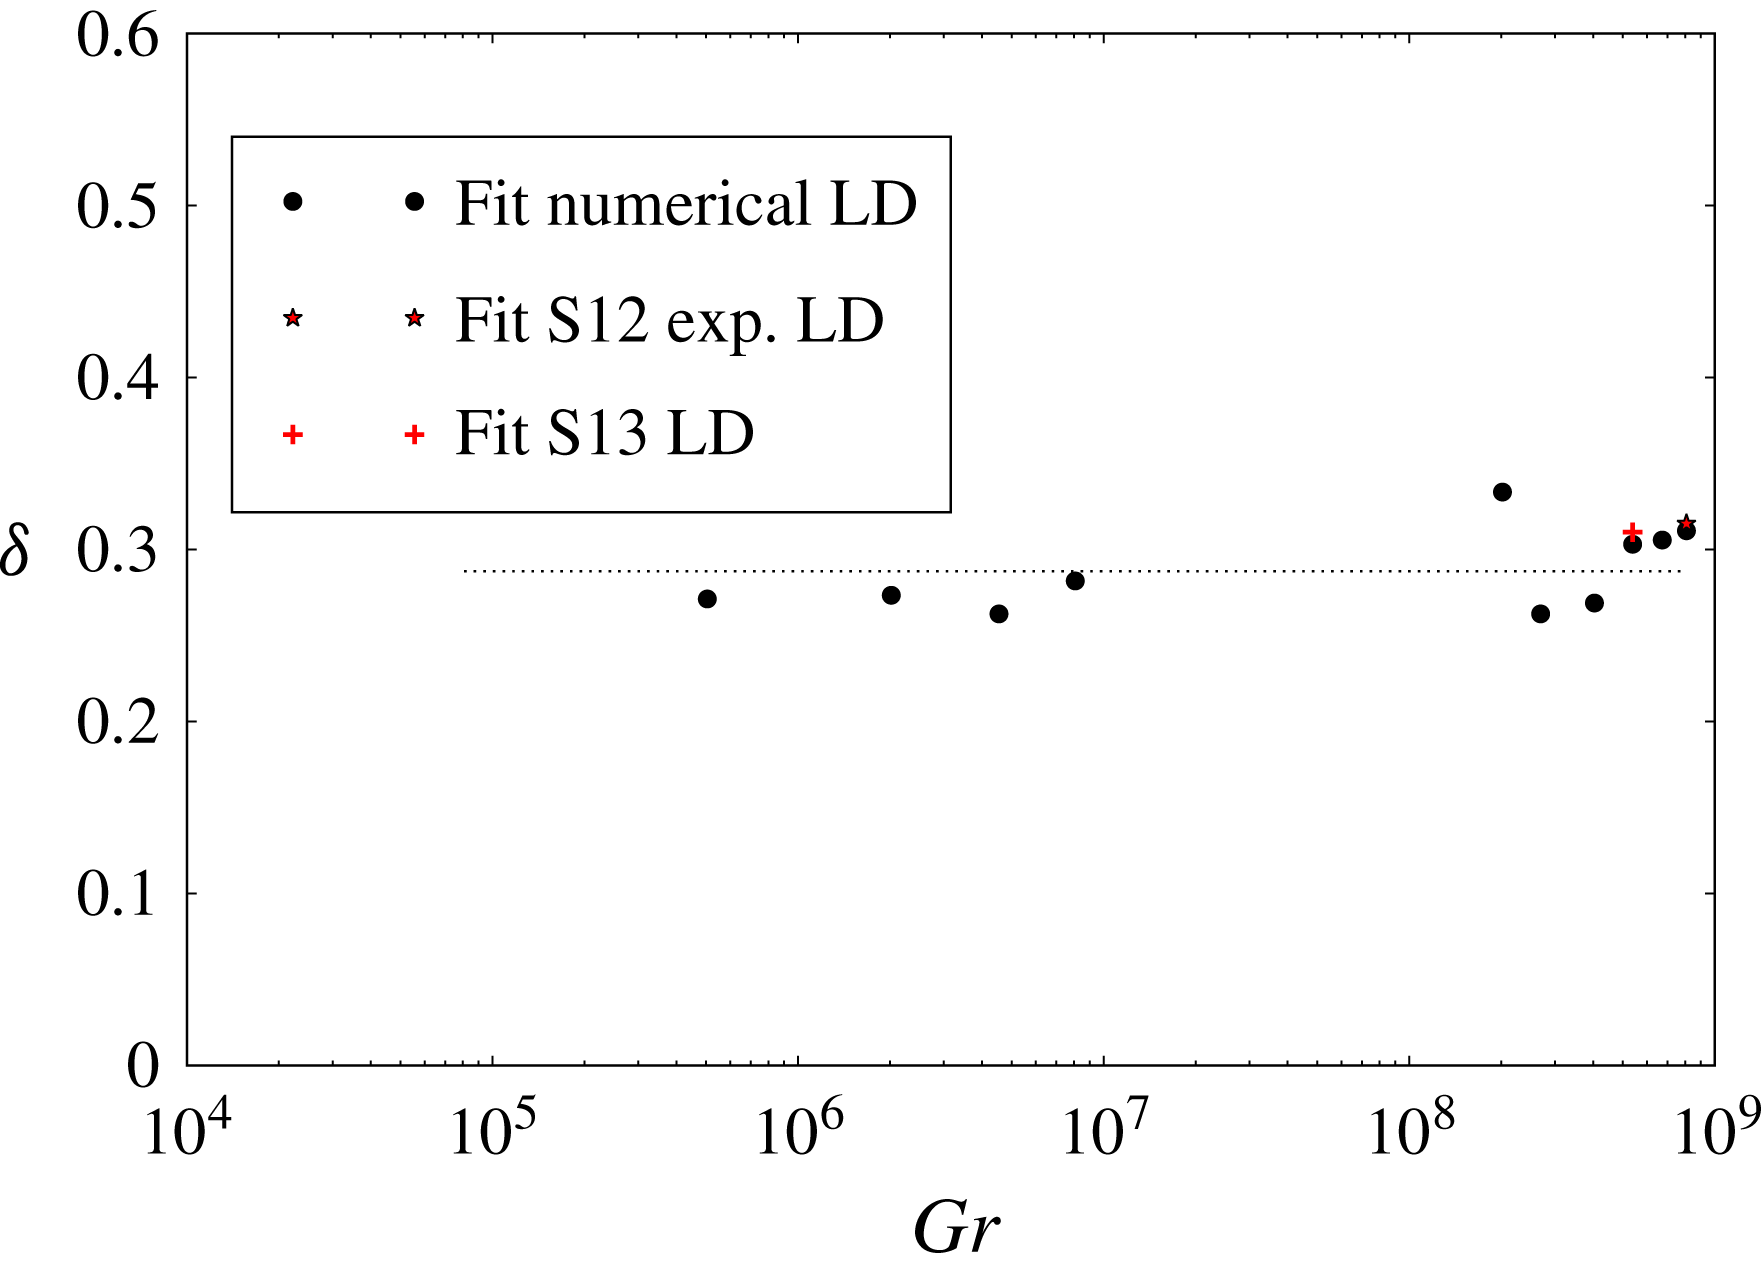
The average non-dimensional parameter is estimated as
 $\bar{\unicode[STIX]{x1D6FF}}=(0.29\pm 0.04)$
at the 95 % confidence level. Expressing
$\bar{\unicode[STIX]{x1D6FF}}=(0.29\pm 0.04)$
at the 95 % confidence level. Expressing
 $d_{f}=\bar{\unicode[STIX]{x1D6FF}}C_{in}$
, equation (3.7) is obtained as
$d_{f}=\bar{\unicode[STIX]{x1D6FF}}C_{in}$
, equation (3.7) is obtained as
 $$\begin{eqnarray}r(t)=\unicode[STIX]{x1D705}(C_{in})^{1/4}t^{3/4},\end{eqnarray}$$
where
 $\unicode[STIX]{x1D705}=\unicode[STIX]{x1D705}_{s}\bar{\unicode[STIX]{x1D6FF}}=(0.7\pm 0.1)$
. Despite the size of the error, the estimate is in good agreement with the value provided in the literature (Huppert Reference Huppert1982; Britter Reference Britter1979) for the asymptotic spreading, i.e.
$\unicode[STIX]{x1D705}=\unicode[STIX]{x1D705}_{s}\bar{\unicode[STIX]{x1D6FF}}=(0.7\pm 0.1)$
. Despite the size of the error, the estimate is in good agreement with the value provided in the literature (Huppert Reference Huppert1982; Britter Reference Britter1979) for the asymptotic spreading, i.e.
 $$\begin{eqnarray}\unicode[STIX]{x1D705}=(0.84\pm 0.06).\end{eqnarray}$$
A similar estimate for the parameter
 $\unicode[STIX]{x1D705}$
can be obtained by directly using the scaling factor (3.12) in the plot of
$\unicode[STIX]{x1D705}$
can be obtained by directly using the scaling factor (3.12) in the plot of
 $r/(C_{in}t^{3/4})$
versus
$r/(C_{in}t^{3/4})$
versus
 $t/t_{i}$
and proceeding as in figure 26. In this case, the interval of values of
$t/t_{i}$
and proceeding as in figure 26. In this case, the interval of values of
 $\unicode[STIX]{x1D705}$
can be read directly from figure 28. The most obvious difference with respect to figure 26 is that a clear dependence of
$\unicode[STIX]{x1D705}$
can be read directly from figure 28. The most obvious difference with respect to figure 26 is that a clear dependence of
 $\unicode[STIX]{x1D705}$
from
$\unicode[STIX]{x1D705}$
from
 $Gr$
is now observed. At least three different levels of
$Gr$
is now observed. At least three different levels of
 $\unicode[STIX]{x1D705}$
are detectable, i.e.
$\unicode[STIX]{x1D705}$
are detectable, i.e.
 $\unicode[STIX]{x1D705}_{1}=0.6$
for case S1,
$\unicode[STIX]{x1D705}_{1}=0.6$
for case S1,
 $\unicode[STIX]{x1D705}_{2}=0.65$
for cases S2–S5 and
$\unicode[STIX]{x1D705}_{2}=0.65$
for cases S2–S5 and
 $\unicode[STIX]{x1D705}_{3}=0.7$
for cases S6–S13. Since
$\unicode[STIX]{x1D705}_{3}=0.7$
for cases S6–S13. Since
 $\unicode[STIX]{x1D705}$
cannot depend on the viscosity, the splitting in a band of values
$\unicode[STIX]{x1D705}$
cannot depend on the viscosity, the splitting in a band of values
 $\unicode[STIX]{x1D705}_{1},\unicode[STIX]{x1D705}_{2},\unicode[STIX]{x1D705}_{3}$
must have been introduced by the use of the flow rate
$\unicode[STIX]{x1D705}_{1},\unicode[STIX]{x1D705}_{2},\unicode[STIX]{x1D705}_{3}$
must have been introduced by the use of the flow rate
 $Q$
in the non-dimensionalisation procedure. In fact, the assumption implicitly made here and above is that the entire inflow
$Q$
in the non-dimensionalisation procedure. In fact, the assumption implicitly made here and above is that the entire inflow
 $Q$
is the source of the axisymmetric current at the axis position. However, this assumption is not consistent with the kinematics of the flow described in § 3.1, where it is shown that the inflow
$Q$
is the source of the axisymmetric current at the axis position. However, this assumption is not consistent with the kinematics of the flow described in § 3.1, where it is shown that the inflow
 $Q$
is split in a radial flow with the vertical axis
$Q$
is split in a radial flow with the vertical axis
 $(x_{c}(t),z_{0})$
moving on the horizontal plane and a longitudinal flow that slowly translates the entire radial current along the
$(x_{c}(t),z_{0})$
moving on the horizontal plane and a longitudinal flow that slowly translates the entire radial current along the
 $x$
axis.
$x$
axis.
Inertial–buoyancy regime (1.6): non-dimensional radial front position versus non-dimensional time. Dashed red line indicates
 $R/(C_{in}t^{3/4})=\unicode[STIX]{x1D705}_{1}$
; dotted line indicates
$R/(C_{in}t^{3/4})=\unicode[STIX]{x1D705}_{1}$
; dotted line indicates
 $R/(C_{in}t^{3/4})=\unicode[STIX]{x1D705}_{2}$
. Dot-dashed line indicates
$R/(C_{in}t^{3/4})=\unicode[STIX]{x1D705}_{2}$
. Dot-dashed line indicates
 $R/(C_{in}t^{3/4})=\unicode[STIX]{x1D705}_{3}$
. Vertical dash-dot line indicates the theoretical transition to the inertial regime;
$R/(C_{in}t^{3/4})=\unicode[STIX]{x1D705}_{3}$
. Vertical dash-dot line indicates the theoretical transition to the inertial regime;
 $Q$
is assumed as the flow rate in the axial position.
$Q$
is assumed as the flow rate in the axial position.
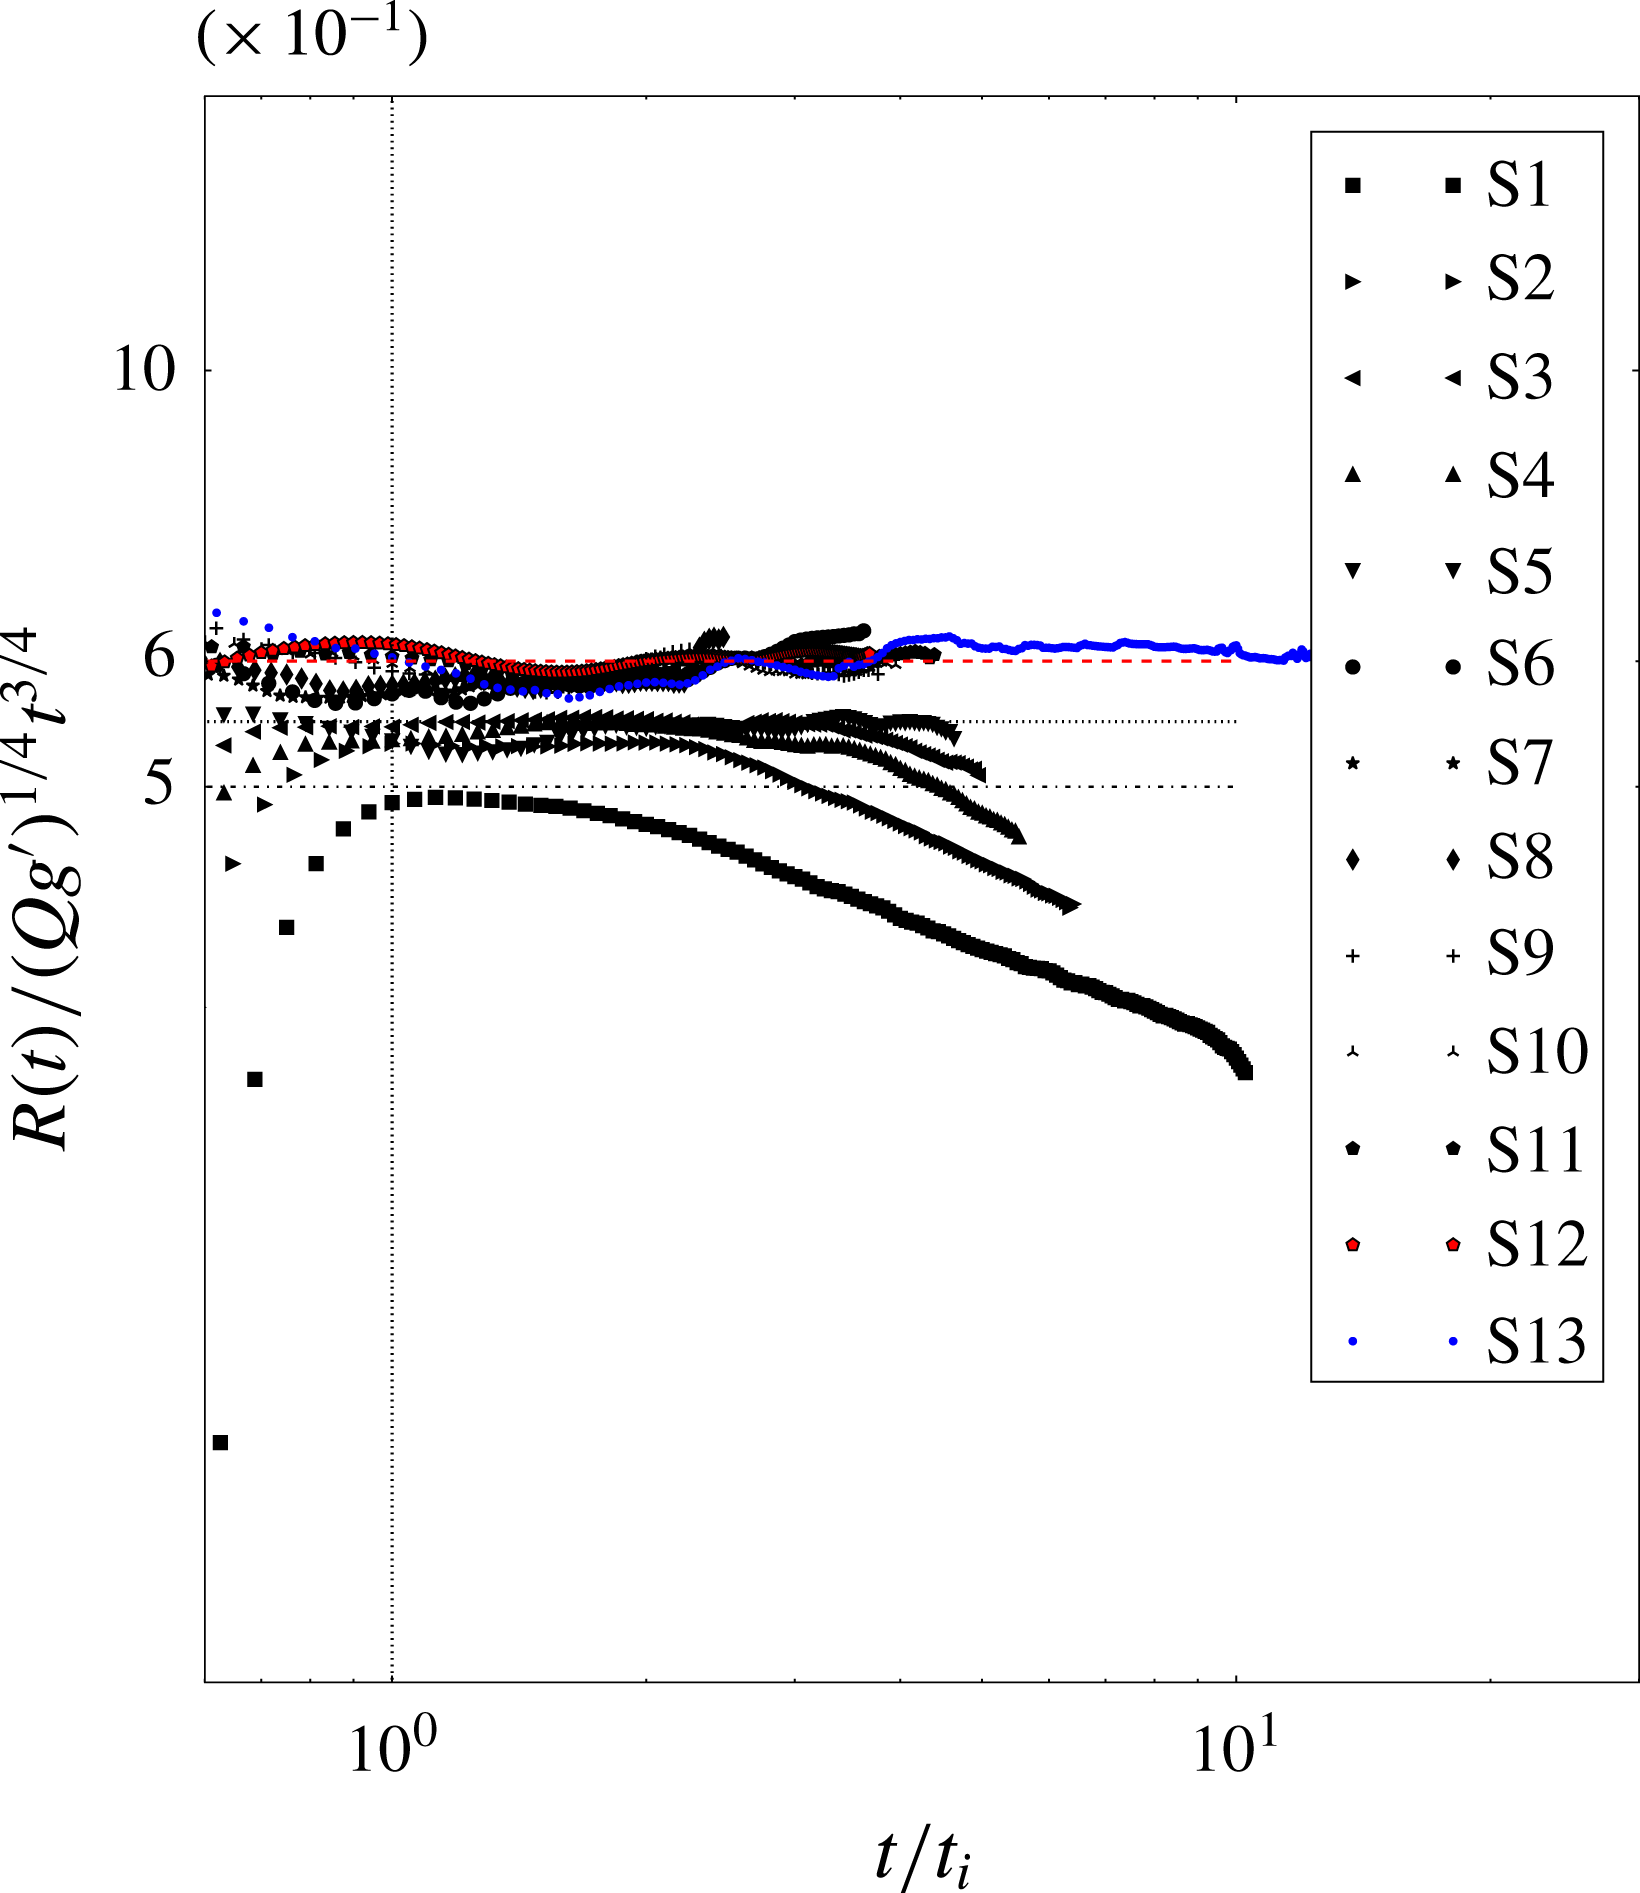
Assuming that the estimate (3.14) holds for axisymmetric constant-flow-rate gravity currents, it is possible to assess the flow rate at the moving symmetry axis indirectly from the differences between
 $\unicode[STIX]{x1D705}_{i}$
,
$\unicode[STIX]{x1D705}_{i}$
,
 $i=1,2,3$
, and
$i=1,2,3$
, and
 $k$
in the following way. The simplest assumption reflecting the kinematics of the problem is then to take
$k$
in the following way. The simplest assumption reflecting the kinematics of the problem is then to take
 $Q=q+q^{\prime }$
, where
$Q=q+q^{\prime }$
, where
 $q$
is the radial part of the flow and
$q$
is the radial part of the flow and
 $q^{\prime }$
is the translating part. In this case,
$q^{\prime }$
is the translating part. In this case,
 $$\begin{eqnarray}\frac{r}{([q+q^{\prime }]g^{\prime })^{1/4}t^{3/4}}=\frac{r}{(qg^{\prime })^{1/4}t^{3/4}[1+\unicode[STIX]{x1D709}]^{1/4}},\end{eqnarray}$$
where
 $\unicode[STIX]{x1D709}=q^{\prime }/q$
. If the estimate (3.14) is correct, then
$\unicode[STIX]{x1D709}=q^{\prime }/q$
. If the estimate (3.14) is correct, then
 $r(qg^{\prime })^{-1/4}t^{-3/4}=\unicode[STIX]{x1D705}=0.84$
, and
$r(qg^{\prime })^{-1/4}t^{-3/4}=\unicode[STIX]{x1D705}=0.84$
, and
 $$\begin{eqnarray}\frac{r}{(qg^{\prime })^{1/4}t^{3/4}[1+\unicode[STIX]{x1D709}]^{1/4}}=\frac{\unicode[STIX]{x1D705}}{[1+\unicode[STIX]{x1D709}]^{1/4}}=\unicode[STIX]{x1D705}_{i}\end{eqnarray}$$
for
 $i=1,2,3$
. This result implies that
$i=1,2,3$
. This result implies that
 $q^{\prime }/q\sim 2.8$
for very low Grashof numbers (i.e. S1 and
$q^{\prime }/q\sim 2.8$
for very low Grashof numbers (i.e. S1 and
 $\unicode[STIX]{x1D705}_{1}$
) and
$\unicode[STIX]{x1D705}_{1}$
) and
 $q^{\prime }/q\sim 1.8$
for intermediate
$q^{\prime }/q\sim 1.8$
for intermediate
 $Gr$
(i.e. S2–S4 and
$Gr$
(i.e. S2–S4 and
 $\unicode[STIX]{x1D705}_{2}$
). In both cases the translating flow would be larger than the radial inflow. Finally, for high
$\unicode[STIX]{x1D705}_{2}$
). In both cases the translating flow would be larger than the radial inflow. Finally, for high
 $Gr$
(S6–S12 and
$Gr$
(S6–S12 and
 $\unicode[STIX]{x1D705}_{3}$
),
$\unicode[STIX]{x1D705}_{3}$
),
 $q^{\prime }/q\sim 1.1$
, and the radial inflow would almost be the same as the translating flow.
$q^{\prime }/q\sim 1.1$
, and the radial inflow would almost be the same as the translating flow.
3.2.6 Viscous–buoyancy equilibrium phase
As predicted from the transition times
 $t_{v}$
in table 2, a viscous–buoyancy phase corresponding to the asymptotic law (1.7) is found only for the low Grashof number cases, i.e. from S1 to S4. In the four cases studied, the value of the Pearson correlation coefficient is above
$t_{v}$
in table 2, a viscous–buoyancy phase corresponding to the asymptotic law (1.7) is found only for the low Grashof number cases, i.e. from S1 to S4. In the four cases studied, the value of the Pearson correlation coefficient is above
 ${\mathcal{R}}^{2}=0.998$
for the least squares fit to (3.8). In the other cases, the external front of the gravity current hits the lateral boundary before or just after entering the viscous–buoyancy regime. The buoyancy–viscous regime is visible in figure 29 after the transition time
${\mathcal{R}}^{2}=0.998$
for the least squares fit to (3.8). In the other cases, the external front of the gravity current hits the lateral boundary before or just after entering the viscous–buoyancy regime. The buoyancy–viscous regime is visible in figure 29 after the transition time
 $t/~t_{v}=1$
, where, as indicated by the horizontal dotted line,
$t/~t_{v}=1$
, where, as indicated by the horizontal dotted line,
 $R_{3}/(e_{f}+g_{f}\sqrt{t})=1$
. Because
$R_{3}/(e_{f}+g_{f}\sqrt{t})=1$
. Because
 $e_{f}$
is small, to relate the expression found (3.8) to the asymptotic law (1.7), it is necessary to express the empirical coefficient
$e_{f}$
is small, to relate the expression found (3.8) to the asymptotic law (1.7), it is necessary to express the empirical coefficient
 $g_{f}$
in terms of
$g_{f}$
in terms of
 $C_{vis}$
, where
$C_{vis}$
, where
 $$\begin{eqnarray}C_{vis}=\left(\frac{g^{\prime }Q^{3}}{\unicode[STIX]{x1D708}}\right)^{1/8}.\end{eqnarray}$$
The relation must hold in all cases considered. It is found by considering the distribution of non-dimensional ratios
 $\unicode[STIX]{x1D706}=g_{f}/C_{vis}$
, as shown in figure 30.
$\unicode[STIX]{x1D706}=g_{f}/C_{vis}$
, as shown in figure 30.
Temporal domain of existence of the viscous–buoyancy regime (3.8): non-dimensional radial front position versus non-dimensional time. Dotted horizontal line indicates
 $R_{3}/(e_{f}+g_{f}\sqrt{t})=1$
.
$R_{3}/(e_{f}+g_{f}\sqrt{t})=1$
.
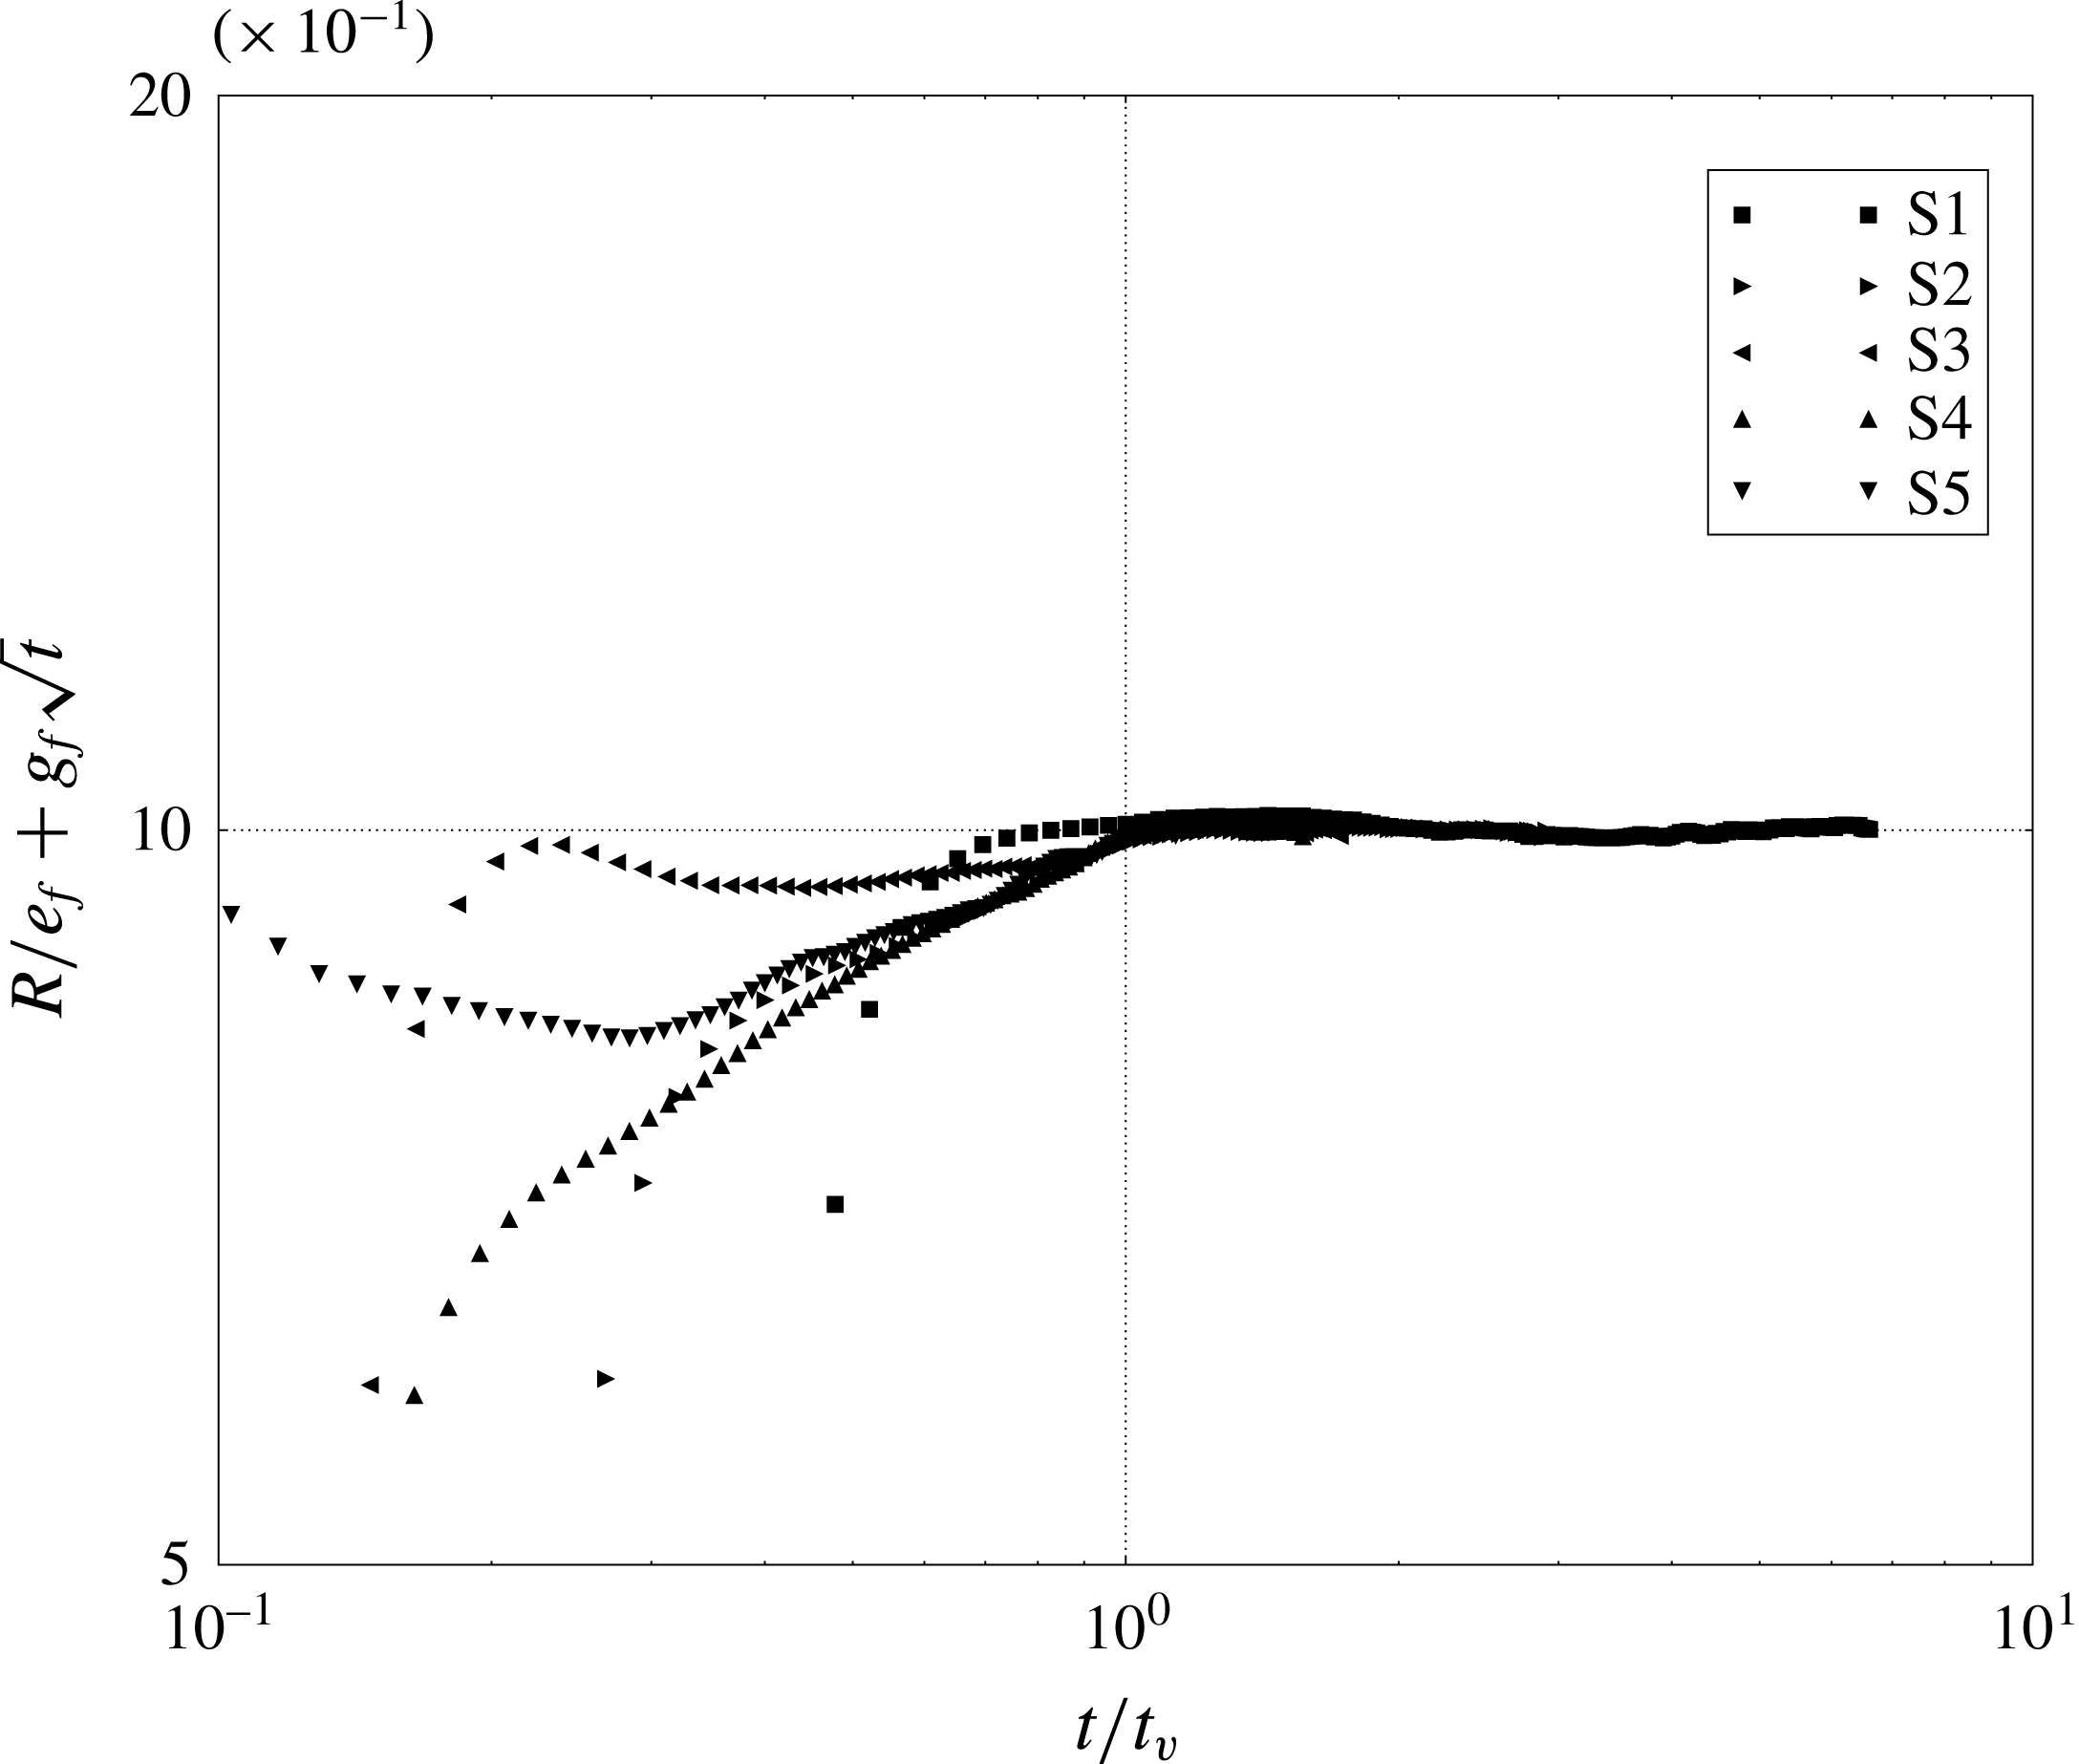
The average ratio
 $\bar{\unicode[STIX]{x1D706}}=\langle g_{f}/C_{vis}\rangle =(0.75\pm 0.07)$
is also shown as a dashed line. The error is taken as the 95 % confidence interval based on the standard deviation of the individual ratios from the mean. The expression (1.7) then becomes
$\bar{\unicode[STIX]{x1D706}}=\langle g_{f}/C_{vis}\rangle =(0.75\pm 0.07)$
is also shown as a dashed line. The error is taken as the 95 % confidence interval based on the standard deviation of the individual ratios from the mean. The expression (1.7) then becomes
 $$\begin{eqnarray}r(t)=\bar{\unicode[STIX]{x1D706}}C_{vis}\sqrt{t}.\end{eqnarray}$$
Distribution of the non-dimensional coefficient
 $\unicode[STIX]{x1D706}$
in the fit (3.8) versus
$\unicode[STIX]{x1D706}$
in the fit (3.8) versus
 $Gr$
, cases S1–S4. Dotted line represents
$Gr$
, cases S1–S4. Dotted line represents
 $\bar{\unicode[STIX]{x1D706}}=\langle g_{f}/C_{vis}\rangle$
.
$\bar{\unicode[STIX]{x1D706}}=\langle g_{f}/C_{vis}\rangle$
.
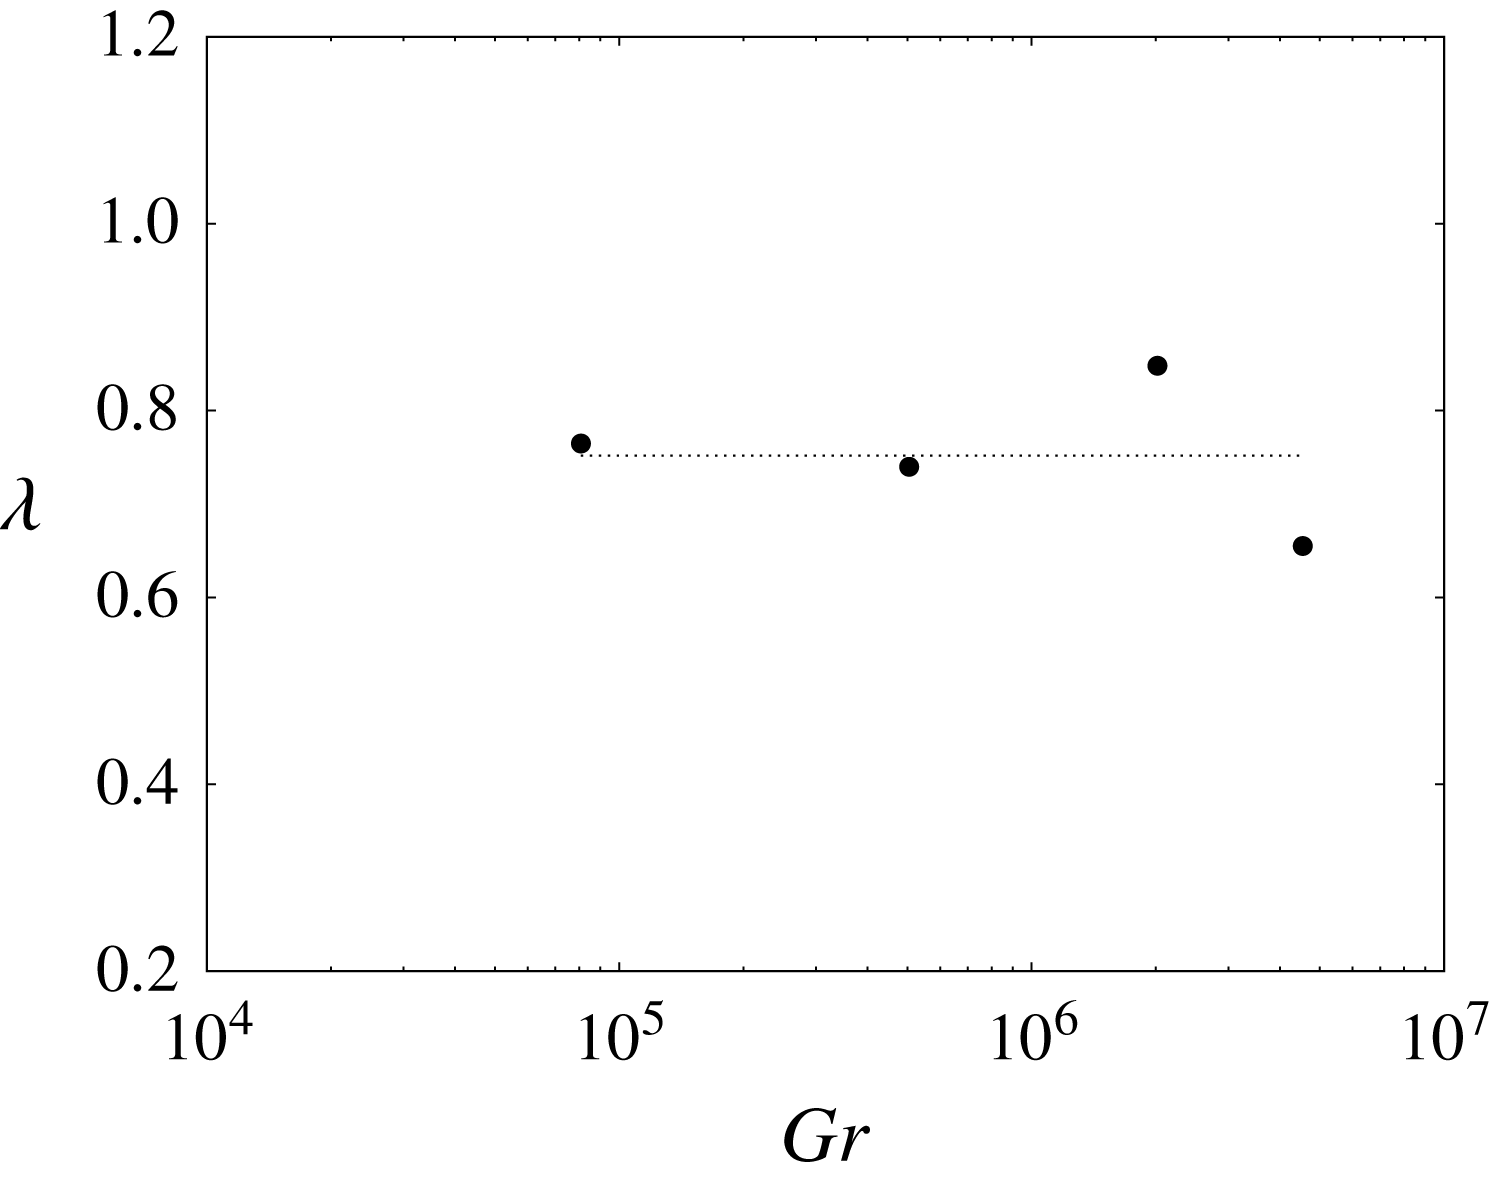
Note that even in the longest time series available, S1, the current remains in the viscous–buoyancy regime for less than the corresponding
 $t_{f}-t_{v}$
, which is a short time to correctly represent the asymptotic viscous regime. In comparison, the experiments of Didden & Maxworthy (Reference Didden and Maxworthy1982), which were conducted in the same range of
$t_{f}-t_{v}$
, which is a short time to correctly represent the asymptotic viscous regime. In comparison, the experiments of Didden & Maxworthy (Reference Didden and Maxworthy1982), which were conducted in the same range of
 $\unicode[STIX]{x1D716}$
but with flow rates at least six times smaller than the volume flow at the gate found in the present study, lasted for more than twenty minutes. Moreover, note that in the final part of the simulation, the flow is close to the wall; thus, the conditions are somewhat different from the case in which the current spreads without the presence of walls. All factors account for the small difference with respect to the value referenced in the literature, which is
$\unicode[STIX]{x1D716}$
but with flow rates at least six times smaller than the volume flow at the gate found in the present study, lasted for more than twenty minutes. Moreover, note that in the final part of the simulation, the flow is close to the wall; thus, the conditions are somewhat different from the case in which the current spreads without the presence of walls. All factors account for the small difference with respect to the value referenced in the literature, which is
 $(0.60\pm 0.02)$
(see Britter Reference Britter1979; Didden & Maxworthy Reference Didden and Maxworthy1982; Huppert Reference Huppert1982).
$(0.60\pm 0.02)$
(see Britter Reference Britter1979; Didden & Maxworthy Reference Didden and Maxworthy1982; Huppert Reference Huppert1982).
4 Conclusions
Lock-exchange, constant-volume three-dimensional gravity currents have been investigated using wall-resolving large eddy simulation for Grashof numbers ranging from
 $Gr=10^{4}$
to almost
$Gr=10^{4}$
to almost
 $Gr=10^{9}$
. The flow configuration is that described in La Rocca et al. (Reference La Rocca, Adduce, Sciortino and Pinzon2008, Reference La Rocca, Adduce, Sciortino, Pinzon and Boniforti2012), Lombardi et al. (Reference Lombardi, Adduce and La Rocca2018) for the case
$Gr=10^{9}$
. The flow configuration is that described in La Rocca et al. (Reference La Rocca, Adduce, Sciortino and Pinzon2008, Reference La Rocca, Adduce, Sciortino, Pinzon and Boniforti2012), Lombardi et al. (Reference Lombardi, Adduce and La Rocca2018) for the case
 $d/2y_{0}=0.1$
.
$d/2y_{0}=0.1$
.
In all cases considered, upon removal of the gate, an initial transient develops in which the flow rate increases up to an asymptotic value. The dimension of the lock volume is large enough to maintain a steady flow rate
 $Q$
during the evolution of the gravity current.
$Q$
during the evolution of the gravity current.
For the geometrical configuration herein investigated, the flow becomes axially symmetric soon after the formation of the current, while the inflow rate at the gate remains reasonably constant throughout all the simulations. A method has been developed to detect the geometrical features of the flow. The method allowed us to show that the frontline shape of the gravity current maintains a circular form, with the centre of the circle translating along the
 $x$
-direction and the radius increasing monotonically in time. The axisymmetric current behaves as being driven by a virtual source at (
$x$
-direction and the radius increasing monotonically in time. The axisymmetric current behaves as being driven by a virtual source at (
 $x_{0}(t)$
,
$x_{0}(t)$
,
 $y_{0}$
) slowly moving in time along the mid-section of the tank.
$y_{0}$
) slowly moving in time along the mid-section of the tank.
Consistently with Grundy & Rottman (Reference Grundy and Rottman1986), Bonnecaze et al. (Reference Bonnecaze, Hallworth, Huppert and Lister1995), the flow is characterised by the presence of hydraulic shocks. The analysis of velocity and density fields indicates the presence of rings as periodic perturbations of the dense flow at sufficiently high
 $Gr$
, i.e. for
$Gr$
, i.e. for
 $Gr\geqslant 2.7\times 10^{8}$
. Isolated shocks are detectable in the range
$Gr\geqslant 2.7\times 10^{8}$
. Isolated shocks are detectable in the range
 $5\times 10^{5}\leqslant Gr\leqslant 2\times 10^{8}$
. In the latter case the structure of the current, characterised by the head of the current being constrained between a forward and a rear shocks is consistent with the model of Garvine (Reference Garvine1984).
$5\times 10^{5}\leqslant Gr\leqslant 2\times 10^{8}$
. In the latter case the structure of the current, characterised by the head of the current being constrained between a forward and a rear shocks is consistent with the model of Garvine (Reference Garvine1984).
Shocks are associated with internal circular jumps (Thorpe & Kavcic Reference Thorpe and Kavcic2008) which are not stationary. The high-velocity structures, present on the supercritical side of the jump are associated with Kelvin–Helmholtz billows. The combined action of hydraulic jumps in the internal core of the current and the mixing action of the Kelvin–Helmholtz instabilities at the top of the current is responsible for the growth of the structures visible in the density fields.
When rings are continuously formed, the number of rings generated in a given time period is a monotonic function of the flow rate, consequently the dimensionless frequency of ring generation
 $\unicode[STIX]{x1D702}$
is nearly independent of
$\unicode[STIX]{x1D702}$
is nearly independent of
 $Gr$
. The estimated value is
$Gr$
. The estimated value is
 $\bar{\unicode[STIX]{x1D702}}=0.48\pm 0.06$
. In the initial stage of development of the flow the rings are generated in the flow region where the frontline was in the inertial regime, and move through the entire body of the current. In some cases they are able to interact with the external front. As the radial spreading of the current exceeds a critical radial distance, most of the rings, which continue to be generated, remain confined inside a circular sector, while the frontal structure continues to advance regularly. Only a few shocks are able to escape and move through the current up to the external frontline.
$\bar{\unicode[STIX]{x1D702}}=0.48\pm 0.06$
. In the initial stage of development of the flow the rings are generated in the flow region where the frontline was in the inertial regime, and move through the entire body of the current. In some cases they are able to interact with the external front. As the radial spreading of the current exceeds a critical radial distance, most of the rings, which continue to be generated, remain confined inside a circular sector, while the frontal structure continues to advance regularly. Only a few shocks are able to escape and move through the current up to the external frontline.
Turbulence effects become evident with the increase of
 $Gr$
and are associated with instabilities in the radial and azimuthal directions. They appear clearly in the perturbation of the axial symmetry of the rings. At low
$Gr$
and are associated with instabilities in the radial and azimuthal directions. They appear clearly in the perturbation of the axial symmetry of the rings. At low
 $Gr$
the radially expanding flow is almost laminar, there are no hydraulic jumps except in the close proximity of the gate. Lobe and cleft at the frontline are unapparent, except in the close proximity of the bottom. At intermediate
$Gr$
the radially expanding flow is almost laminar, there are no hydraulic jumps except in the close proximity of the gate. Lobe and cleft at the frontline are unapparent, except in the close proximity of the bottom. At intermediate
 $Gr$
there are isolated shocks, and the current at the external front shows the presence of azimuthal disturbances in the velocity field related to lobe and cleft instabilities. At high
$Gr$
there are isolated shocks, and the current at the external front shows the presence of azimuthal disturbances in the velocity field related to lobe and cleft instabilities. At high
 $Gr$
the effects of two kinds of instabilities in the azimuthal direction are clearly visible: one is the lobe and cleft instability at the front of the current, the other one is the progressive deformation of the axial symmetry of the vortex rings. The Froude number analysis shows that in cases of low
$Gr$
the effects of two kinds of instabilities in the azimuthal direction are clearly visible: one is the lobe and cleft instability at the front of the current, the other one is the progressive deformation of the axial symmetry of the vortex rings. The Froude number analysis shows that in cases of low
 $Gr$
the flow is subcritical at all times in all the tank, except for a small ring near the gate. The experiments of Britter (Reference Britter1979) also suggest that if the rate of volume flow is low the axially symmetric flows do not exhibit shocks during the entire evolution of the current. The present results indicate that, indeed, the non-dimensional volume flow
$Gr$
the flow is subcritical at all times in all the tank, except for a small ring near the gate. The experiments of Britter (Reference Britter1979) also suggest that if the rate of volume flow is low the axially symmetric flows do not exhibit shocks during the entire evolution of the current. The present results indicate that, indeed, the non-dimensional volume flow
 $Q$
may be the critical parameter. In fact, in the range of
$Q$
may be the critical parameter. In fact, in the range of
 $Gr=[2{-}8]\times 10^{8}$
, i.e. cases S6–S11, it is always
$Gr=[2{-}8]\times 10^{8}$
, i.e. cases S6–S11, it is always
 $Q/U_{s}H^{2}\sim 0.18$
, but when
$Q/U_{s}H^{2}\sim 0.18$
, but when
 $Gr=[1{-}5]\times 10^{5}$
, i.e. for cases S1 and S2, then
$Gr=[1{-}5]\times 10^{5}$
, i.e. for cases S1 and S2, then
 $Q/U_{s}H^{2}$
is between 0.16 and 0.17.
$Q/U_{s}H^{2}$
is between 0.16 and 0.17.
Considering the purely axially symmetric part of the gravity current, three distinct spreading regimes are found: slumping, inertial and viscous. These regimes are quite similar in nature to those studied in the case of constant-volume axisymmetric gravity current but follow the characteristic scaling laws for constant-flow-rate sources.
An analytical expression for the slumping, which is derived from an extension of the box model of Huppert & Simpson (Reference Huppert and Simpson1980) to the case of a constant-inflow axisymmetric current, is found to fit the initial part of the spreading in all cases. The slumping phase starts just before or right at the time
 $t_{0}$
for which the flow rate at the gate
$t_{0}$
for which the flow rate at the gate
 $Q$
becomes steady. The duration of the slumping depends on the buoyancy acceleration at the gate, and the non-dimensional duration is a linear function of the Froude number at the gate. However, this phase is very short at small Grashof numbers. The presence of the slumping phase reconciles the spreading model of Garvine (Reference Garvine1984) with the expected asymptotic law obtained from the inertial–buoyancy regime equation and the results of Chen (Reference Chen1980).
$Q$
becomes steady. The duration of the slumping depends on the buoyancy acceleration at the gate, and the non-dimensional duration is a linear function of the Froude number at the gate. However, this phase is very short at small Grashof numbers. The presence of the slumping phase reconciles the spreading model of Garvine (Reference Garvine1984) with the expected asymptotic law obtained from the inertial–buoyancy regime equation and the results of Chen (Reference Chen1980).
The presence of an inertial regime following the asymptotic law (1.6) is detected in all cases. The expression found,
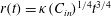 $r(t)=\unicode[STIX]{x1D705}(C_{in})^{1/4}t^{3/4}$
, is consistent with the elementary scaling laws of Chen (Reference Chen1980) and the results from the laboratory experiments of Britter (Reference Britter1979). The confidence interval obtained here for the numerical coefficient in the expression for the buoyancy–inertial dynamical equilibrium regime is slightly larger than that obtained by Britter (Reference Britter1979) due to the use of the flow rate at the gate,
$r(t)=\unicode[STIX]{x1D705}(C_{in})^{1/4}t^{3/4}$
, is consistent with the elementary scaling laws of Chen (Reference Chen1980) and the results from the laboratory experiments of Britter (Reference Britter1979). The confidence interval obtained here for the numerical coefficient in the expression for the buoyancy–inertial dynamical equilibrium regime is slightly larger than that obtained by Britter (Reference Britter1979) due to the use of the flow rate at the gate,
 $Q$
, in the parameter
$Q$
, in the parameter
 $C_{in}$
rather than the true inflow source at the symmetry axis
$C_{in}$
rather than the true inflow source at the symmetry axis
 $(x_{c}(t),z_{0})$
.
$(x_{c}(t),z_{0})$
.
The viscous–buoyancy regime, as predicted by Huppert (Reference Huppert1982), is also detected in the cases with lower Grashof numbers, with the front propagation expressed as
 $r(t)=\bar{\unicode[STIX]{x1D706}}C_{vis}\sqrt{t}$
. The agreement with the theory is satisfactory given that only a part of the viscous–buoyancy regime could be simulated in the present domain.
$r(t)=\bar{\unicode[STIX]{x1D706}}C_{vis}\sqrt{t}$
. The agreement with the theory is satisfactory given that only a part of the viscous–buoyancy regime could be simulated in the present domain.
Acknowledgements
The authors, particularly C.A. as PI, acknowledge PRACE for awarding access to the resources: MareNostrum, based in Spain at the Barcelona Supercomputing Centre, and Galileo, based in Italy at Cineca. The support of John Donners from SurfSara, Netherlands, for the technical work is gratefully acknowledged.
Appendix A. Frontal expansion in the slumping phase
In the original box model formulation of Huppert & Simpson (Reference Huppert and Simpson1980), which accounts for both the slumping and the inertial–buoyancy regimes, the initial geometry is a circular cylinder of dense fluid with height
 $H$
and radius
$H$
and radius
 $R_{0}$
separated from a less dense ambient fluid by a removable wall. At the beginning of the simulation, all the walls that bound the dense fluid are removed, and the current expands in the radial direction. The analytical expression for the front position in time is based on the assumption that the volume of the gravity current does not change in time and that the velocity of the front in terms of the Froude number at the head of the current
$R_{0}$
separated from a less dense ambient fluid by a removable wall. At the beginning of the simulation, all the walls that bound the dense fluid are removed, and the current expands in the radial direction. The analytical expression for the front position in time is based on the assumption that the volume of the gravity current does not change in time and that the velocity of the front in terms of the Froude number at the head of the current
 $Fr={\dot{R}}/\sqrt{g^{\prime }h}$
depends only on the ratio
$Fr={\dot{R}}/\sqrt{g^{\prime }h}$
depends only on the ratio
 $\unicode[STIX]{x1D719}=h/H$
, based on Britter (Reference Britter1979), as
$\unicode[STIX]{x1D719}=h/H$
, based on Britter (Reference Britter1979), as
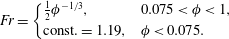 $$\begin{eqnarray}Fr=\left\{\begin{array}{@{}ll@{}}\frac{1}{2}\unicode[STIX]{x1D719}^{-1/3}, & 0.075<\unicode[STIX]{x1D719}<1,\\ \text{const.}=1.19, & \unicode[STIX]{x1D719}<0.075.\end{array}\right.\end{eqnarray}$$
The first case is observed when the current depth is still comparable with the total depth of the fluid, and the second is valid when the current has a depth that is considerably smaller than the total depth of the fluid (see also Marino, Thomas & Linden Reference Marino, Thomas and Linden2005). It is relatively straightforward to derive a ‘slumping box model’ with the constant-flow-rate assumption in place of the hypothesis of constant flow volume. Indeed, assuming that the initial current is close to axisymmetric, the assumption
 $Qt=\unicode[STIX]{x03C0}r^{2}h$
may be used to obtain a first guess of
$Qt=\unicode[STIX]{x03C0}r^{2}h$
may be used to obtain a first guess of
 $h$
to use in
$h$
to use in
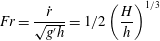 $$\begin{eqnarray}Fr=\frac{{\dot{r}}}{\sqrt{g^{\prime }h}}=1/2\left(\frac{H}{h}\right)^{1/3}\end{eqnarray}$$
i.e.
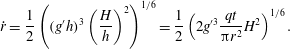 $$\begin{eqnarray}{\dot{r}}=\frac{1}{2}\left((g^{\prime }h)^{3}\left(\frac{H}{h}\right)^{2}\right)^{1/6}=\frac{1}{2}\left(2g^{\prime 3}\frac{qt}{\unicode[STIX]{x03C0}r^{2}}H^{2}\right)^{1/6}.\end{eqnarray}$$
Separating the variables
 $r$
and
$r$
and
 $t$
, the differential equation is easily solved by separating variables, after which
$t$
, the differential equation is easily solved by separating variables, after which
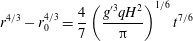 $$\begin{eqnarray}r^{4/3}-r_{0}^{4/3}=\frac{4}{7}\left(\frac{g^{\prime 3}qH^{2}}{\unicode[STIX]{x03C0}}\right)^{1/6}t^{7/6}\end{eqnarray}$$
or equivalently,
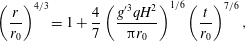 $$\begin{eqnarray}\left(\frac{r}{r_{0}}\right)^{4/3}=1+\frac{4}{7}\left(\frac{g^{\prime 3}qH^{2}}{\unicode[STIX]{x03C0}r_{0}}\right)^{1/6}\left(\frac{t}{r_{0}}\right)^{7/6},\end{eqnarray}$$
when
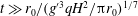 $t\gg r_{0}/(g^{\prime 3}qH^{2}/\unicode[STIX]{x03C0}r_{0})^{1/7}$
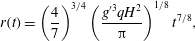 $$\begin{eqnarray}r(t)=\left(\frac{4}{7}\right)^{3/4}\left(\frac{g^{\prime 3}qH^{2}}{\unicode[STIX]{x03C0}}\right)^{1/8}t^{7/8},\end{eqnarray}$$
which is incidentally not far from the expression found by Garvine (Reference Garvine1984).
To evaluate the transition time
 $t_{i}$
when the
$t_{i}$
when the
 $Fr$
number becomes constant, when
$Fr$
number becomes constant, when
 $t\rightarrow t_{i}$
,
$t\rightarrow t_{i}$
,
 $\unicode[STIX]{x1D719}\rightarrow \unicode[STIX]{x1D719}_{0}=0.075=h/H=Qt_{i}/\unicode[STIX]{x03C0}r_{s}^{2}H$
, such that
$\unicode[STIX]{x1D719}\rightarrow \unicode[STIX]{x1D719}_{0}=0.075=h/H=Qt_{i}/\unicode[STIX]{x03C0}r_{s}^{2}H$
, such that
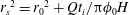 ${r_{s}}^{2}={r_{0}}^{2}+Qt_{i}/\unicode[STIX]{x03C0}\unicode[STIX]{x1D719}_{0}H$
and
${r_{s}}^{2}={r_{0}}^{2}+Qt_{i}/\unicode[STIX]{x03C0}\unicode[STIX]{x1D719}_{0}H$
and
 $$\begin{eqnarray}\left[{r_{0}}^{2}+\frac{Qt_{i}}{\unicode[STIX]{x03C0}\unicode[STIX]{x1D719}_{0}H}\right]^{2/3}-{r_{0}}^{4/3}=\frac{4}{7}C_{sl}^{1/6}t^{7/6}\end{eqnarray}$$
i.e.
 $$\begin{eqnarray}\left(\frac{Qt_{i}}{\unicode[STIX]{x03C0}\unicode[STIX]{x1D719}_{0}{r_{0}}^{2}H}\right)^{2/3}\left[1+\frac{\unicode[STIX]{x03C0}\unicode[STIX]{x1D719}_{0}{r_{0}}^{2}H}{Qt_{i}}\right]^{2/3}-{r_{0}}^{4/3}=\frac{4}{7}C_{sl}^{1/6}t_{i}^{7/6}.\end{eqnarray}$$
Since
 $(2/3(\unicode[STIX]{x03C0}\unicode[STIX]{x1D719}_{0}H/Qt_{i}))^{5/3}\gg {r_{0}}^{2/3}$
 $$\begin{eqnarray}\left(\frac{Qt_{i}}{\unicode[STIX]{x03C0}\unicode[STIX]{x1D719}_{0}H}\right)^{2/3}=\frac{4}{7}C_{sl}^{1/6}t_{i}^{7/6}\end{eqnarray}$$
hence,
 $$\begin{eqnarray}t_{i}^{1/2}=7/4\left(\frac{Q}{\unicode[STIX]{x03C0}\unicode[STIX]{x1D719}_{0}H}\right)^{1/2}\frac{\unicode[STIX]{x03C0}}{Q{g^{\prime }}^{3}H^{2}}\end{eqnarray}$$
or,
 $$\begin{eqnarray}t_{i}=\left(\frac{7}{4\unicode[STIX]{x1D719}_{0}^{2/3}}\right)^{2}\frac{Q}{\unicode[STIX]{x03C0}g^{\prime }H^{2}}.\end{eqnarray}$$


 Open access