


Selenium (Se) content in commercial feeds for salmonids has been reported to decrease in recent years(Reference Sissener, Julshamn and Espe1–Reference Antony Jesu Prabhu, Kaushik and Mariojouls4). This is a result of the ongoing reduction of fishmeal as the major Se source in such diets possibly needing Se supplements in order to meet the requirement of fish(5–Reference Antony Jesu Prabhu, Holen and Espe7). We have recently demonstrated that in a fishmeal-free rainbow trout broodstock diet, Se supplementation can improve reproductive performance, while inducing short-term positive effects in the Se status and antioxidant system of the progeny with increased glutathione peroxidase activity(Reference Wischhusen, Parailloux and Geraert8). On the other hand, these fry presented lower total body glutathione (GSH) levels leading to the hypothesis that parental Se might relate to epigenetic modifications at early stages possibly reflecting a phenomenon known as nutritional programming(Reference Gabory, Attig and Junien9). In a follow-up study, it was confirmed that in the progeny even after the beginning of exogenous feeding, parental Se supplementation decreased the expression of genes related to the GSH metabolism such as GSH peroxidase and GSH reductase(Reference Wischhusen, Larroquet and Durand10). This effect was especially strong after the fish were exposed to a hypoxic stress, which has been associated with an increase in cellular production of reactive oxygen species and oxidative stress levels in fish(Reference Leveelahti, Rytkönen and Renshaw11,Reference Mansfield, Simon and Keith12) . It raised the question, if modifications as observed in relation to the antioxidant and glutathione systems also relate to changes in the one-carbon (1C) metabolism.
The 1C metabolism is a term used to describe three closely linked metabolic pathways(Reference Anderson, Sant and Dolinoy13). The folate metabolism is a cyclic pathway, where one-carbon units from serine or glycine are transferred to tetrahydrofolate to form methyl-tetrahydrofolate, which is used in methionine (Met) metabolism to methylate homocysteine (Hcys) to Met for the deposition in proteins, constituting the body mass, or to produce S-adenosylmethionine (SAM), a general donor of methyl groups. Demethylation of SAM results in S-adenosylhomocysteine (SAH), which is further metabolised to Hcys. Hcys can either remain in the Met cycle by re-methylation to Met or is metabolised via the transsulphuration pathway. In the transsulphuration pathway, Hcys is transformed in cysteine that accounts for the majority of the GSH production(Reference Mosharov, Cranford and Banerjee14).
The metabolic pathway of dietary Se components is in close link to the 1C metabolism(Reference Daniels15). Similar to its sulphur counterpart, selenomethionine (SeMet) can be demethylated to seleno-homocysteine and metabolised through the transsulphuration pathway to form selenocysteine for further reduction to selenide and final translation into selenoproteins. Inorganic Se can be directly reduced to selenide(Reference Burk and Hill16). Although only SeMet is metabolised by transsulphuration enzymes, both organic and inorganic Se supplementation have been reported to modify the activity of enzymes of the Hcys metabolism(Reference Davis, Uthus and Finley17–Reference Uthus and Ross19). Changes in betaine-homocysteine S-methyltransferase (BHMT), cystathionine beta-synthase (CBS) and glutamate–cysteine ligase (CGL) by Se supplementation resulted in an increased Hcys flux through the transsulphuration pathway and reduced re-methylation. Possibly, such modifications relate to cellular differences in the cellular redox status caused by Se as the Hcys metabolism was shown to be redox-sensitive in vitro in human hepatic cell lines as well as in vivo in mouse liver where BHMT activity was reduced in the presence of oxidants such as reactive oxygen species, but the activity of transsulphuration enzymes increased(Reference Mosharov, Cranford and Banerjee14,Reference Castro, Millian and Garrow20) . In this context, the redox sensitivity of the transsulphuration pathway presented a feedback mechanism to produce GSH, the major cellular redox molecule.
On this basis, we wanted to evaluate in rainbow trout, if the inorganic and organic forms of Se supplementation in broodstock diets, in combination with cross-feeding of the progeny, might cause long-term modifications influencing the activity of the 1C metabolism. Furthermore, the progenies were subjected to a hypoxic stress challenge to evaluate the interaction between Se supplementation and the active regulation of 1C metabolism through changes in the cellular redox status.
Materials and methods
Experimental diets
Diets were prepared for broodstock and progeny from first feeding onwards using a twin-screw extruder at the INRAE experimental facilities(Reference Wischhusen, Parailloux and Geraert8,Reference Wischhusen, Larroquet and Durand10) . The isoprotein and isoenergetic diets were based on plant-derived protein (50 % crude protein and 22 % total lipid) and differed only in Se content (Table 1). The negative control diet without any additional Se supplementation had a basal Se level of 0·3 µg/g in broodstock (Bnc) and fry (Fnc) according to Se analysis (Section Selenium and metabolite analysis). The diets supplemented with 0·3 µg/g inorganic sodium selenite gave a final dietary Se content of 0·8 µg/g in broodstock (Bss) and 0·5 µg/g in fry (Fss). Similarly, diets were supplemented with organic hydroxy-selenomethionine (OH-SeMet), a purified feed supplement of SeMet, resulting in a final Se concentration of 0·7 µg/g in the broodstock diet (Bso) and 0·6 µg/g in the corresponding fry diet (Fso).
Formulation and composition of experimental diets (g/100 g dry weight)
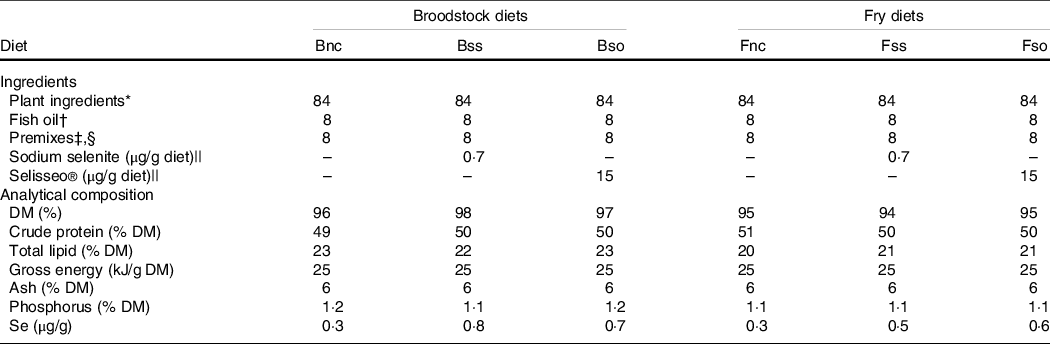
* Plant ingredients (% diet): 20 % wheat gluten (Roquette), 18 % corn gluten meal (Inzo), 15 % soyabean protein concentrate Estril®75 (Sopropêche), 6 % soyabean meal (Sud-Ouest Aliment), 5 % rapeseed meal 00 (Sud-Ouest Aliment), 5 % white lupin meal Farilup 500 (Terrena), 3 % dehulled pea meal Primatex (Sotexpro), 2 % whole wheat (Sud-Ouest Aliment), 2 % soyabean lecithin (Louis François), 4 % rapeseed oil (Daudry), 2·4 % linseed oil (Daudry) and 1·6 % palm oil (Daudry).
† Fish oil from Sopropêche.
‡ Premixes (per kg diet): l-lysine, 13·4 g; dl-methionine, 3 g; glucosamine, 5 g; taurine, 3 g; betaine, 3 g; glycine, 2 g; alanine, 2 g; retinol acetate, 55 000 IU; cholecalciferol, 2500 IU; dl-α-tocopherol acetate, 50 IU; sodium menadione bisulfite, 10 mg; thiamin-HCl, 1 mg; riboflavin, 4 mg; niacin, 10 mg; d-calcium pantothenate, 20 mg; pyridoxine-HCl, 3 mg; d-biotin, 0·2 mg; folic acid, 1 mg; cyanocobalamin, 10 µg; l-ascorbyl-2-polyphosphate, 50 mg; myo-inositol, 0·3 g; choline, 1 g; CaHPO4·2H2O, 33 g; CaCo3, 2·15 g; Mg(OH)2, 1·24 g; KCl, 0·9 g; NaCl, 0·4 g; FeSO4·7H2O, 0·2 g; ZnSO4·7H2O, 40 mg; MnSO4·H2O, 30 mg; CuSO4·5H2O, 30 mg; NaF, 10 mg; KI, 0·4 mg; CoCl2·6H2O, 0·2 mg. All ingredients were diluted with α-cellulose.
§ Broodstock dietary premixes also contained 40 mg astaxanthin/kg diet supplied as Carophyll pink® (DSM).
|| Sodium selenite contained 46 % Se (Sigma-Aldrich) and Selisseo contained 2 % Se (Adisseo).
Experimental design
All procedures were performed in compliance with the European Directive 2010/63/EU for the protection of animals used for scientific purposes and the French Decree no. 2013-118 for animal experimentation by trained personnel at the INRAE experimental fish farm in Donzacq.
The progenies of three broodstock groups (Bnc, Bss and Bso) consisting of twenty-five females and fifteen males, fed the experimental diets for 6 months prior to spawning (second reproduction season), were used in this feeding trial(Reference Wischhusen, Parailloux and Geraert8). The 3-year-old broodstock fish readily accepted the experimental diets, and no differences in growth performance between groups of females nor males were noticed. At swim-up fry stage, the pooled offspring from each of the three parental groups were randomly sub-divided into three fry feeding groups (Fnc, Fss and Fso) resulting in nine dietary treatments. Each group of fry was allocated to triplicate 50 litre fiberglass tanks with 250 fish per tank (n 27 tanks) supplied with flow-through spring water at a dissolved oxygen concentration of 9·2 (sem 0·1) mg/l and at a temperature of 17·5 (sem 0·5)°C. The fry were hand-fed six times daily during the first 3 weeks of the trial and four times daily afterwards to apparent satiation without any significant differences in growth performance between groups(Reference Wischhusen, Larroquet and Durand10).
At the end of the 11-week feeding period (average final body weight: 4·6 (sem 0·1) g), the fish were either sampled or subjected to a hypoxic stress challenge as previously described(Reference Wischhusen, Larroquet and Durand10). Shortly, 100 fish from each group were transferred to a tank containing water with low dissolved oxygen of 1·7 (sem 0·2) mg/l. When the fish started to show signs of discomfort, they were transferred back in tanks with normally oxygenated water for recovery until the termination of the stress challenge after 30 min, when all stressed fish were pooled and sampled by tank. Fish sampled before and after the stress were killed with an overdose of benzocaine and frozen as whole fish in liquid N2 for storage at −80°C until further analysis.
Gene expression
The mRNA was extracted from three randomly chosen individual fry per tank (=nine individuals per dietary treatment) and analysed by high-throughput qRT-PCR at the Genotoul Platform (http://genomique.genotoul.fr/) using the BioMark® 96:96 Dynamic Array (Fluidigm Corporation) as previously described(Reference Wischhusen, Larroquet and Durand10). The primer sequences are given in Table 2. Relative expression of the target genes was calculated at a geometric mean of the housekeeping genes eukaryotic translation elongation factor 1α (ef1α) and β-actin and a control originating from parents fed Bnc that also received the fry control diet Fnc (BncFnc) sampled before the stress challenge by the ΔΔCT method(Reference Pfaffl21).
Oligonucleotide primers used to assay mRNA levels by Fluidigm PCR
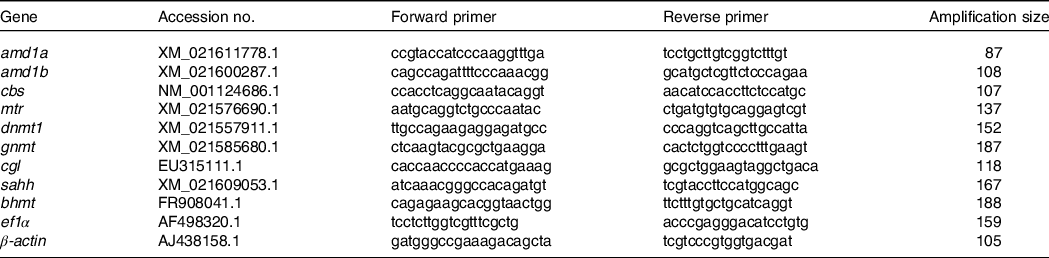
amd1, adenosylmethionine decarboxylase 1; cbs, cystathionine beta-synthase; mtr, methionine synthase; dnmt1, DNA methyltransferase 1; gnmt, glycine N-methyltransferase; cgl, cystathionine γ-lyase; sahh, adenosylhomocysteinase; bhmt, betaine-homocysteine S-methyltransferase; ef1α, eukaryotic translation elongation factor 1α.
Selenium and metabolite analysis
Total Se was determined in homogenised fry and diets using inductively coupled plasma MS (ICP-MS, Agilent series 7500cx) by Ultra Trace Analysis Aquitaine (UT2A) according to Vacchina & Dumont(Reference Vacchina and Dumont22). Three individual frozen fish per tank were dissected for a pool of 100 mg fillet after removal of skin at the left side above the lateral line to be analysed for free amino acids and other N-metabolites using the Biochrome Analyzer and post-column ninhydrin reaction following deproteinisation as previously described(Reference Espe, Lemme and Petri23). Extraction and analysis of the aminothiols Hcys, cysteine, γ-glutamylcysteine, GSH and cysteinyl-glycine as well as SAM and SAH were done by HPLC on 300 mg homogenised whole-body fry as previously described(Reference Wischhusen, Saito and Heraud24). Pyridoxine, pyridoxal and pyridoxamine were measured by ultraperformance LC(Reference Albrektsen, Waagbø and Lie25). Vitamin B12 and folate were analysed microbiologically(Reference Mæland, Rønnestad and Fyhn26) using Lactobacillus delbrueckii spp. Lactis and Lactobacillus rhamnosus, respectively.
Statistical analysis
Results are given as mean values with their standard errors. Statistical analysis was performed using statistical software R (R Development Core Team, 2008). The sample size was determined using power analysis (R: pwr2, version 1.0) with a medium expected effect size for gene expression data (n 27) and a large expected effect size for other parameters (n 9) based on previous studies(Reference Wischhusen, Larroquet and Durand10). The statistical power was set to a minimum of 80 % at a significance level of P < 0·05 in all analyses. Data were tested for homogeneity and normal distribution resulting in rank transformation of gene expression data before further analysis. In the free amino acid data, one sample of the BssFss treatment collected before stress was identified as a systematic outlier using box plots and principal component analysis and was subsequently removed from the statistical analysis. Parental, direct feeding and stress effects were analysed using three-way ANOVA, but no significant interactions between parental or direct feeding and the hypoxic stress were detected. Therefore, data were finally analysed using two-way ANOVA for direct and parental effects and one-way ANOVA to test the effect of hypoxic stress. A Tukey’s HSD was used as a post hoc test.
Results
Selenium and aminothiol concentrations
After 11 weeks of feeding, body Se concentrations were not significantly different according to parental Se feeding in fry sampled before the hypoxic stress (Table 3). However, the concentrations of cysteine, cysteinyl-glycine, γ-glutamylcysteine and GSH were significantly higher, when originating from parental groups fed Bso compared with fry originating from the Bnc treatment. Cysteinyl-glycine and GSH were additionally higher in the group originating from parents fed the Bss compared with Bnc. No parental effect was detected for Hcys. Total Se levels were elevated in body of fry fed Se-supplemented diets with highest concentrations when fed Fso. On the other hand, none of the aminothiols showed any significant difference according to the direct feeding of Se-supplemented diets. All analysed aminothiol concentrations decreased during the hypoxic stress challenge. In stressed fry, no significant differences according to parental Se or dietary Se supplementation were detectable. The significant interaction observed for Cysteinyl-glycine was due to a lower content in BssFso fry compared with BssFnc fry.
Total Se and aminothiol concentrations (µg/g sample) measured in whole fry originating from parents subjected to different Se treatments (Bnc, Bss and Bso) and then fed diets containing different levels and sources of Se (Fnc, Fss and Fso) before and after exposed to hypoxic stress
(Mean values with their standard errors, n 9 for fed and stressed fry and n 27 for fed v. stressed fry)
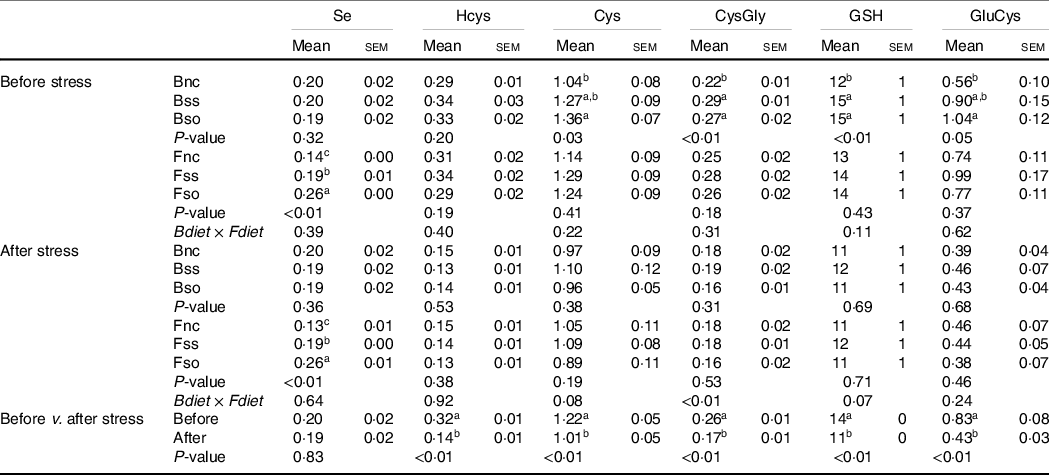
Se, selenium; Hcys, homocysteine; Cys, cysteine; CysGly, cysteinyl-glycine; GluCys, γ-glutamyl-cysteine.
a,b,c Mean values within a column or group with unlike superscript letters were significantly different according to one- or two-way ANOVA followed by Tukey HSD.
B vitamin levels
Vitamin B6, folate or vitamin B12 was not significantly affected by parental or direct feeding of Se-supplemented diets, whether before or after stress (Table 4). Pyridoxine and pyridoxamine as well as folate decreased significantly in stressed fish, while vitamin B12 concentrations remained stable.
Concentration of B vitamins (µg/kg fresh weight) measured in whole fry originating from parents subjected to different Se treatments (Bnc, Bss and Bso) and then fed diets containing different levels and sources of Se (Fnc, Fss and Fso) before and after exposed to hypoxic stress
(Mean values with their standard errors, n 9 for fed and stressed fry and n 27 for fed v. stressed fry)

a,b Mean values within a column or group with unlike superscript letters were significantly different according to one- or two-way ANOVA followed by Tukey HSD.
S-adenosylmethionine and S-adenosylhomocysteine contents
SAM and SAH concentrations were not significantly affected by parental or direct feeding of Se-supplemented diets, whether before or after stress (Table 5). The SAM:SAH ratio was decreased in fry by the hypoxic stress challenge due to a significant decrease of SAM.
S-adenosylmethionine (SAM) and S-adenosylhomocysteine (SAH) (nmol/g sample) measured in whole fry originating from parents subjected to different Se treatments (Bnc, Bss and Bso) and then fed diets containing different levels and sources of Se (Fnc, Fss and Fso) before and after exposed to hypoxic stress
(Mean values with their standard errors of the mean, n 9 for fed and stressed fry and n 27 for fed v. stressed fry)
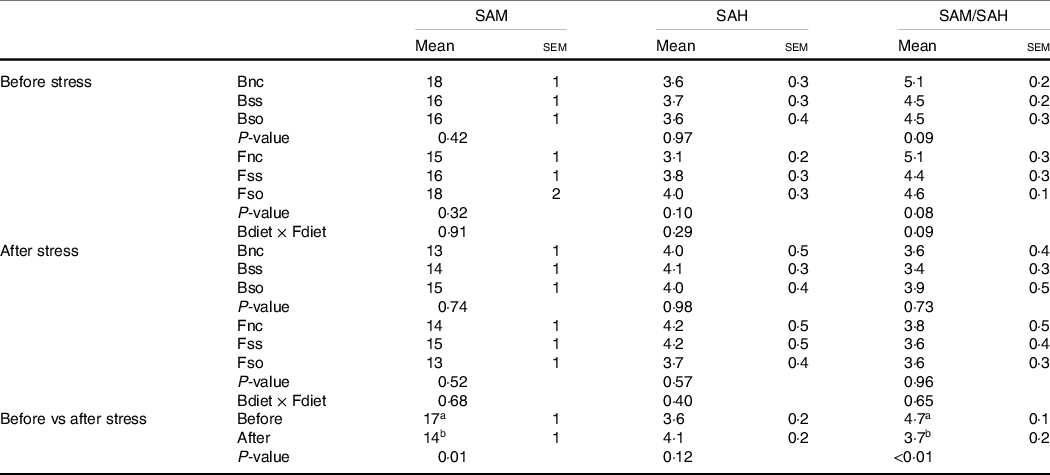
a,bMean values within a column or group with unlike superscript letters were significantly different according to one- or two-way ANOVA followed by Tukey HSD.
Gene expression
Pre-stress, the expression of most of the analysed genes was not significantly affected by parental or direct feeding of Se-supplemented diets (Table 6). However, cgl mRNA levels were significantly lower in fry fed the Se-supplemented diets compared with fry fed Fnc. In addition, an interactive effect was detected for bhmt, which was especially reduced in fry fed OH-SeMet (Fso), when originating from parents fed Se-supplemented diets (Bss or Bso) (Fig. 1(a)).
Relative gene expression of one-carbon (1C) genes in whole fry originating from parents subjected to different Se treatments (Bnc, Bss and Bso) and then fed diets containing different levels and sources of Se (Fnc, Fss and Fso) before and after exposed to hypoxic stress
(Mean values with their standard errors, n 27)
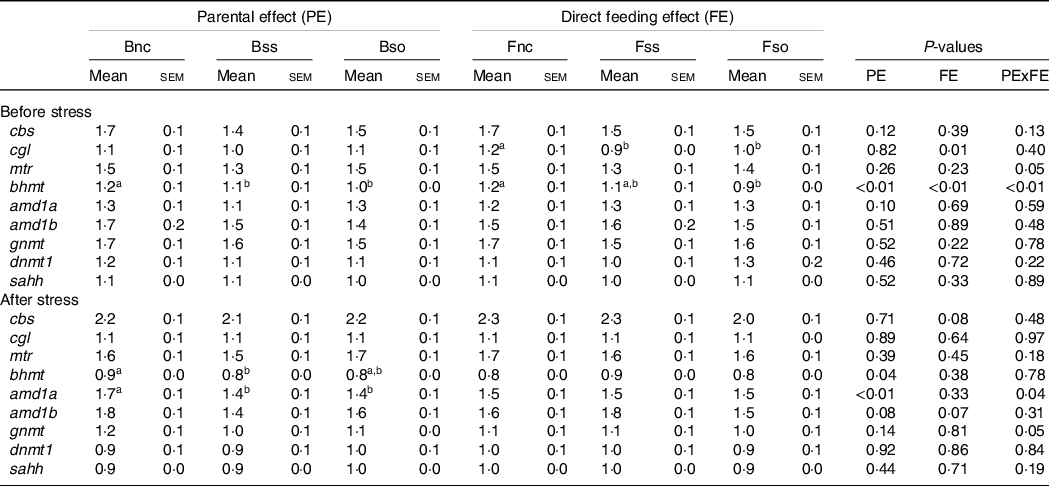
a,b Mean values within a column or group with unlike superscript letters were significantly different according to two-way ANOVA followed by Tukey HSD.
Interactive effect of parental and dietary Se supplementation on the relative expression of ![]() bhmt in fry before stress (a) and
bhmt in fry before stress (a) and ![]() gnmt and
gnmt and ![]() amd1a in stressed fry (b). Gene expression was normalized to β-actin and ef1α and expressed as fold-changes of mRNA abundance compared to a sample of fry from the BncFnc treatment before stress. Bars represent mean values with their standard errors of the mean (n 9). Means not sharing a common superscript letter are significant different according to two-way ANOVA followed by Tukey’s HSD post hoc test.
amd1a in stressed fry (b). Gene expression was normalized to β-actin and ef1α and expressed as fold-changes of mRNA abundance compared to a sample of fry from the BncFnc treatment before stress. Bars represent mean values with their standard errors of the mean (n 9). Means not sharing a common superscript letter are significant different according to two-way ANOVA followed by Tukey’s HSD post hoc test.

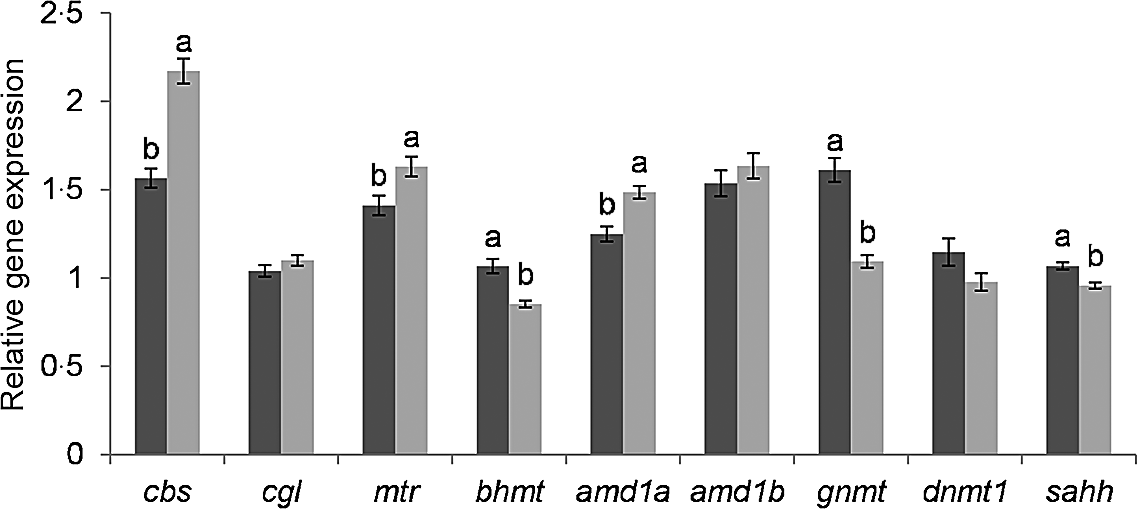
The genes glycine N-methyltransferase (gnmt), bhmt and adenosylhomocysteinase (sahh) were significantly lower expressed in fry post-exposure compared with pre-exposure to the hypoxic stress challenge (Fig. 2). In contrast, adenosylmethionine decarboxylase 1a (amd1a), methionine synthase (mtr) and cbs were significantly higher expressed in stressed compared with non-stressed fry. The genes DNA methyltransferase 1 (dnmt1), amd1b and cgl showed no significant difference according to the hypoxic stress challenge.
Effect of hypoxic stress on the expression of C1 genes. Gene expression was normalized to β-actin and ef1α and expressed as fold-changes of mRNA abundance compared to a sample of fry from the BncFnc treatment before stress. Bars represent mean values with their standard errors of the mean (n 81). Means not sharing a common superscript letter are significant different according to one-way ANOVA followed by Tukey’s HSD post hoc test. ![]() before stress;
before stress; ![]() after stress.
after stress.
Post-stress, a significant main effect was detected on bhmt for parental feeding with higher expression in Bnc compared with Bss (Table 6). A significant interaction between parental and dietary Se supplementation was detected for amd1a and gnmt in stressed fry that is illustrated in Fig. 1(b). If these two genes exhibited the same pattern of expression, in the case of gnmt, the Tukey’s HSD post hoc test did not allow to discriminate the groups contrary to amd1a. The genes were lower expressed in BssFso compared with fry originating from rainbow trout fed Bnc, irrespective of their fry diet.
Muscle free amino acids
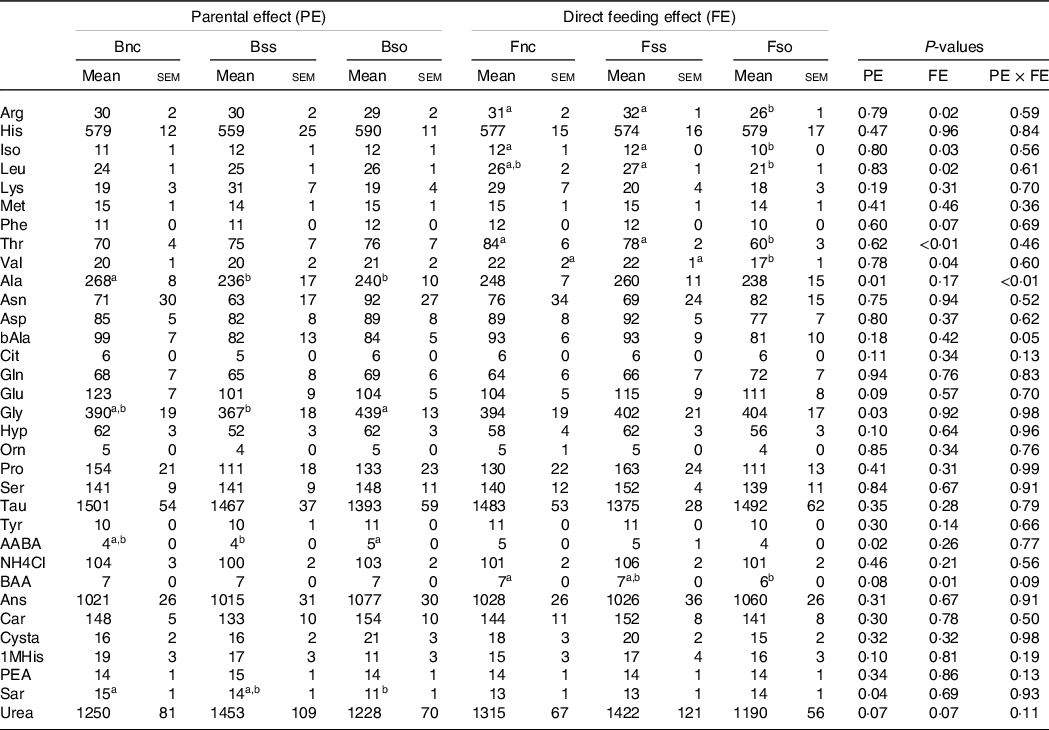
Fry sampled before stress displayed lower alanine and sarcosine concentrations when originating from parents fed Bso compared with Bnc (Table 7). For alanine, decreasing concentrations were also detected in the Bss treatment. Glycine and alpha-amino-n-butyric acid were higher in Bso compared with Bss. A direct feeding effect was detected for arginine, isoleucine, leucine, threonine, valine and dl-beta-aminoisobutyric acid with lower concentrations in Fso group compared with Fnc and Fss treatments.
Essential and non-essential amino acids (µg/g sample) in muscle of fry originating from parents subjected to different Se treatments (Bnc, Bss and Bso) and then fed diets containing different levels and sources of Se (Fnc, Fss and Fnc)
(Mean values with their standard errors, n 9)
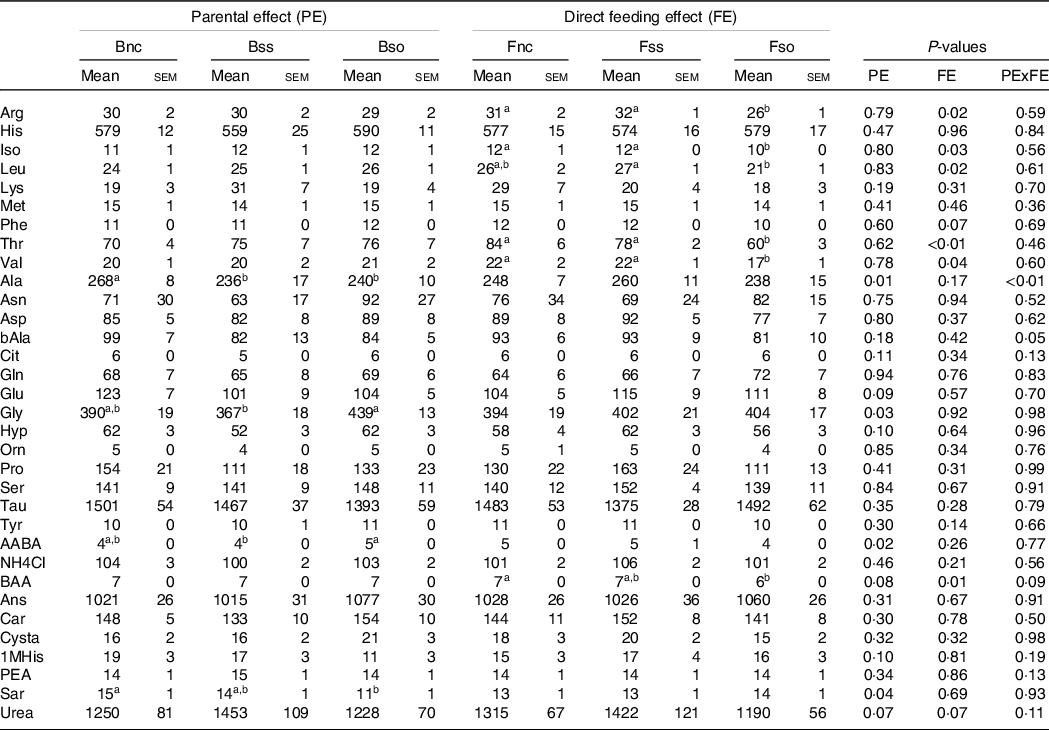
EAA, essential amino acids; NEAA, non-essential amino acids; Arg, Arginine; His, Histidine; Iso, Isoleucine; Leu, Leucine; Lys, Lysine; Phe, Phenylalanine; Thr, Threonine; Val, Valine; Ala, Alanine; Asp, Aspartic acid; bAla, beta-Alanine; Cit, Citrulline; Gln, Glutamine; Glu, Glutamic acid; Gly, Glycine; Hyp, Hydroxy-L-Proline; Orn, Ornithine; Pro, Proline; Ser, Serine; Tau, Taurin; Tyr, Tyrosine; AABA, L-alpha-amino-n-butyric acid; BAA, DL-beta-aminoisobutyric acid; Ans, Anserine; Car, Carnosine; Cysta, Cystathionine; 1MHis, 1-Methyl-L-Histidine; PEA, O-Phosphoethanolamine; Sar, Sarcosine.
a,b Mean values within a column or group with unlike superscript letters were significantly different according to two-way ANOVA followed by Tukey HSD.
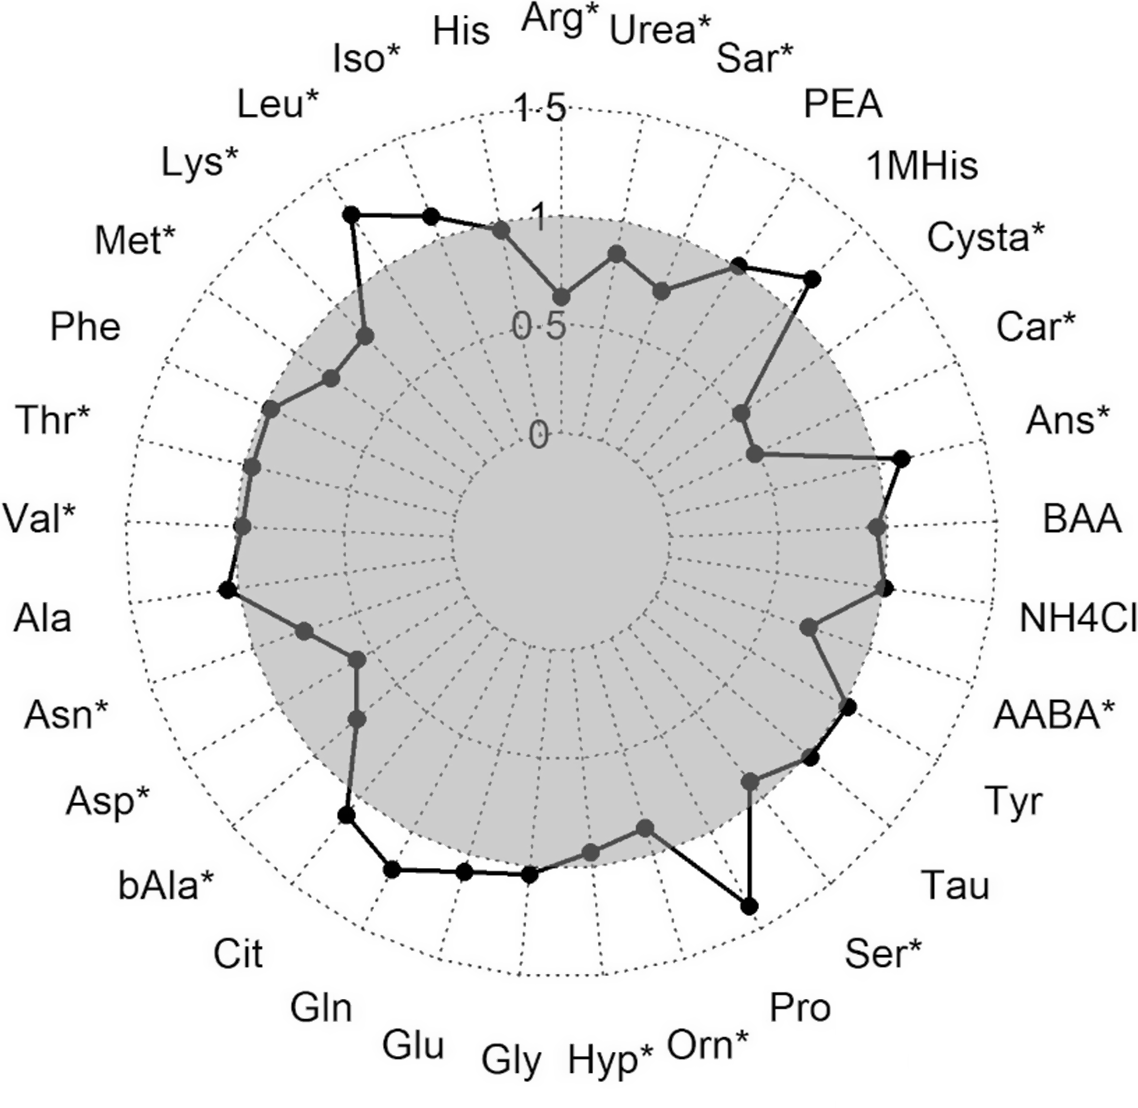
During the hypoxic stress challenge, essential amino acids significantly decreased in the muscle of fry including arginine, lysine, Met, threonine and valine, besides asparagine and aspartic acid (Fig. 3). An opposing effect with a significant increase during the stress was detected for isoleucine and leucine. Also, the contents of the non-essential amino acids beta-alanine, hydroxyproline, ornithine, serine, alpha-amino-n-butyric acid, carnosine, cystathionine, sarcosine and urea were significantly lower in stressed fry, while anserine concentration was higher in stressed compared with non-stressed fry.
Ratio of amino acids measured in muscle fillet of rainbow trout fry before and after subjected to a hypoxic stress challenge. Stars represent a significant increase or decrease in the metabolite assessed by one-way ANOVA. Arg, Arginine; His, Histidine; Iso, Isoleucine; Leu, Leucine; Lys, Lysine; Phe, Phenylalanine; Thr, Threonine; Val, Valine; Ala, Alanine; Asp, Aspartic acid; bAla, beta-Alanine; Cit, Citrulline; Gln, Glutamine; Glu, Glutamic acid; Gly, Glycine; Hyp, Hydroxy-L-Proline; Orn, Ornithine; Pro, Proline; Ser, Serine; Tau, Taurin; Tyr, Tyrosine; AABA, L-alpha-amino-n-butyric acid; BAA, DL-beta-aminoisobutyric acid; Ans, Anserine; Car, Carnosine; Cysta, Cystathionine; 1MHis, 1-Methyl-L-Histidine; PEA, O-Phosphoethanolamine; Sar, Sarcosine. ![]() after stress.
after stress.
In stressed fry, parental effects were detected for aspartic acid and sarcosine with the highest concentrations in the Bss treatment and dl-beta-aminoisobutyric acid with the highest concentration in the Bso treatment, while beta-alanine content was the highest in Bnc (Table 8). Fry sampled after stress showed lower leucine and threonine levels when fed Fso compared with Fnc, similarly to pre-stressed fry. Likewise, in stressed fry, aspartic acid, ornithine and proline were significantly lower in Fso compared with Fnc, while valine was higher in Fnc compared with Fss (Table 8).
Essential and non-essential amino acids (µg/g sample) in muscle of fry originating from parents subjected to different Se treatments (Bnc, Bss and Bso) and then fed diets containing different levels and sources of Se (Fnc, Fss and Fso) measured in fish subjected to hypoxic stress
(Mean values with their standard errors, n 9)
EAA, Essential amino acids; NEAA, Non-essential amino acids; Arg, Arginine; His, Histidine; Iso, Isoleucine; Leu, Leucine; Lys, Lysine; Phe, Phenylalanine; Thr, Threonine; Val, Valine; Ala, Alanine; Asp, Aspartic acid; bAla, beta-Alanine; Cit, Citrulline; Gln, Glutamine; Glu, Glutamic acid; Gly, Glycine; Hyp, Hydroxy-L-Proline; Orn, Ornithine; Pro, Proline; Ser, Serine; Tau, Taurin; Tyr, Tyrosine; AABA, L-alpha-amino-n-butyric acid; BAA, DL-beta-aminoisobutyric acid; Ans, Anserine; Car, Carnosine; Cysta, Cystathionine; 1MHis, 1-Methyl-L-Histidine; PEA, O-Phosphoethanolamine; Sar, Sarcosine.
a,b Mean values within a column or group with unlike superscript letters were significantly different according to two-way ANOVA followed by Tukey HSD.
Discussion
Impact of parental selenium intake on the one-carbon metabolism in rainbow trout fry
In the present study, no significant difference in body Se levels according to the parental nutritional history of Se was detected in fry. However, as previously described after 11 weeks of exogenous feeding, parental Se possibly represents only about 1–5 % of total body Se(Reference Wischhusen, Arnauldguilhem and Bueno27). Although body Se levels were similar, metabolites of the transsulphuration pathway were higher in fry originating from parents fed Se-supplemented diets. This includes not only cysteine, cysteinyl-glycine and GSH but also γ-glutamylcysteine an intermediate for the recovery of cysteine from GSH without impacting mRNA levels of transsulphuration enzymes. This effect is opposite to the parental Se effect that we previously described at swim-up fry stage where cysteine and cysteinyl-glycine levels were decreased by parental OH-SeMet intake(Reference Wischhusen, Saito and Heraud24). It has been shown in mammalian and avian studies that Se supplementation favours the transsulphuration of Hcys with higher cystathionine and cysteine levels(Reference Halpin and Baker28,Reference Speckmann, Schulz and Hiller29) , while in suboptimal Se conditions, the transsulphuration can be severely impaired(Reference Geillinger, Rathmann and Köhrle18). In the present study, BHMT expression was reduced in fry originating from parents that received Se-supplemented diets, but only when similarly fed Se-supplemented diets. This interactive effect indicates that Se supplementation can have long-term consequences on bhmt mRNA levels and therefore possibly on the re-methylation of Hcys to Met. A parental effect on bhmt expression or DNA methylation pattern was not detected at swim-up fry stage, suggesting that the parental effect relates to the further inclusion of dietary Se at first feeding as epigenetic modifications work in a time and spatial dimension that might underlay nutritional programming effects(Reference Wischhusen, Saito and Heraud24).
Impact of dietary selenium supplementation on the one-carbon metabolism in rainbow trout fry
As expected, body Se levels were higher when the fry was fed Se-supplemented diets. The higher Se levels of fry fed OH-SeMet compared with sodium selenite possibly relate to the better bioavailability of organic dietary Se sources(Reference Bell and Cowey30–Reference Berntssen, Lundebye and Amund32). Both organic and inorganic Se supplementation in fry diets decreased mRNA levels of the second step transsulphuration enzyme cgl without impacting the sulphur metabolites of the transsulphuration pathway. The enzyme CGL catalyses the reaction from cystathionine to form cysteine and is similarly active on selenocystathionine to form selenocysteine in the SeMet metabolism(Reference Zhao, Li and Li33). Se speciation detected higher SeMet levels in fry fed diets supplemented with organic Se, but similarly higher SeCys levels were detected in these fish(Reference Wischhusen, Arnauldguilhem and Bueno27). Differences in the activity of seleno- and sulphur compounds might be related to biochemical properties as seleno-compounds are generally more active(Reference Cupp-Sutton and Ashby34). It is surprising that Se supplementation reduced mRNA levels of cgl in the present study, while previously in male and female liver tissue of rainbow trout broodstock, no effect of Se feeding on cgl mRNA levels was detected(Reference Wischhusen, Saito and Heraud24). However, CGL has been described to be regulated post-transcriptionally by androgens and oestrogen sex hormones that not only result in tissue-specific CGL activity, a mechanism that has been suggested to account for sexual dimorphism in selenoprotein production(Reference Seale, Ogawa-Wong and Berry35), but might also regulate the CGL activity throughout the lifecycle. A post-transcriptional regulation of CGL is also known during early embryonic development in mammals, where the enzyme is expressed but inactive(Reference Levonen, Lapatto and Saksela36), which might favour the coincidental incorporation of SeMet into proteins rather than the active selenoprotein production from SeMet during early embryonic development(Reference Dalto, Matte and Patel37). Nevertheless, in the present study, Se feeding had no impact on Hcys levels in whole fry, which has been previously reported to decrease in blood plasma in accordance with increased transsulphuration by Se treatment(Reference Uthus and Ross19,Reference Uthus, Yokoi and Davis38) . However, Geillinger(Reference Anderson, Sant and Dolinoy13) described higher hepatic Hcys levels in Se-deficient mice as a tissue-specific effect under limiting Se conditions. Hcys has been shown to be produced, but translocated from the liver to the plasma possibly avoiding re-methylation of Hcys through the 1C metabolism due to limiting Se conditions(Reference Wolf, Mueller and Hirche39). Such effects might have been masked in the present study, where Hcys levels were determined in whole-body fry or because the dietary Se level was not enough low in the control treatment. Also, we detected lower bhmt mRNA levels in the OH-SeMet-supplemented treatment compared with the control; thus, inhibition of BHMT can be associated with hyperhomocysteinaemia(Reference Collinsova, Strakova and Jiracek40). However, the increase of transsulphuration enzymes by Se possibly pulled Hcys towards the transsulphuration pathway resulting in the unchanged Hcys levels as similarly suggested in rats(Reference Uthus and Ross19,Reference Uthus, Yokoi and Davis38,Reference Davis and Uthus41) .
In view that the metabolism of dietary Se is accompanied by the synthesis of several organo-seleno-metabolites(Reference Arnaudguilhem, Bierla and Ouerdane42), it remains questionable, if the observed changes in the transsulphuration pathway relate to the presence of selenised compounds or are rather mediated through other Se-dependent metabolic pathways. Promising approaches for future studies might include the simultaneous detection of selenols and thiols as although sharing chemical properties, seleno-metabolites are considerably more active(Reference Barbosa, Nogueira and Nogara43,Reference Tobe, Ueda and Ando44) .
Impact of acute hypoxic stress on the one-carbon metabolism in rainbow trout fry
Stressed fry showed no changes in body Se levels in response to hypoxia, which is in contrast to earlier studies in fish describing higher Se requirements under stressful conditions(Reference Rider, Davies and Jha45,Reference Küçükbay, Yazlak and Karaca46) . However, in the mentioned studies, the stress was applied for longer time periods compared with the present experiment. Oxidative stress typically involves an alteration of the intra- and extra-cellular thiol concentrations(Reference Dickinson and Forman47,Reference Nolin, McMenamin and Himmelfarb48) . In the present study, the similar decrease of Hcys, cysteine, cysteinyl-glycine and free muscle cystathionine as well as increased mRNA levels of the CBS gene suggests that an elevated GSH production via transsulphuration was impaired by the depletion of GSH precursors in stressed fry. The observed decrease of GSH under acute hypoxia is in line with the study of Pérez-Jiménez(Reference Pérez-Jiménez, Peres and Rubio49), who reported lower liver GSH in gilthead sea bream after exposure to hypoxic conditions for 6 h. On the other hand, in common carp, 6-h exposure to hypoxia was not associated with changes in GSH(Reference Lushchak, Bagnyukova and Lushchak50). Such differences might be species-specific(Reference Lushchak and Bagnyukova51,Reference Lushchak and Bagnyukova52) or relate to differences in study design. A stimulation of the transsulphuration pathway is suggested by higher mRNA levels of CBS, which also showed increased gene expression and activity in human glioblastoma and rat pheochromocytoma cells under hypoxia(Reference Takano, Peng and Kumar53). In human brain, the CBS-mediated cysteine limitation resulted in neurological deficits under hypobaric hypoxia(Reference Mishra, Kumar and Chhabra54). On the contrary, in the liver of developing and neonatal rats, CBS activity was decreased by hypoxic stress(Reference Blaise, Alberto and Nédélec55,Reference Blaise, Alberto and Audonnet-Blaise56) , however, without any changes in mRNA levels. Such modifications in the transsulphuration pathway might be mediated by changes in the transmethylation pathway as especially SAM is a well-known regulator of CBS(Reference Pey, Majtan and Sanchez-Ruiz57). Decreasing SAM levels under hypoxic conditions as described in the present study were also noticed in different mammalian studies(Reference Avila, Carretero and Rodriguez58–Reference Kloor, Hermes and Fink60). In hepatocytes of male rats, ATP-dependent SAM formation was even identified as a rate-limiting step in GSH synthesis under limiting oxygen conditions, while GSH formation from cysteine was not impaired(Reference Shan, Aw and Shapira61). The strong impact of limiting oxygen levels on the Met cycle was confirmed by the lower Met levels in stressed fry that have been similarly described in various organisms(Reference Gleason, Corrigan and Cox62–Reference Haider, Falfushynska and Timm64). Earlier studies showed that in fish liver and muscle tissue, not only SAM synthase was up-regulated but also other genes involved in the amino acid metabolism showed transcriptomic differences when exposed to hypoxic stress(Reference Gracey, Troll and Somero65,Reference Qi, Chao and Wu66) . In the present study, the decrease of many essential amino acids in muscle together with the decrease of asparagine and aspartic acid levels revealed an active stimulation of gluconeogenesis from amino acids in muscle. The branched-chain amino acids are, however, preserved in stressed fry, demonstrating that the ketogenic pathway is not involved in gluconeogenesis. Furthermore, the large decrease in sarcosine and beta-alanine and the increase in anserine in stressed fish suggest alterations in buffering capacity of muscle tissue. This could be related to the general decrease of pH observed in stressed fish(Reference Langenbuch and Pörtner67), but the increase in anserine content suggests that other mechanisms could be involved. However, the transcriptomic response of liver aminotransferases in fish to hypoxia was dynamic during exposure time(Reference Gracey, Troll and Somero65).
Impact of selenium on the one-carbon metabolism in stressed rainbow trout fry
The detected modifications of the transsulphuration pathway by parental Se in fry were not detected anymore after application of the acute hypoxic stress. It could be speculated that the impact was masked by the strong decrease of these metabolites during hypoxia. Regarding the transmethylation pathway, similar to normoxic fry, in stressed fry bhmt, mRNA levels were lower when originating from broodstock fed the inorganic Se-supplemented diet Bss. This persistent effect by parental Se suggests a strong nutritional programming effect on the Met cycling, which is similar to the effects we observed earlier in the antioxidant system, where a transcriptional down-regulation in gene expression was observed in stressed fry originating from parents fed sodium selenite-supplemented diets(Reference Wischhusen, Larroquet and Durand10). On the other hand, at swim-up fry stage, neither parental organic nor inorganic Se supplementation had any effect on the expression or hepatic DNA methylation pattern of the bhmt gene, but only increased mRNA levels of other 1C metabolism genes including mtr and amd1b (Reference Wischhusen, Saito and Heraud24). In the present study, stressed fry of the BssFso treatment had lower SAM decarboxylase expression compared with fry originating from the broodstock control group Bnc. This might indicate that inorganic Se supplementation of parental diets could inhibit polyamine synthesis in the progeny under stressful conditions. Polyamine synthesis has been formerly described to be increased by both acute hypoxia(Reference Longo, Packianathan and McQueary68) and Se treatment(Reference Thompson, Ip and Ganther69). Similarly, also GNMT expression showed interactive effects between dietary supplementation and parental Se intake in stressed fry. GNMT converts SAM to SAH, while generating sarcosine from glycine(Reference Wang, Chen and Lin70). Even though the post hoc test could not discriminate between treatments for gnmt mRNA levels, the highest expression was related to fry originating from the broodstock control group and the lowest one for fry fed differing Se forms compared with their parents. The fact that two dietary Se forms exert different effects on the sarcosine metabolism was also suggested by sarcosine levels that were higher in fry originating from parents fed sodium selenite compared with fry originating from the OH-SeMet treatment. GNMT activity and sarcosine levels can relate to changes in DNA methylation pattern, which are underlying epigenetic mechanisms in nutritional programming effects(Reference Strmiska, Michalek and Lackova71,Reference Wang, Tang and Chen72) . Therefore, the long-term impact of parental Se on polyamine synthesis and the impact of inorganic and organic Se forms on the sarcosine metabolism in fish might deserve further investigation.
Conclusion
In comparison with the positive short-term effect of parental Se on the antioxidant system previously detected at swim-fry stage, the present study suggests that after 11 weeks of exogenous feeding, complex interactions between parental and dietary Se supplementation are in place. A nutritional programming in the GSH metabolism might be mediated through the transsulphuration pathway where higher metabolite levels were detected in fry when parents received Se-supplemented diets. Under hypoxia, GSH synthesis through transsulphuration appears to be impaired by the depletion of a precursor. The combination of both parental Se supplementation and hypoxic stress possibly induced changes on the Met cycling and polyamine synthesis indicated by changes in 1C gene expression. Similar to the present results, the transcriptional down-regulation also in the antioxidant system was higher in sodium selenite compared with the OH-SeMet treatment, which suggests that parental inorganic Se supplementation induces stronger changes in the metabolism of progeny at long-term.
Acknowledgements
The authors wish to thank F. Terrier, F. Sandres and A. Lanuque for the preparation of diets, care of the fish and assistance during the hypoxic stress challenge. We are grateful to E. Blanchandin for RNA extraction and W. Massimino concerning data processing using Fluidigm software. We also thank the IMR technical staff for analytical assistance.
The present study was supported by I-site E2S: Energy and Environment Solutions from the University of Pau and Pays de l’Adour, UPPA contract 2017-17 (P. W., PhD fellowship) and UPPA contract 2018-178 (P. W., Research mobility grant), the Institute of Marine Research (IMR) (ParSel Project no. 15329) and Adisseo France SAS (SelGen contract no. 22001062 labelled by the Institut Carnot France Futur Elevage IC-F2E).
P. W.: formal analysis, investigation, writing-original draft and visualisation. C. H.: methodology, investigation and resources. K. S.: funding acquisition, writing review and editing. S. J. K.: conceptualisation, writing review and editing, project administration and funding acquisition. B. F.: supervision, writing review and editing. P. A. J. P.: conceptualisation, investigation, writing review and editing, supervision, project administration and funding acquisition. S. F.-D.: conceptualisation, investigation, writing review and editing, supervision, project administration and funding acquisition.
The authors declare that there are no conflicts of interest.


