


Over the past half century, rates of childhood obesity have tripled in the USA(Reference Fryar, Carroll and Ogden1). In the midst of this childhood obesity epidemic, the Healthy, Hunger-Free Kids Act was passed in 2010 to address both childhood obesity and food insecurity in the USA(2). This Act included a mandate for the US Department of Agriculture to overhaul the nutrition standards for school meals, which had not occurred since 1995. A 2010 Institute of Medicine report previously found that school nutrition standards were not aligned with the contemporaneous Dietary Guidelines for Americans, specifically that standards required less fruits, vegetables and whole grains than recommended by the Dietary Guidelines for Americans, and that students were deriving a higher than recommended percentage of energy content from added sugars and saturated fats(3). The Institute of Medicine’s recommendations, which were grounded in the Dietary Guidelines for Americans 2010, helped shape updated school nutrition standards that were implemented for the National School Lunch Program (NSLP) primarily in the 2012–2013 school year. The updated standards notably increased the amount and variety of fruits and vegetables, set maximum energy limits for the first time, required that grains be wholegrain-rich and allowed only non-fat milks to be flavoured (i.e., contain added sugar)(4).
Since implementation of updated school nutrition standards, studies have examined its impact on fruit and vegetable selection and consumption, food waste, nutritional profile of meals and participation in the NSLP. Multiple studies showed improvements in the nutritional value of school meal options(Reference Terry-McElrath, O’Malley and Johnston5–Reference Fox and Gearan8), and several studies showed no significant decrease in NSLP participation(Reference Johnson, Podrabsky and Rocha7,Reference Vaudrin, Lloyd and Yedidia9–Reference Cohen, Gorski and Hoffman11) . Field studies at school cafeterias found increases in fruit selection by 20 %(Reference Cohen, Richardson and Parker10) and vegetable consumption by 16–20 %(Reference Cohen, Richardson and Parker10,Reference Schwartz, Henderson and Read12) , and one large cross-sectional survey showed that Healthy Eating Index scores of lunch-specific dietary intake were significantly higher in students eating NSLP school lunches compared with those who did not eat NSLP school lunches(Reference Fox, Gearan and Cabili13). Most field studies did not show increased fruit and vegetable food waste after implementation of 2012 nutrition standards(Reference Cohen, Richardson and Parker10,Reference Schwartz, Henderson and Read12,Reference Cullen, Chen and Dave14,Reference Bontrager Yoder, Foecke and Schoeller15) , although one study in Vermont demonstrated otherwise(Reference Amin, Yon and Taylor16).
Most prior studies of the updated school nutrition standards have occurred at the school or district level, precluding conclusions generalisable to the greater US population(Reference Cullen and Dave17,Reference Satija, Yu and Willett18) . Two recent national studies have captured a cross-section of school meals and dietary intake but occurred primarily after implementation of the updated school nutrition standards(Reference Fox and Gearan8,Reference Au, Gurzo and Gosliner19) . We used nationally representative, repeated cross-sectional data before and after implementation of the updated school nutrition standards to study whether the policy was associated with changes in (i) weekday fruit and vegetable intake, (ii) weekday solid fat and added sugar (SoFAS) intake and (iii) overweight and obesity prevalence in children participating in NSLP compared with children who did not participate in NSLP.
Methods
Study design and data collection
We used a difference-in-differences design with data from the 2005–2016 National Health and Nutrition Examination Survey (NHANES). NHANES is an annual nationally representative survey examining the health and nutritional status of US adults and children. Each year, fifteen counties are selected to sample residents. Participants complete questionnaires with an interviewer in their own homes. On a subsequent day, they visit the medical examination centre, a mobile trailer that travels from county to county, to complete medical evaluations and a 24-h dietary recall with a trained dietary interviewer. Children aged 6–11 years complete the dietary recall with a proxy, generally a parent, and children aged 12 years and older complete the dietary recall independently. The majority of participants complete a second 24-h dietary recall by phone 3–10 d after the medical examination centre visit. Further details on sampling and data collection methods for NHANES are reported elsewhere(Reference Zipf, Chiappa and Porter20). We included NHANES data from questionnaires, the medical evaluation and 24-h dietary recalls.
We used the Food Patterns Equivalents Database to obtain dietary intake from NHANES by food groups. Food intake data collected during 24-h dietary recalls in NHANES are recorded as food item codes, and Food Patterns Equivalents Database converts these codes into the thirty-seven US Department of Agriculture food groups with standardised units, such as fruits and vegetables in cup equivalents, solid fats in gram equivalents and added sugars in teaspoon equivalents(Reference Bowman, Clemens and Friday21).
Study sample
Eligible subjects were children, aged 6–20 years, with weekday dietary intake data who either ate all lunches or no lunches from the in-house lunch at K-12 schools that served daily school meals in NHANES from 2005 to 2016. We excluded individuals <72 months old (6 years old) as their dietary recall data in NHANES were exclusively reported by proxy. We also excluded students on medical diets (diabetic, renal or celiac), and those with missing data on study exposure status or outcomes.
As NHANES is public, de-identified data, the current study was considered exempt by the Boston University Institutional Review Board.
Exposures and outcomes
Using the question ‘During the school year, about how many times a week do you/does [sample person] usually get a complete school lunch?’ from the Diet, Behaviour and Nutrition questionnaire, we classified those who reported eating school lunch five times weekly as NSLP participants and those who reported eating no school lunches weekly as non-participants.
Since the updated school nutrition standards were implemented in 2012 (henceforth referred to as ‘intervention’), we classified subjects responding to NHANES surveys from 2005 to 2010 as pre-intervention and subjects from 2013 to 2016 as post-intervention. Because NHANES releases data in 2-year cycles but withholds the specific month and year of data collection for each subject, we categorised respondents from the 2011 to 2012 NHANES survey as being in a transition period as we were not able to distinguish between those who were surveyed before the start of the 2012–2013 school year and those who were surveyed during that school year when the intervention was implemented.
In the primary analysis, we restricted dietary data to weekday intake since the updated school nutrition standards only directly affected weekday intake. The primary outcome was weekday fruit and vegetable intake assessed over a 24-h period and expressed in cup equivalents. This outcome included the following Food Patterns Equivalents Database components: citrus, melons and berries; other fruits; fruit juice; dark green vegetables; red and orange vegetables; starchy vegetables; other vegetables; beans and peas (legumes)(Reference Bowman, Clemens and Shimizu22). We used given day estimates for subjects with 1 d of weekday dietary recall data (55·4 %) and within-person mean estimates for subjects with 2 d of weekday dietary recall data (44·6 %). Prior to summing, high fruit intake and vegetable intake were truncated at the 99th percentile value to reduce implausible values(Reference Mills, Brown and Wrieden23). Secondary outcomes included weekday SoFAS intake, expressed as a percentage of daily energy content, and overweight and obesity prevalence. BMI was calculated from measured height and weight in NHANES. We used conventional BMI-for-age percentiles to classify subjects as underweight, normal weight, overweight or obese(24).
We identified potential covariates based on our a priori conceptualisation of the relationship between school lunch and dietary intake. Covariates included age, sex, race/ethnicity, screen time, country of birth and marital status of the household reference person, household education level and family income as a percentage of the federal poverty level (FPL). NHANES defines the household reference person as ‘the first household member 18 years of age or older listed on the household member roster, who owns or rents the residence where members of the household reside(25)’. Reference person data are commonly used to characterise household socio-economic status for survey subjects. Household education level was the higher of education levels between the household reference person and spouse. Family income as a percentage of FPL was categorised into three levels: <130 % FPL, 130–185 % FPL and >185 % FPL.
Statistical analysis
We calculated mean weekday fruit and vegetable intake, mean weekday SoFAS intake and mean overweight and obesity prevalence in NSLP participants and non-participants for each of the NHANES 2-year data cycles, adjusted for the previously mentioned covariates. Using multiyear sample weights for NHANES 2005–2016, we applied the 1-d dietary weight to dietary outcomes and the medical examination centre weight to BMI(26). We plotted mean values with se bars to visualise trends over the study period between NSLP participants and non-participants.
We used linear regression with a difference-in-differences design specification to estimate the impact of the intervention based on the comparison of post-intervention change in each outcome measure in NSLP participants with the corresponding change within non-participants not affected by the intervention(Reference Dimick and Ryan27,Reference Raifman, Moscoe and Austin28) . Specifically, we used a linear regression model for each outcome, including indicators of school lunch participation, intervention period, transition period and the interaction of school lunch participation and the intervention. The parameter estimate for the interaction term provides the difference-in-differences estimate of the effect of the updated school nutrition standards on our study outcomes.
We included covariates identified above in multivariable linear regression models and retained each covariate that changed the effect estimate for each outcome by 10 % or more. Due to a high prevalence of missing data for some covariates (16·2 % missing screen time, 6·7 % missing family income), we used multiple imputation to generate plausible values for missing covariate data. We generated twenty imputed data sets and calculated adjusted estimates for each of the imputed data sets. We combined effect estimates and se from each imputed data set.
To determine whether the effects of the intervention on our primary outcome differed by other factors, we considered stratification by (i) sex, (ii) categorical family income as a percentage of FPL, which has been shown to modulate school lunch participation(Reference Cohen, Gorski and Hoffman11), (iii) race/ethnicity, which is known to be correlated with dietary differences and (iv) school level (elementary, middle and high), as students gain more autonomy to select and decline school lunch items when they graduate from elementary school to middle and high school(4). For each case, we estimated an extension of the above model wherein difference-in-differences are compared across the stratified groups (i.e., by including three-way interactions). We conducted stratified analyses if the three-way interaction term (intervention × exposure × stratifying variable) was significant at α = 0·10.
In sensitivity analyses, we further examined the effect of the intervention in weekday fruit and vegetable intake by separating out non-starchy v. starchy vegetables and whole/cut fruit v. fruit juice. We also estimated the effect of the intervention in 24-h fruit and vegetable intake, 24-h SoFAS intake and overweight and obesity in eligible students with either weekday or weekend dietary data.
All analyses were performed with SAS 9.4 (SAS Institute Inc.), using survey procedures that accounted for the complex survey design of NHANES.
Results
From 2005 to 2016, NHANES surveyed 9950 children with one or more weekday 24-h dietary recalls who either ate all lunches or no lunches from the in-house lunch at a K-12 school. We excluded 637 individuals who were younger than 72 months old or on a medical diet. We also excluded 184 individuals who were missing data on NSLP participation, dietary intake outcomes or BMI. The final sample size was 9172 subjects.
Table 1 displays individual and household characteristics by NSLP participants and non-participants. On average, NSLP participants were younger, more likely to be male and had higher proportions of non-Hispanic Black and Hispanic individuals than non-participants. Both groups generally spent an average of 3·2 h/d using a TV or computer. At the household level, 42 % of NSLP participants had family incomes below 130 % of the FPL compared with 13 % of non-participants. Of note, families below 130 % of the FPL are eligible for free school meals. In addition, another 14 % of NSLP participants and 9 % of non-participants had family incomes between 130 and 185 % of the FPL, the income threshold for reduced-price lunch. NSLP participants were also less likely to live in a household with two adults than non-participants. In 24 % of NSLP participant households, the household education level was college graduate or higher, compared with 51 % of non-participants.
Study subject characteristics by National School Lunch Program (NSLP) participation (n 9172)
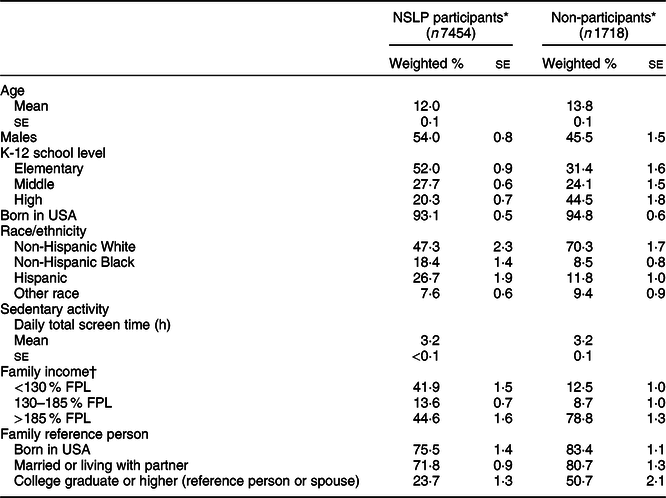
FPL, federal poverty level.
* NSLP participants were those who reported eating school lunch 5 d/week, and non-participants were those who reported eating no school lunches in a week.
† Family income is expressed as a percentage of the FPL.
From 2005 to 2016, mean weekday fruit and vegetable intake was approximately two cup equivalents per day for both NSLP participants and non-participants (Fig. 1(a)). During the study period, weekday SoFAS intake declined in NSLP participants and non-participants to similar levels, although the NSLP group had a higher baseline SoFAS intake (Fig. 1(b)). Overweight and obesity prevalence gradually increased over the study period in both groups (Fig. 1(c)).
(a) Survey-weighted mean weekday fruit and vegetable intake in cup equivalents with se for National School Lunch Program (NSLP) participants (n 7454) and non-participants (n 1718) from 2005 to 2016, using multivariable linear regression adjusted for age, sex, race/ethnicity, daily screen time, country of birth and marital status of the household reference person, household education level and family income. (b) Survey-weighted mean weekday solid fat and added sugar intake as a percentage of 24-h energy intake with se for NSLP participants (n 7454) and non-participants (n 1718) from 2005 to 2016, using multivariable linear regression adjusted for age, sex, race/ethnicity, daily screen time, country of birth and marital status of the household reference person, household education level and family income. (c) Survey-weighted overweight and obesity prevalence with se for NSLP participants (n 7454) and non-participants (n 1718) from 2005 to 2016, using multivariable linear regression adjusted for age, sex, race/ethnicity, daily screen time, country of birth and marital status of the household reference person, household education level and family income. NHANES, National Health and Nutrition Examination Survey. ![]() , NSLP participants;
, NSLP participants; ![]() , non-participants
, non-participants

The crude effect estimate of the intervention on NSLP participants compared with non-participants showed no change in weekday fruit and vegetable intake (β = 0·06 cup, 95 % CI −0·21, 0·32; Table 2) or overweight and obesity prevalence (β = −4·0 %, 95 % CI −9·8, 1·9). With implementation of the intervention, NSLP participants had a reduction of 1·7 percentage points (95 % CI −3·2, −0·2) in weekday SoFAS intake compared with non-participants. After adjusting for age, sex, race/ethnicity, daily screen time, country of birth and marital status of the household reference person, household education level and % FPL, the effect estimates changed minimally for weekday fruit and vegetable intake (β = 0·02 cups, 95 % CI −0·23, 0·27) and weekday SoFAS intake (β = −1·5 %, 95 % CI −3·0, −0·1). Adjustment for potential confounders strengthened effect estimates for overweight and obesity prevalence (β = −6·1 %, 95 % CI −12·1, −0·1). Dividing fruit and vegetable intake into starchy v. non-starchy vegetables (see online supplementary material, Supplemental Fig. S1) and whole/cut fruit v. fruit juice (see online supplementary material, Supplemental Fig. S2) demonstrated no significant effects associated with the intervention (see online supplementary material, Supplemental Table S1).
Difference-in-differences estimates of weekday fruit and vegetable intake, weekday solid fats and added sugars (SoFAS), and overweight and obesity prevalence with 95 % CI using simple and multivariable linear regression (n 9172)
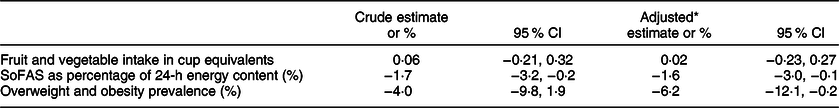
* Adjusted for age, sex, race/ethnicity, daily screen time, country of birth and marital status of the household reference person, household education level and family income.
Stratified analyses
Three-way interactions incorporating sex, family income level and school level did not approach significance, and we did not further stratify data by those variables. However, the three-way interaction between the intervention, exposure and race/ethnicity had a P-value of 0·08 and we conducted a stratified analysis by race/ethnicity. The adjusted difference-in-differences estimate for weekday fruit and vegetable intake showed an increase of 0·37 cups (95 % CI 0·13, 0·61; Table 3) in non-Hispanic Black students and an increase of 0·27 cups (95 % CI 0·07, 0·46) in students whose race/ethnicity was categorised as ‘Other’. Hispanic students had a decline in weekday fruit and vegetable intake by 0·29 cups (95 % CI −0·50, −0·08) associated with the intervention. Estimates for non-Hispanic White students showed no change in weekday fruit and vegetable intake.
Difference-in-differences estimates of weekday fruit and vegetable intake stratified by race/ethnicity with 95 % CI using simple and multivariable linear regression
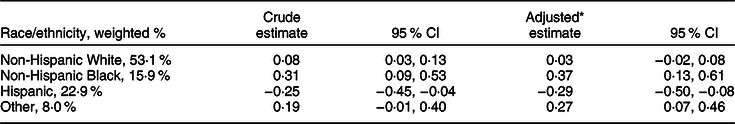
* Adjusted for age, sex, race/ethnicity, daily screen time, country of birth and marital status of the household reference person, household education level and family income.
An analysis using both weekday and weekend dietary data in a cohort of all eligible NHANES participants (see online supplementary material, Supplemental Table S2) with dietary data, both weekday and weekend, showed attenuation of changes associated with the intervention in all primary and secondary outcomes (see online supplementary material, Supplemental Table S3 and Supplemental Figs. S3–S5).
Discussion
The current study is the first to our knowledge to use national-level data before and after implementation of updated school nutrition standards to assess dietary changes related to the national policy. Our findings did not demonstrate a change in daily fruit and vegetable intake on weekdays after implementation of the updated school nutrition standards. This result is consistent with those of the US Department of Agriculture School Nutrition and Meal Cost Study, which found no difference in weekday fruit and vegetable intake between NSLP participants and non-participants despite reporting significantly higher lunch-specific fruit and vegetable intake in NSLP participants compared with non-participants(Reference Fox, Gearan and Cabili13), suggesting that dietary improvements from school lunch can be attenuated by dietary intake in the rest of the day.
Racial and ethnic differences in fruit and vegetable intake associated with the updated school nutrition standards suggest that the policy may have differential effects on different groups. Increased fruit and vegetable intake in non-Hispanic Black and other race/ethnicity students without changes in non-Hispanic White students could represent differences in the experiences of urban compared with rural school districts. Perceptions of student complaints, participation and meal consumption by school administrators have demonstrated rural/urban and socio-economic divides, with negative perceptions being more prevalent in rural and higher socio-economic status schools(Reference Turner and Chaloupka29). It is difficult to interpret the decline in fruit and vegetable intake in Hispanic students as the composition of this group was likely highly heterogeneous due to immigration and geographic variation from the NHANES sampling approach over the study period(Reference Flores, Lopez and Krogstad30).
Implementation of updated school nutrition standards was associated with a decline in weekday SoFAS intake, even after adjusting for multiple factors. School nutrition standards that could have affected SoFAS were maximum energy limits for school meals and limitation of added sugars in milk to only non-fat milk, which has since been liberalised to include low-fat milk(31). This suggests that the NSLP may be one contributor to decline in SOFAS intake in NSLP participants over this time period. While previous cross-sectional data from the School Nutrition and Meal Cost Study showed no significant difference in 24-h SoFAS intake between NSLP participants and non-participants, use of dietary data prior to the updated school nutrition standards in our study shows that SoFAS intake was higher on average in NSLP participants than non-participants at baseline, which represents a greater decline in SoFAS intake in NSLP participants compared with non-participants. During our study period, Smart Snacks in School, a nutrition standard applied to non-federally subsidised food sold in schools, was implemented in the 2014–2015 school year. While its implementation had minimal overlap with declines in SoFAS intake during our study period, it may have contributed to those declines due to the possibility that states that preemptively adopted such policies prior to 2014–2015 were included in the current study.
After adjusting for potential confounders, our findings suggest that the rising trend in overweight and obesity prevalence was attenuated in NSLP participants due to implementation of updated school nutrition standards. A previous study had shown that states that exceeded 1995 school nutrition standards had lower obesity prevalence in middle school students compared with those who met standards(Reference Taber, Chriqui and Powell32). However, in our study, the reduction was weakened after repeating the analysis with a larger sample of students. Expanding our sample to children with weekend dietary data widened the CI despite enlarging the sample size and suggests greater heterogeneity in overweight and obesity that was not captured in our primary sample. The sample was not likely biased by innate differences between NHANES subjects attending medical examination centre visits on weekends v. weekdays, as a Friday dietary recall was collected on a Saturday and a Sunday dietary recall was collected on a Monday. Changes to overweight and obesity rates occur slowly, and it is possible that a longer follow-up period is necessary to precisely demonstrate change at the national level.
Overall, the current study suggests that nutrition policies, such as school nutrition standards, can be effective in reducing unhealthy components from children’s diets. However, mandating increased exposure or selection of healthier foods in specific meals does not necessarily lead to significant consumption of those foods. Our null finding in fruit and vegetable intake may be explained by food waste during school meals, which is highest in fruits and vegetables(Reference Byker Shanks, Banna and Serrano33) and can therefore undermine the purpose of nutrition standards. In a prior study of eight elementary schools in Houston, despite menu compliance to 2012 nutrition standards, no grades fulfilled the fruit and vegetable requirements by intake due to food waste(Reference Niaki, Moore and Chen34). However, innovative school districts have found success with making vegetables more palatable to students by augmenting the updated school nutrition standards with strategies such as personalising school meals (e.g., salad bars, spice stations) and student participation (e.g., meal feedback, taste tests and education)(Reference Butler35). Further studies should explore whether these interventions to engage children in healthy eating at lunch lead to sustained fruit and vegetable consumption inside and outside of school. Along with the increase in fruit and vegetable intake seen in certain groups (i.e., non-Hispanic Black students), these results do not support reduction of fruit and vegetable requirements proposed by the US Department of Agriculture(36).
Compared the maximum energy content per meal of the 2012 school nutrition standards with the estimated energy needs in the Dietary Guidelines for Americans 2015, daily school breakfast and lunch together often account for less than half of weekly energy needs during the school year, with variation due to sex, age and physical activity(37). While the School Breakfast Program also has nutrition standards, including a minimum of one cup of fruit per breakfast, participation in the programme is much lower than NSLP(38,39) , and strategies to improve child nutrition in the USA may also need to engage parents and caregivers to influence the meals that are served outside the purview of school nutrition policy.
A limitation of our study is that NHANES is an annual cross-sectional survey; therefore, effects are neither causal nor do they represent changes at the individual level. There may also be residual confounding due to unmeasured confounders between the exposure and control groups, including physical activity level, free/reduced-price school meal status, and school and community environmental factors. In addition, information on whether weekday dietary intake was collected on a school day was not available, so some weekday data represent dietary intake outside of school days. Furthermore, implementation of updated school nutrition standards was neither simultaneous nor are all schools fully compliant with them. Prior literature shows that some states had preemptively implemented healthier meal requirements before the 2012–2013 school year(Reference Taber, Chriqui and Powell32), whereas compliance in school lunch meals in 2014–2015 ranged from 91 to 93 % for daily fruit and vegetable requirements, milk restrictions and maximum energy content(Reference Fox and Gearan8). As NHANES does not identify surveyed counties, we do not know whether a sampled county had early implementation of meal requirements that more closely follows the updated school nutrition standards. Both issues likely led to non-differential misclassification of the predictors, which could bias our results towards the null. Finally, the Great Recession may have differentially affected NSLP participants more than non-participants, and a difference-in-differences model is unable to control for differential secular trends.
Conclusions
Implementation of the updated school nutrition standards for school lunch was associated with decreases in empty energy content but not increases in daily fruit and vegetable consumption in the current study. This suggests that policies that limit the consumption of unhealthy foods in school meals can have a relatively fast effect, but improving dietary intake in K-12 students by increasing the presence of healthy foods in the school environment may change diet more slowly and could benefit from augmentation to make healthy foods more appealing to schoolchildren. Gains in fruit and vegetable intake in certain groups and reductions in empty energy content suggest that amendment of the school nutrition standards to allow greater flexibility may be detrimental to the nutrition of schoolchildren. Furthermore, the updated school nutrition standards may be alleviating overweight and obesity in students participating in NSLP meals, although changes were not definitively demonstrated in all analyses. National trends in overweight and obesity may take several years after the intervention to be able to detect change, and further study of associated trends should continue as new data become available to fully understand whether school nutrition policy is a useful tool to address childhood obesity.
Acknowledgements
Acknowledgements: None. Financial support: J.J. completed the study and manuscript under training grants no. D33HP25766 and no. T32HP32715 from the Health Resources and Services Administration. Conflict of interest: There are no conflicts of interest.. Authorship: J.J. cleaned and conducted analyses on all data and wrote the manuscript draft. L.L.M., H.C., A.H. and M.R.L. advised on the study design and analysis and contributed to the manuscript. Ethics of human subject participation: The National Health and Nutrition Examination Survey was conducted according to the guidelines laid down in the Declaration of Helsinki, and all procedures involving research study participants were approved by the National Center for Health Statistics Research Ethics Review Board. Written informed consent was obtained from all subjects/patients. The current study was deemed exempt by the Boston University Institutional Review Board.
Supplementary material
For supplementary material accompanying this paper visit https://doi.org/10.1017/S1368980020001986.


