


Non-technical Summary
Fossils of terrestrial vertebrates are often found in fluvial sediments, and floods (overbank floods, levee breaches, debris flows, etc.) are often suggested to influence bone transport and burial. Voorhies Groups are commonly used as indicators of bone transport and sorting at fossil sites, but some researchers have cautioned the use of these qualitative categories beyond the scope of the original experiments, which focused on a few mammals in shallow, steady flow. In this study, we experimentally examine the transport of sheep and hadrosauroid dinosaur bones in shallow floods. We find that changing flow conditions can influence how bones moved and sorted over time exposed to flow. Factors such as bedforms and interactions with other bones caused shorter transport distances than might be expected in some elements, which would be heightened in real flooding situations where trapping mechanisms are common. While we were able to statistically organize the hadrosauroid bones into categories similar to Voorhies Groups, such groups could not be identified among the sheep bones. Distances that bones of both taxa tended to travel do not fully match what Voorhies Groups would predict, and this suggests that researchers should be careful in using Voorhies Groups to make interpretations of taphonomic histories of fossil sites deposited in unsteady flows. Further study of variables driving bone transport and burial, such as bone density, shape, and size, may allow for more broadly comparative examinations of fluvial biostratinomy.
Introduction
Fluvial and floodplain facies preserve a major portion of the terrestrial vertebrate fossil record (Behrensmeyer Reference Behrensmeyer1988, Reference Behrensmeyer, Rogers, Eberth and Fiorillo2007). Understanding the interaction of bones and fluid flow in these ancient environments is critical to interpreting aspects of terrestrial vertebrate taphonomy, because fossils preserved in these lithofacies have the potential to experience varying degrees of transport before final burial (Shotwell Reference Shotwell1955; Aslan and Behrensmeyer Reference Aslan and Behrensmeyer1996). Whether fossil assemblages are preserved in the environments where organisms lived and died (autochthonous) or are transported some distance from these areas (allochthonous) can impact interpretations of biostratinomy and paleoecological reconstructions for terrestrial vertebrate sites (Shotwell Reference Shotwell1955; Behrensmeyer Reference Behrensmeyer, Allison and Briggs1991; Behrensmeyer and Hook Reference Behrensmeyer, Hook, Behrensmeyer, Damuth, DiMichele, Potts, Sues and Wing1992).
Biostratinomic interpretations can also have paleobiological implications in themselves. Whether fossil assemblages are believed to have been deposited relatively rapidly (by catastrophic means or entrainment of existing caches of material) or via attrition (time averaged) guides interpretations of potential behaviors and ecologies in ancient organisms that might affect final deposition postmortem (Dodson Reference Dodson1973; Behrensmeyer Reference Behrensmeyer1988; Rogers and Kidwell Reference Rogers, Kidwell, Rogers, Eberth and Fiorillo2007). Preferential fluvial sorting can decrease skeletal completeness in a systematic manner and, in turn, can affect which data remain available to analyze other aspects of the ancient biosphere, such as phylogeny, biodiversity, body-mass estimation, and biomechanics, even at small geographic scales that might not have a significant impact on paleoecological interpretations (Behrensmeyer Reference Behrensmeyer, Allison and Briggs1991; Brassey and Gardiner Reference Brassey and Gardiner2015; Woolley et al. Reference Woolley, Bottjer, Corsetti and Smith2024).
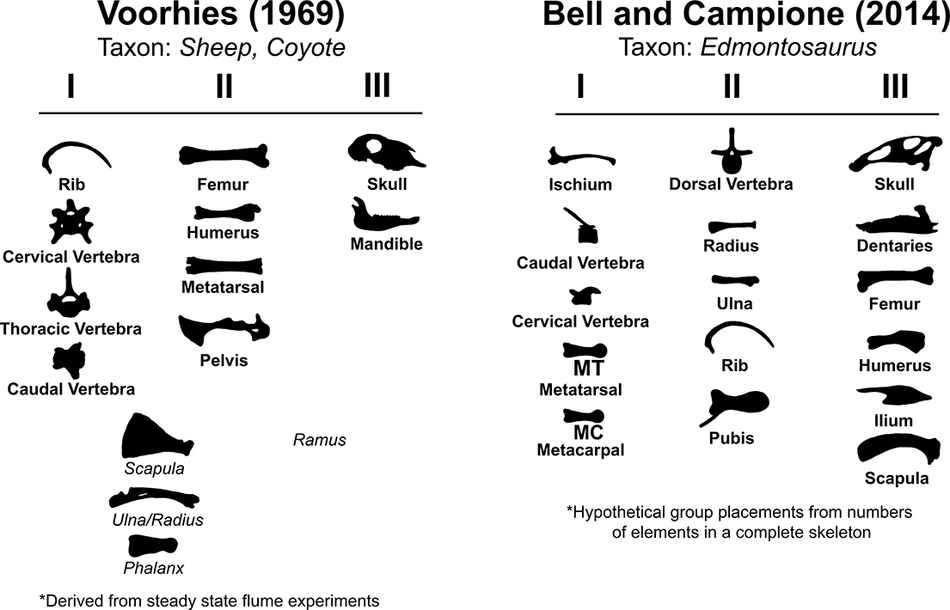
Establishing a taphonomic history of a given site, including degrees of allochthony versus autochthony, is an important step in interpreting fossil data. For more than 50 years, researchers have used actualistic experiments to characterize movement of modern bones in water flow. The use of flumes for this was popularized by the foundational work of Voorhies (Reference Voorhies1969), who used a shallow flume to document the transport potential of coyote (Canis latrans) and sheep (Ovis aries) skeletons in steady-state flow (Supplementary Table 1). Based on experimental results showing that skeletal elements differed in their tendencies to be entrained and move in a steady flow, Voorhies organized bones into three qualitative categories based on their relative transport modes (later dubbed “Voorhies Groups”) (Behrensmeyer Reference Behrensmeyer1975; Fig. 1). Bones in Group I tended to move rapidly via saltation or floatation. Group II tended to move more gradually along the streambed, and Group III was not very susceptible to transport (Voorhies Reference Voorhies1969). This was, in practice, a qualitative measure of critical mobility, the flow conditions under which an object will commence motion (Shields Reference Shields1936; Mantz Reference Mantz1977). In studies regarding bone transport, this has often been quantitatively measured as the dimensional critical flow velocity (Dodson Reference Dodson1973; Blob Reference Blob1997; Blob et al. Reference Blob, Espinoza and Iijima2022). Subsequent authors have sought to further refine this idea via new metrics such as teeth:vertebrae ratios (T/V) and fluvial transport indices (FTI) (Behrensmeyer Reference Behrensmeyer1975; Behrensmeyer and Dechant-Boaz Reference Behrensmeyer, Dechant-Boaz, Behrensmeyer and Hill1980; Frison and Todd Reference Frison and Todd1986). Voorhies Groups remain a widely used tool to interpret fluvial sorting in the fossil record, being cited hundreds of times in the literature, including in individual taphonomic studies, theses, review papers, and textbooks (e.g., Lehman Reference Lehman1982 Turnbull and Martill Reference Turnbull and Martill1988; Rogers Reference Rogers1990; Eberth et al. Reference Eberth, Rogers, Fiorillo, Rogers, Eberth and Fiorillo2007; Moore and Varrichio Reference Moore and Varricchio2018; Titus et al. Reference Titus, Knoll, Sertich, Yamamura, Suarez, Glasspool, Ginouves, Lukacic and Roberts2021). Many researchers implement them in a broad sense, examining which of the three groups dominate a fossil site via between-group ratios, histograms, and ternary diagrams (e.g., Behrensmeyer Reference Behrensmeyer1975; Lehman Reference Lehman1982; Coombs and Coombs Reference Coombs and Coombs1997; Fiorillo et al. Reference Fiorillo, Padian and Musikasinthorn2000; Ryan et al. Reference Ryan, Russell, Eberth and Currie2001; Ziegler et al. Reference Zeigler, Lucas, Heckert, Henrici, Berman, Lucas, Zeigler, Lueth and Owen2005; Evans et al. Reference Evans, Eberth and Ryan2015; Stanistreet et al. Reference Stanistreet, Stollhofen, Njau, Farrugia, Pante, Masao, Albert and Bamford2018). Others utilize them in statistical testing, such as comparing expected distributions of Voorhies Groups in an organism’s complete skeleton with the actual distribution of the organism’s bones at a fossil quarry via chi-squared tests (Bell and Campione Reference Bell and Campione2014; Holland et al. Reference Holland, Bell, Fanti, Hamilton, Larson, Sissons, Sullivan, Vavrek, Wang and Campione2021). Some researchers have voiced concerns about the relevance of these groups to the wide variety of untested taxa and flow regimes to which they have been applied in the fossil record (Eberth et al. Reference Eberth, Rogers, Fiorillo, Rogers, Eberth and Fiorillo2007; Myers and Storrs Reference Myers and Storrs2007; Britt et al. Reference Britt, Eberth and Scheetz2009; Evans Reference Evans2015; Snyder et al. Reference Snyder, McLain, Wood and Chadwick2020). Some studies have additionally constructed hypothetical Voorhies Groups for extinct taxa, such as hadrosaur and ceratopsian dinosaurs, via indirect methods such as numbers of elements in a complete skeleton or frequencies of elemental preservation at specific sites (Lehman Reference Lehman1982 Bell and Campione Reference Bell and Campione2014; Fig. 1).
Voorhies Group placements of skeletal elements tested here after Voorhies (Reference Voorhies1969) and Bell and Campione (Reference Bell and Campione2014). Elements noted in italics are intermediate between two groups, after Voorhies (Reference Voorhies1969).

Subsequent bone transport studies (Dodson Reference Dodson1973; Behrensmeyer Reference Behrensmeyer1975; Hill and Walker Reference Hill and Walker1972; Boaz and Behrensmeyer Reference Boaz and Behrensmeyer1976; Hanson Reference Hanson, A. K. and A. P.1988; Coard and Dennell Reference Coard and Dennell1995; Coard Reference Coard1999) have noted that both bone density and shape influence transport potential. Evaluating both of these characteristics is important when considering bone transport in flow. The majority of experimental studies in fluvial taphonomy have focused on mammals (Supplementary Table 1). Fewer bone transport studies have examined modern reptiles, birds, and amphibians, and these have found notable differences between their mobility tendencies and those of mammals due to differing skeletal morphologies (Dodson Reference Dodson1973; Trapani Reference Trapani1998; Blob Reference Blob1997; Blob et al. Reference Blob, Espinoza and Iijima2022. For instance, reptile skulls disarticulate postmortem more readily compared with articulated mammal skulls, resulting in elements with differing transport potentials compared with a more articulated skull (Peterson and Bigalke Reference Peterson and Bigalke2013). Unique morphologies may additionally affect the mobility and transport potentials of extinct taxa.
Unsteady flow regimes (channelized floods, overbank floods, levee breaches, debris flows, etc.) have significant impacts on landscape morphology and have been invoked to explain geologic and taphonomic observations at fossil quarries, making their potential interactions with bones important to understand in terms of transport and burial (Allen Reference Allen1965; Badgley Reference Badgley1986; Turnbull and Martill Reference Turnbull and Martill1988; Andrews and Ersoy Reference Andrews and Ersoy1990; Behrensmeyer and Hook Reference Behrensmeyer, Hook, Behrensmeyer, Damuth, DiMichele, Potts, Sues and Wing1992; Smith Reference Smith1993; Fastovsky et al. Reference Fastovsky, Clark, Strater, Montellano, Hernandez R. and Hopson1995; Coombs and Coombs Reference Coombs and Coombs1997; Ryan et al. Reference Ryan, Russell, Eberth and Currie2001; Rogers Reference Rogers2005; Gangloff and Fiorillo Reference Gangloff and Fiorillo2010; Flaig et al. Reference Flaig, Fiorillo and McCarthy2014; Evans Reference Evans2015; Shen et al. Reference Shen, Törnqvist, Mauz, Chamberlain, Nijhuis and Sandoval2015; Bennett et al. Reference Bennett, Timothy, Davies, Milward, Clack, Smithson and Marshal2016; Huttenlocker et al. Reference Huttenlocker, Henrici, Nelson, Elrick, Berman, Schlotterbeck and Sumida2018; Snyder et al. Reference Snyder, McLain, Wood and Chadwick2020). While Voorhies Groups were created from tests in a shallow open-channel flow, they have been applied to bone assemblages resulting from a diverse range of flow regimes in the literature, including static marshes, flooding, debris flows, and lahars (e.g., Lehman Reference Lehman1982; Ryan et al. Reference Ryan, Russell, Eberth and Currie2001; Lauters et al. Reference Lauters, Bolotsky, Van Itterbeeck and Godefroit2008; Mukherjee and Ray Reference Mukherjee and Ray2012; Stanistreet et al. Reference Stanistreet, Stollhofen, Njau, Farrugia, Pante, Masao, Albert and Bamford2018). In our opinion, this broad application of Voorhies Groups to such widely different flow conditions reflects a dearth of experimental bone transport studies in unsteady flows and demonstrates a need to test how different flow conditions interact with skeletal elements of different taxa.
Here we investigated the mobility of bones of two vertebrate taxa in floodplain environments exposed to shallow unsteady flows, as might occur due to a levee break, overbank flood, or flash flood. Using new actualistic experiments in a large-scale controlled flume environment, we measured and compared modes of mobility, transport distances, and transport groups among modern sheep bones and hadrosauroid dinosaur bone models in repeated sheet floods of varying intensity. Moreover, we used statistical tests to evaluate whether any resulting transport groups are comparable to those originally defined by Voorhies (Reference Voorhies1969).
Materials and Methods
Hadrosauroid Bone Models
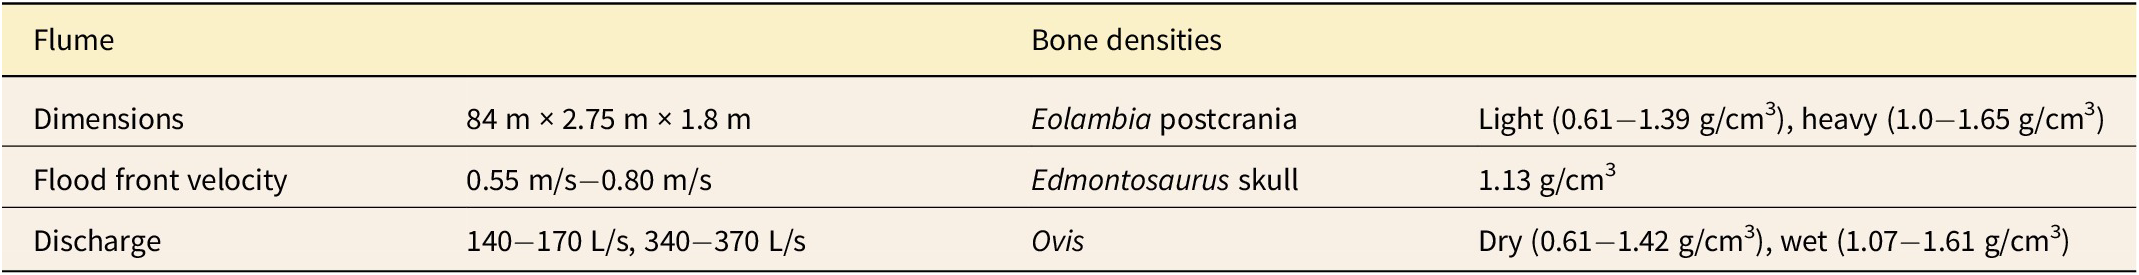
To explore bone transport in a common extinct taxon with differing morphologies from previously tested organisms, hadrosauroid bone models were 3D printed from surface scans of juvenile Eolambia caroljonesa postcranial bones (Supplementary Fig. 1). For comparison between articulated and disarticulated skulls, cranial elements of Edmontosaurus regalis were 3D printed to remedy the lack of a complete skull in Eolambia (Rybczynski et al. Reference Rybczynski, Bloskie, Tirabasso, Bloskie, Cuthbertson and Holliday2008; Supplementary Fig. 2). Skull elements were printed in both articulated and disarticulated states. Bones were scaled to a femur length of 20 cm using linear regressions on a dataset of bone length measurements in hadrosauroids as a whole. We tested these alongside a modern sheep skeleton (Ovis sp., SMM Z2025:2:1) with a similar femur length in order to compare how changes in bone morphology affect transport potential in animals of similar size.
Due to the importance of bone density in studies of bone transport, establishing reasonable densities for the hadrosauroid bone models was crucial (Dodson Reference Dodson1973; Behrensmeyer Reference Behrensmeyer1975; Boaz and Behrensmeyer Reference Boaz and Behrensmeyer1976; Hanson Reference Hanson, A. K. and A. P.1988; Coard and Dennell Reference Coard and Dennell1995; Coard Reference Coard1999). Bone density can vary due to interspecific differences and hydration state (wet vs. dry). Therefore, we created two sets of postcranial bone models to capture a feasible range of densities that could be expected under real-world conditions (Table 1). One set was developed to simulate dry hadrosauroid bone based on domestic sheep bulk bone densities. The second set was developed to simulate fully saturated bones comparable to the domestic sheep bones used by Behrensmeyer (Reference Behrensmeyer1975). For bones where dry bulk densities were found to be higher than Behrensmeyer’s wet densities, such as the rib, bone density was increased in the heavier set of bone models by as close to a set amount (0.15 g/cm3) as possible. For bones where our measured water-saturated sheep bones were found to have higher density values than Behrensmeyer’s bones, we used the higher of the two. Lead shot (2.3 mm diameter) was spaced at even intervals across each bone model to approximate the appropriate bulk density. Cranial bones were too thin for lead shot at the scale used in this study, so we 3D printed these in Formlabs Clear Resin, which has a constant density within the range of bone (Formlabs 2022; Supplementary Fig. 2). See Supplementary Table 2 for density values.
Experimental variables including flow conditions and ranges of bone densities.

Experimental Design
Controlled flume experiments were conducted in the Main Channel at the Saint Anthony Falls Laboratory in Minneapolis, Minnesota, in July through August of 2024. This straight flume (2.75 m wide × 1.8 m deep × 84 m long) connects directly with the Mississippi River through a controlled upstream gate that was opened and timely closed to reproduce the sheet floods (Fig. 2). We monitored a 25-m-long section of the flume to quantify bone mobility and transport over the relatively flat bed surface. The width of the test section is about 15 times larger than the 0.2 m maximum bone length. Experiments were conducted with a bed of fine-medium sand, and sediment was not recirculated. We ran repeated 3- to 5-minute-long sheet floods, with a starting state of a dry, flat bed with no standing water. Small bedforms such as ripples typically developed in each experiment and were removed before starting the next trial. A Raspberry Pi computer with an analogue measurement module recorded upstream gate height (which determines how much water flows into the flume) and flow rate.
Experimental setup and flow conditions. A, The Main Channel flume at St. Anthony Falls Laboratory during a sheet flood experiment. B,C, Overhead view of a high-discharge sheet flood experiment used to calculate flow velocity by image cross-correlation at different upstream (U) and downstream (D) locations. D, Flow velocity calculated by image cross-correlation over the course of a low-discharge (QL) flood experiment. E, Flow velocity calculated by image cross-correlation over the course of a high-discharge (QH) flood experiment. F, Temporal evolution of flow discharges for low (max Q = 140–170 L/s) and high (max Q = 340 L/s) flow experiments. G, Temporal evolution of the water depth estimated using an ultrasonic MassaSonic level sensor during low- and high-discharge flood experiments.

Repeated experimental runs were completed at two peak flow rates for low- and high-density hadrosaur bones (n = 30), cranial hadrosaur bones (n = 5), and modern sheep bones (n = 30) (Fig. 2). Water depth, flow velocities, and sediment size were all similar to Voorhies’s original experiments (Supplementary Table 1). Low-discharge experiments (130–170 L/s) reached peak flood front velocities of ~0.55 m/s, while high-discharge experiments (340–370 L/s) reached peak flood front velocities of ~0.8 m/s (Fig. 1). Flow discharges were chosen based on multiple factors, including both preliminary observations of bone transport and characteristics of real-world floods. Initial experiments above 400 L/s discharge (>1 m/s flow velocity) resulted in nearly all bones leaving the experiment area, meaning that little could be assessed regarding bone sorting patterns. As a result, we chose to test below these conditions. Most real-world flash floods tend not to exceed 3 m/s in flow velocity, and velocities well below 3 m/s have been modeled for flows in and around crevasse channels (Lumbroso and Gaume Reference Lumbroso and Gaume2012; Millard et al. Reference Millard, Hajek and Edmonds2017). For the type of bones tested here, our experimental floods are within the bounds of realistic flow velocities and previous flume experiments in steady state that that serve as our targets for comparison.
Bones were spaced at intervals of ~0.5 m in the downstream direction, as well as staggered laterally to reduce the likelihood of interference among bones. The flume’s headgate was raised and lowered in order to create a sheet flood that traveled the length of the flume. The timing of headgate raising was varied to create flows of higher and lower discharges. Flood front propagation velocity and depth were recorded using an ad hoc particle image velocimetry algorithm applied to video recording of the advancing front, and an ultrasonic MassaSonic level sensor estimating the water surface elevation (Fig. 2G).
Transport groups have generally been defined by either qualitative observations of mode of bone movement or measured critical velocities (which we define here as the lowest flow velocity at which an object will mobilize). Critical velocities are difficult to measure with any precision in unsteady flows, so we first characterized bones by their modes of transport. In qualitatively describing bone shapes relative to their modes of mobility, we utilized common shape categories used previously in the literature, including elongate, flattened/platy, and compact/equidimensional bones (Sneed and Folk Reference Sneed and Folk1958; Blob and Fiorillo Reference Blob and Fiorillo1996). We then quantitatively examined transport potential via the metric of transport distance, which was also used by Frison and Todd in their unsteady-state flow experiments in a small stream channel (Frison and Todd Reference Frison and Todd1986). Distances traveled by each bone were recorded for 10 trials each for the low- and high-density sets of postcranial hadrosaur bones and 5 trials each for the hadrosaur crania, dry sheep bones, and water-saturated sheep bones. During the dry sheep skeleton trials, we air-dried the bones after each trial until the measured mass of the bones reached initial conditions. Because bones in and around real-world fluvial systems may be exposed to repeated unsteady-state flows before becoming stopped or buried, we ran an additional set of experiments in which bone transport distance was tracked for comparison between one long flood pulse (5 min) and three short pulses consistent with the low discharge trials between which bone positions were not reset (100 s each).
Measurements and Analysis
Final positions and orientations of bones were measured after each experiment using ImageJ from the photogrammetry scans taken using the Polycam 3D Scanner app, LiDAR, 360 (3.3.2) (Schneider et al. Reference Schneider, Rasband and Eliceiri2012) on an iPhone 11. Orientations of bones were measured along the longest axis. Pairwise t-tests to test for the presence of transport groups and Spearman’s rank correlation analyses to test for correlations between bone characteristics and transport distances were performed in R (v. 4.1.2; R Core Team 2023). Hermans-Rasson tests to examine whether bones stopped in preferential orientations were conducted using the package CircMLE (Fitak and Johnsen Reference Fitak and Johnsen2017; Landler et al. Reference Landler, Ruxton and Malkemper2019).
Results
Modes of Mobility
The types of movement exhibited by the dinosaur bone models or sheep bones were organized into several generalized categories relating to modes of mobility, most of which are consistent with prior literature (Fig. 3). Considering the varying flow conditions inherent to an unsteady-state flow, a given bone could exhibit several of these mobility modes during its exposure to flow.
Bone transport modes in unsteady flow. A, Transport modality categories observed during sheet flow experiments. B, Sequence of mobility modes exhibited by a hadrosauroid femur model from initiation of motion through stabilization.

Large and dense bones tended to drag as their primary mode of transport under the tested flow conditions. Elongate bones often reoriented parallel to flow during this process (Fig. 3). Many compact or elongate bones that dragged were also capable of rolling (we define rolling here as rotational movement along one axis). Irregularly shaped bones that had the ability to roll given high enough flow rates, such as skulls, tended to shift laterally while rolling downstream. This, in addition to lateral movement of the sheet flow itself, led some bones to be moved laterally toward the flume walls in some runs (Fig. 4). Some bones with asymmetrical shapes, regardless of whether they were generally elongate or flattened, could additionally tumble. We define tumbling as rotational movement along more than one axis, as opposed to rolling. Certain bones (due to low density, flattened or very elongate shape, or both) such as hadrosaur pelvic bones and scapula were carried along with the flood front, gliding just above the bed surface for the majority of transport time. These bones may either have been trapped by vortices associated with the advancing flood front, entrained in the flow due to the lift force, or some combination of both. Differentiating between these two modes was not possible in the unsteady-state conditions under which our experiments operated. However, observed transport distances for these bones were high in either case, and thus we refer to this collectively as vortex trapping and suspension (Fig. 3). Many other bones tended to be outpaced by the flood front relatively rapidly, at which point motion slowed and eventually ceased.
Final resting positions, spatial distribution, and final orientation of hadrosauroid bone models under low- (140–170 L/s) and high-discharge (340–370 L/s) flows. A,C, Low- and high-density bone final locations at low discharge. B,D, Low- and high-density bone orientations at low discharge. E, High-density bone distances at high discharge. F, High-density bone orientations at high discharge. Arrows indicate flow direction. Differing sample sizes resulted from different numbers of elements leaving the experiment area based on flow discharge.

Travel Distance and Transport Groups
In general, travel distances were relatively gradational across the suite of bones we tested in the sheet flow experiments. Under higher flow conditions, differences in transport distances between bone types were exaggerated, especially between bones that left the experiment area and those that did not (Fig. 5). Iterative pairwise t-tests between the average transport distance of each postcranial bone type against all other bones led to the recognition of two transport groups among the hadrosaur bone models. Each group includes bones that do not significantly vary in transport distance from most other bones in their group, but do vary significantly from bones in the other group. The two groups were a “low-transportability” group, which exhibited relatively shorter transport distances, and a “high-transportability” group, which exhibited longer transport distances. These groups also generally correspond with transport modes exhibited by specific elements. Postcranial bones in the low-transportability group tended to roll or drag and were quickly left behind by the flood front, whereas bones in the high-transportability group tended to move downstream via vortex suspension and tumbling in addition to dragging.
Travel distances and identified transport groups during sheet flood experiments. A, Dry sheep bones at low discharge. B, Water-saturated sheep bones at low discharge. C, Water-saturated sheep bones at high discharge. D, Low-density hadrosaur bones at low discharge. E, High-density hadrosaur bones at low discharge. F, High-density hadrosaur bones at high discharge. Box plot color depicts Voorhies Group identity (after Voorhies Reference Voorhies1969). Dotted lines indicate soft separations between low- and high-transportability distance-based groups in the hadrosauroid bones derived from this study, with “intermediate” bones between them.

Some bones were not significantly different from either high- or low-transportability elements, making them impossible to consistently place into either group (Figs. 4, 5). We refer to these bones as “intermediate,” as they do not form a statistically defined group, instead varying in how far they were transported between flow conditions (Fig. 5). It is worth noting that the creation of these three groups necessitated some level of arbitrary decision making about which bones should be considered intermediate, due to large amounts of overlap in transport distance between elements. This resulted in some variation in these groups between the different test flow conditions, especially with regard to intermediate bones. As a result, elements with the highest and lowest transport distances are likely the best indicators of sorting in the suite of bones we tested.
We repeated this same procedure for 11 Edmontosaurus cranial elements (the articulated skull, articulated mandibles, and 9 disarticulated elements) at 140–170 L/s discharge and were able to assign similar groupings within the skull (Fig. 6). Elements falling into a similar low-transportability group as the postcranial bones moved relatively little, such as the articulated skull, the articulated mandibles, and the neurocranium, whereas ones that formed a high-transportability group, such as the nasal, premaxilla, and quadrate, rolled or tumbled rapidly downstream for higher distances. As for the postcranial bones, two intermediate bones (the maxilla and pterygoid) were unable to be distinguished from either group.
Total distance moved and identified transport groups for Edmontosaurus regalis cranial element models at low-discharge flow (140–170 L/s). A, Final resting positions of cranial elements at low discharge. Arrow indicates flow direction. y-axis = 2.75 m. B, Distances traveled by cranial elements. Dotted lines indicate soft separations between low- and high-transportability distance-based groups in the hadrosauroid bones derived from this study, with “intermediate” bones between them.

Distance-based groups were not statistically resolved for either the dry or wet sheep bones under similar conditions. Using the same statistical methods, only a caudal vertebra formed a high-transportability group, while all other bones fell into the low-transportability group or were unable to be differentiated from either. Statistically distinct groups beyond this were not recovered regardless of flow rate, both when including or excluding the caudal.
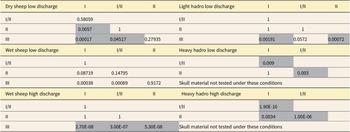
Voorhies Group classifications of the bones did not correlate consistently with transport distance in our sheet flood experiments, despite water depths and flow velocities approximating those in the original study (Fig. 5, Supplementary Table 1). Pairwise t-tests of distances traveled and Voorhies Group identity in the sheep bones indicate that while Group III elements typically moved significantly shorter distances than Group I and II elements, Groups I and II only traveled statistically different distances during one set of flow conditions (dry bones under low-discharge flow) (Table 2). When the same statistical analysis were conducted on the hadrosaur bones, Groups I and II were also only differentiable under the high-discharge conditions. Additionally, the distance-based transport groups in the hadrosaur postcrania we assigned do not correlate well with the original Voorhies Groups. The hadrosaur-specific Voorhies Groups created by Bell and Campione (Reference Bell and Campione2014) match slightly better, but there are still notable differences in group composition, such as the presence of ilia in Group III (which tended toward the “high transportability” group in our experiments). Groups I and II are also poorly differentiable from each other as with the original Voorhies Groups.
The p-values for pairwise t-tests between travel distances for hadrosauroid and sheep bones by original Voorhies Group identity.

Controls on Mobility
Spearman’s rank correlation tests for density versus number of bone lengths traveled demonstrated that density significantly impacted transport distance for both the hadrosaur and sheep (Table 3). Identical tests for mass versus number of bone lengths traveled showed an even stronger negative relationship, suggesting an important influence of bone size in addition to density (Table 3). Shape additionally impacted transport distance in the flume experiments. We used size-normalized centroid height (centroid height/bone volume) as a metric for the extent to which bones extended into the water column. Spearman’s rank correlation tests showed a significant positive relationship with number of bone lengths traveled among both sets of bones in all tests, indicating that a higher drag surface exposed to more of the velocity gradient resulted in larger transport distances relative to bone size (Table 3). All these parameters had similar magnitudes of effect on transport distances, and it is worth noting that they are not necessarily independent of each other, being intertwined characteristics of the bones.
Results of Spearman’s rho tests for size normalized transport distance and bone characteristics in hadrosaur bone models and sheep bones.

Variables: $ \frac{D}{L}=\frac{\mathrm{Transport}\ \mathrm{distance}}{\mathrm{\operatorname{Max}}\;\mathrm{bone}\ \mathrm{length}}; $ $ V=\mathrm{Volume}; $ $ \rho =\mathrm{Density}; $ $ {H}_c= $
Bone centroid height.
$ {H}_c= $
Bone centroid height.
Bone Orientations
Hermans-Rasson tests indicated that bones that were longer than they were wide were likely to come to rest near parallel to flow along the largest major axis (Landler et al. Reference Landler, Ruxton and Malkemper2019; Fig. 4, Table 4). Many low-density bones quickly oriented parallel to flow. In contrast, the high-density set of bones did not reorient to flow as often at low discharges. Near-cylindrical limb bones commonly oriented themselves to flow, whereas individual elongated skull elements did not consistently orient parallel to flow. At higher discharges, even high-density bones were more likely to orient parallel to flow (Fig. 4). Orientation to flow often also coincided with cessation of movement, likely due to a decrease in surface area exposed to flow when bones with a longer major axis reoriented to be parallel with flow (Fig. 3).
Results of Hermans-Rasson tests for bone orientations after three sets of sheet flood experiments.

Observed Modes of Burial and Bone Interactions
In the sheet floods, elements that stopped moving during flow would often exhibit scouring. Bones that anchored in place by scouring could then be partly buried by scoured sediment after one or multiple floods (Fig. 7). This occurred most intensely in large bones with low transport potentials (such as the sheep skull), although smaller bones could also experience this process to varying degrees so long as they were stationary. Partial burial could also be achieved quickly via entombment by migrating bedforms, especially for smaller elements that were easily caught between migrating ripples, which is consistent with observations in prior literature (Behrensmeyer Reference Behrensmeyer1975; Trapani Reference Trapani1998; Carpenter Reference Carpenter2020). During repeated flood experiments where bone positions were not reset between trials, burial could also be undone with the movement of bedforms causing reexposure of bones to flow, allowing reinitiation of motion in the next flood (Fig. 7). However, travel distances notably decreased in subsequent floods, suggesting that scouring and reorientation contributed to stabilization of a bone after its first flood exposure Larger bones such as limbs and the sheep pelvis would occasionally interact during movement, creating “bone jams,” resulting in lower transport distances and triggering scouring around the bones (Fig. 7). These bone jams are notably similar to some bonebeds in the fossil record (e.g., Carpenter Reference Carpenter2013).
Burial via scouring and bone interaction. A, After rolling for 20 m, this high-density hadrosauroid dorsal vertebra became stuck and began to scour during three consecutive experiments. Blue highlighted area indicates scour pit. B, In a subsequent flood, scouring continued, and sediment redeposited on the downstream side, partly burying the bone. Red highlighted indicates area of burial due to downstream sediment deposition. Note the scour pit becoming partly engulfed by advancing ripples. C, Large bones such as the sheep skull were not allowed enough time or high enough flow velocity to bury themselves, but were anchored into a scour pit with sediment depositing downstream. Blue highlighted area indicates scour pit, while red highlighted indicates area of downstream sediment deposition. D, Large bones such as limb bones and the sheep pelvis would occasionally interact, creating “bone jams.” Arrows indicate flow direction in all images.

Discussion
Preferential sorting of skeletal elements and degrees of allochthony and autochthony due to transport and winnowing are critical aspects of the fossil record that must be appreciated if we are to correctly interpret paleoecology and preservation bias, as Voorhies recognized in his foundational experiments. How bones of varying morphologies behave in different flow types influences what patterns, such as transport groups, may be recoverable in the fossil record. Our experiments aimed to examine this in the context of disarticulated vertebrate material in unsteady flows.
Spatial Patterns from Bone Transport in Unsteady Flows
We found that flow conditions influenced travel distance for bones of both hadrosaur and sheep. Under higher flow conditions (0.8 m/s), distances traveled by more mobile elements were exaggerated compared with lower flow experiments (0.55 m/s), and bones commonly left the experiment area entirely (Fig. 5). Less mobile bones showed a comparatively lower increase in travel distance under higher flow conditions. Differences in shape and density contribute to variability in transport distance and transport mode under various flow conditions, with those that tumbled or showed vortex suspension often moving more readily downstream than those that dragged or rolled. Less mobile bones (such as the articulated sheep and hadrosaur skulls) induced scouring, which could anchor them to the bed even under higher flow velocities.
In our experiments and in real-world flow situations, there are two main differences between steady-state flows and the unsteady flows we tested. The first of these is the starting condition of a high-energy front characterized by an advancing vortical flow initiating motion for bones positioned on dry sediment, as opposed to bones entering an existing channel flow via processes such as bank collapse, predation, being washed in from surrounding floodplains, or in experimental studies, being placed directly into flowing water by researchers. In the case of flows that cut through crevasse channels, bones could also be sourced from within the breached levee itself and be reworked into the resulting crevasse splay deposit (Behrensmeyer and Hook Reference Behrensmeyer, Hook, Behrensmeyer, Damuth, DiMichele, Potts, Sues and Wing1992). The second is the varying flow rate once bones are exposed to flow. In floods, bones are exposed to a range of flow velocities, potentially moving from above critical velocity conditions to below the mobility thresholds for bones and the sediments surrounding them. In our experiments, we observed how this could cause bones to exhibit a range of potential modes of mobility across the duration of their movement, eventually leading to reorientation to flow, cessation of movement, and sometimes partial burial once a stable position was reached (Fig. 3).
Sheet flows are temporary, being composed of an initial surge of water followed by a deceleration in flow. In the real world, the length of time that flow is maintained depends on the setting and discharge of water introduced from upstream. Seasonal flash flood events in dry channels often have life spans from minutes to hours, while crevasse channels may be active for repeated periods of days to weeks across several years (e.g., Lucchitta and Suneson Reference Lucchitta and Suneson1981; Arnaud-Fassetta Reference Arnaud-Fassetta2013; Nienhuis et al. Reference Nienhuis, Törnqvist and Esposito2018). In the case of flows through crevasse channels and levee breaches, bones may also encounter variation in flow rate due to lateral movement into less-confined low areas, encountering lower-velocity flow and potentially ponded water (Arnaud-Fassetta Reference Arnaud-Fassetta2013; Yuill et al. Reference Yuill, Khadka, Pereira, Allison and Meselhe2016; Millard, et al. Reference Millard, Hajek and Edmonds2017; Nienhuis et al. Reference Nienhuis, Törnqvist and Esposito2018). The presence of bedforms and other obstructions can restrict bone movement beyond what might be expected under ideal conditions, as we observed even in a simplified straight flume environment. In real-world flow environments, factors limiting potential movement are heightened, and these trapping mechanisms, such as logjams, have been invoked in the fossil record as explanations for accumulations of vertebrate material in channels (Fiorillo Reference Fiorillo1991; Mathews et al. Reference Mathews, Brusatte, Williams and Henderson2009). In overbank flooding and levee breach situations, the presence of vegetation and other barriers (debris, other bones, etc.) could exaggerate this restriction of potential transport even further.
Single crevasse splay deposits are often geographically small (average of 0.61 km2; Rahman et al. Reference Rahman, Howell and MacDonald2022), and even if bones exposed to an overbank flood that would deposit a splay were transported the splay’s full length, this likely would not be classified as being ecologically “out of habitat” (Millard et al. Reference Millard, Hajek and Edmonds2017; Rahman et al. Reference Rahman, Howell and MacDonald2022). Crevasse splay complexes (which form over longer spans of time) have the potential to be much larger (average of 39 km2; Rahman et al. Reference Rahman, Howell and MacDonald2022), and thus bones with high transport potentials could theoretically move higher distances if left exposed across the life span of the system of stacked splays. Other sufficiently extreme overbank flows could also transport bones longer distances, although these are not the kinds of floods we examined in our experimental setting. Large transport distances could also be achieved in flooding situations in carcasses sourced from far upstream and moved onto a floodplain via overbank flooding, particularly if they are transported via floatation.
More specific tests of whether remains found in overbank flood deposits are “in habitat” or “out of habitat” for organisms with unknown ranges are difficult to envision. Habitat boundaries shift over geologically short timescales, and it is not always possible to define these boundaries geologically, especially moving further back into deep time (Behrensmeyer and Dechant-Boaz Reference Behrensmeyer, Dechant-Boaz, Behrensmeyer and Hill1980). However, allochthony and autochthony are often purposefully broadly defined in taphonomic literature, not relying on prior knowledge of precise habitat boundaries for specific organisms (Behrensmeyer Reference Behrensmeyer, Allison and Briggs1991). In recent deposits where sufficient data resolution is present, it may be possible to evaluate whether there is transport across ecotones, such as between channel and floodplain habitats, and further work is necessary in modern ecosystems to test whether bone distributions in fluvial habitats match where different species occur. More broadly, degrees of transport and sorting can be discussed in relative terms between fossil localities for more comparative utility so long as researchers clearly define allochthony and autochthony for their sites with respect to available data and spatial and temporal resolution.
In both crevasse splay deposits and more general levee overflow deposits, sediments thin distally, suggesting that complete bone burial (especially of larger bones) is most likely in more proximal regions of a given flood deposit (Burns et al. Reference Burns, Mountney, Hodgson and Colombera2017; Millard et al. Reference Millard, Hajek and Edmonds2017; Yamada et al. Reference Yamada, Naruse, Kuroda, Kato, Matsuda, Shinozaki and Tokiwa2023). If sorting akin to what we observed in our experiments occurs in these conditions, this may preferentially favor burial of less mobile bones (articulated skulls, mandibles, large limb bones, etc.), while more mobile bones are transported to the flanks of the deposit where sediment thickness is lower and complete burial is less likely (Fig. 8). Behrensmeyer (Reference Behrensmeyer1975) observed trends similar to this in floodplain components of Kenyan Plio-Pleistocene fossil beds, with Voorhies Group I bones (typically considered as high transport potential) being preferentially poorly represented in comparison to less mobile bones (especially teeth); similar high frequency of low-mobility elements relative to expected values has been noted in other floodplain bonebeds (e.g., Smith Reference Smith1993; Horner et al. Reference Horner, Goodwin and Myhrvold2011; Bell and Campione Reference Bell and Campione2014; Driebergen Reference Driebergen2023). Lower-density elements also tend to occur higher above the burial substrates than denser ones, and thus lighter elements are more likely to be weathered and removed from the system. How much this potential preservation bias toward less mobile elements in floodplain deposits may affect systematics depends largely on how evenly distributed important characters are distributed across the skeletons of taxa of interest (Woolley et al. Reference Woolley, Bottjer, Corsetti and Smith2024).
Potential localized bone sorting patterns in an overbank flood caused by a levee breach.

While typical floods may be unlikely to transport disarticulated material out of habitats that are discernable in the fossil record, it is worth noting that they would certainly be able to transport bones locally beyond the bounds of a paleontological excavation area. For practical reasons, quarries often focus on areas where fossil material is densest, maximizing the data collected and minimizing the time and effort required to do so. However, if more mobile material is readily transported to the flanks of flood deposits (if it is preserved at all), this may result in a bias toward collecting bones with low transport potential and any material that remained behind with them in more proximal areas (Horner et al. Reference Horner, Goodwin and Myhrvold2011).
Floods are often seasonal, and bones may encounter multiple floods before final burial can occur. Results from our repeated flood experiments with bones not repositioned between trials showed that bones that reached stable positions (due to reorientation relative to flow, bedforms, lateral movement toward channel walls, or other factors) were unlikely to move as far in subsequent floods of the same magnitude (tens of bone lengths rather than hundreds) (Fig. 9). Frison and Todd (Reference Frison and Todd1986) saw similar results in Indian elephant (Elephas maximus) bones subjected to multiple floods in a narrow channel, suggesting that the first initiation of movement in unsteady-state flows may be the most impactful on total transport distance unless bones are exposed to a flood sufficiently large to remobilize them from a stable position. We also observed that stable bones often underwent some degree of scour burial, especially ones that became stable during an initial flood (Figs. 7, 9). Despite observations of partial burial due to scouring and bedform movement, no instances of complete burial occurred in our experiments, suggesting that scouring may be most impactful in restraining further movement rather than causing final burial in absence of high sediment load. Scouring may also contribute to abrasion from sediment movement around immobile bones. Repeated seasonal flooding events have been observed shaping bone assemblages on modern landscapes, and these types of periodic floods and debris flows have been hypothesized to contribute to the formation of terrestrial fossil sites (Gifford and Behrensmeyer Reference Gifford and Behrensmeyer1977; Coombs and Coombs Reference Coombs and Coombs1997; Rogers Reference Rogers2005; Bell and Campione Reference Bell and Campione2014; Evans et al. Reference Evans, Eberth and Ryan2015). As such, this kind of pulsed movement with an emphasis on the first exposure to flow and potential burial in successive flows is important to consider in the fossil record.
Pulsed flood experiments. Number of bone lengths traveled by bones in three successive short flood pulses (1 min, 40 s each at 220 L/s max discharge) and one long flood pulse (5 min at 220 L/s max discharge). Transport distances tended to decrease in subsequent floods once bones became stable in the initial sheet flood. Final orientations for bones in each experiment are indicated on rose diagrams and are colored by experiment number. Hadrosauroid bones labeled “L” indicate low density, and ones labeled “H” indicate high density. Arrows indicate bones that moved out of the experiment area. Asterisks indicate bones that moved laterally and encountered the flume walls.

Transport Groups and Their Use in the Fossil Record
Based on transport distances, we assigned low-transportability, intermediate-transportability, and high-transportability groupings in hadrosauroid bone models in each of our experiments (Fig. 5). Transport groups were impossible to assign in a consistent fashion among the sheep bones tested during the experiments using the same methods, as they exhibited a more gradual spectrum of transport distances with strong overlap between different elements. Differences in morphology between hadrosauroid and sheep skeletons appear to play a role in some differences in mobility behaviors between the two. This is consistent with critical velocities in alligator (Alligator mississippiensis) bones differing from similar bones in mammals based on bone shape (Blob et al. Reference Blob, Espinoza and Iijima2022). For instance, the pelvic bones of reptiles are not fused as in mammals, and we found that the pelvic elements of our hadrosauroid models were very mobile in sheet floods due to their flattened and or highly elongate shapes, exhibiting vortex trapping and suspension (Figs. 3, 5). Additionally, disarticulated skull bones display their own suite of transport distances due to their decreased sizes and masses (Fig. 6).
Despite the frequent application of Voorhies Groups for interpreting fossil sites, our experiments demonstrate that these groups are not applicable to all taxon and flow regimes. Voorhies Groups were originally based on testing the relative mobility of a limited number of midsized mammalian taxa under a shallow channel flow. Subsequent research expanded the range of species tested and began to use more quantitative measures such as rates of motion, hydraulic equivalence, and critical velocities in addition to the original qualitative groups, resulting in varying group placements among bones of newly tested taxa (Dodson Reference Dodson1973; Behrensmeyer Reference Behrensmeyer1975; Boaz and Behrensmeyer Reference Boaz and Behrensmeyer1976; Blob Reference Blob1997; Trapani Reference Trapani1998; Blob et al. Reference Blob, Espinoza and Iijima2022). However, experimental conditions of these studies varied widely in terms of flow type, flow depth, channel size, and how and where flow velocities were measured across the flow depth (Supplementary Table 1). Additionally, studies assigning the bones of extinct taxa to specific transport groups that differ from Voorhies Groups have tended to do so without the use of actualistic experimentation (Lehman Reference Lehman1982; Bell and Campione Reference Bell and Campione2014).
With these considerations in mind, we show that under the unsteady flow conditions of our experiments, the relationship between critical mobility and distance traveled is complex. Voorhies Groups loosely correlated with the transport distances bones of both our hadrosaurs and sheep were observed to move in the sheet flood experiments. For example, Group III typically moved the least and was often, although not always, differentiable from Groups I and II. However, Voorhies Groups I and II did not travel statistically different distances from each other, making them essentially indifferentiable in practice in both the sheep and hadrosauroid bones (Table 2). Additionally, the distances traveled by the sheep and hadrosaur show limited relationship to the original Voorhies Groups (Reference Voorhies1969) or Bell and Campione’s (Reference Bell and Campione2014) adjusted hadrosaur Voorhies Groups.
The relatively continuous distributions of distances traveled by bones in many of our experiments required some arbitrary decision making in assigning our own distance-based groups for the hadrosauroid bone models, even with the aid of statistical testing. Considering this, the boundaries between our groupings by transport distance are intended to be “soft,” and we recognize a gradient of transport distances for the skeletal elements we tested. Voorhies (Reference Voorhies1969) encountered this issue in his original qualitative assignments of transport groups, with some bones such as the scapula, ulna, phalanges, and ramus, exhibiting behaviors that fell between groups (Fig. 1). Quantitative studies have also observed relatively continuous distributions of bone transport. Blob (Reference Blob1997) and Blob et al. (Reference Blob, Espinoza and Iijima2022) attempted to quantitatively utilize the critical velocities of bones in order to create transport groups among soft-shelled turtles (Apalone spinifera) and alligators. While alligator bones showed relatively clear statistical demarcations between transport groups, the soft-shelled turtle bones were distributed near continuously across the range of measured critical velocities (Blob Reference Blob1997; Blob et al. Reference Blob, Espinoza and Iijima2022). Because of this, creation of discrete categories of mobility was challenging (Blob Reference Blob1997), similar to the near continuously distributed bones in our study.
Since their introduction, Voorhies Groups have been used by researchers as a metric for preferential fluvial sorting of fossil vertebrate remains and thus inferred relative transport distances between skeletal elements. Typically, dominance of Group III bones is interpreted to indicate an essentially autochthonous lag deposit that did not move significantly, and dominance of Group I bones to suggest a significantly winnowed deposit that accumulated some distance away from the bones’ first interaction with flow (Rogers Reference Rogers1990; Coard and Dennell Reference Coard and Dennell1995; Eberth et al. Reference Eberth, Rogers, Fiorillo, Rogers, Eberth and Fiorillo2007). A mix of the three groups is often interpreted to indicate little sorting by fluvial action (Coard and Dennell Reference Coard and Dennell1995; Eberth et al. Reference Eberth, Rogers, Fiorillo, Rogers, Eberth and Fiorillo2007). However, considering that we failed to distinguish Voorhies Groups I and II in most of our experiments, we see little justification for placing hard boundaries between these two groups at fossil sites, especially in sites deposited under unsteady-state flow similar to our experimental conditions.
Frison and Todd (Reference Frison and Todd1986) found relatively continuously distributed transport potentials for most tested elements in unsteady-state flow, and Blob (Reference Blob1997) saw a similar distribution in critical velocities in steady-state flow, again suggesting that quantitative evidence is not definitive for more than two groupings, if any, in experimental studies. Considering that the highest- and lowest-mobility bones were the easiest to differentiate, these extremes may be the most useful for interpretations of fluvial sorting in the fossil record (Table 2). However, given the paucity of experimental studies and the variability of stream flow velocities in natural fluvial environments, these assessments require further investigation. Potential error in estimated high and low densities for the hadrosauroid bone models could also have played a role in differing group assignments, especially considering these were meant to represent the maximum and minimum densities that bones should reasonably exhibit (See Supplementary Table 2). Voorhies additionally did not note the size or weathering state of the sheep and coyote bones he examined (Voorhies Reference Voorhies1969). While potential differences between specimens in these parameters may have yielded slightly different results, we believe that the primary reasons we do not recover clear transport groups in our sheep relate more to differing transport regimes and the qualitative nature of Voorhies Groups rather than specimen-level differences. Subtle changes in discharge between experiments in such a large-scale experimental setup may explain some variation in transport distances within this study, such as the water-saturated sheep bones traveling slightly farther on average than the dry set in low-discharge conditions (Fig. 5). This may also be explained by the fact that we conducted fewer replicates for the sheep bones than the hadrosaur models (5 trials rather than 10).
Conclusions
In conclusion, bone transport and burial in unsteady flows are driven by a complex set of variables relating to both characteristics of bones themselves and to the flow conditions they encounter. Many of these are shared with more well-studied steady-state flow conditions, but some factors, such as the initiation of motion via an advancing, high-energy flood front and the stabilizing effects of bone reorientation, bedform trapping, and bone jamming leading to stability over the course of multiple floods, may have significant effects on transport and burial. Considering the geographically small size of many overbank flow deposits (like crevasse splays), most bones found within may not be ecologically out of habitat, but preservation bias of less mobile elements may exist due to localized sorting in a given deposit. Voorhies Groups address some broad aspects of bone transport, but due to the limited scope of the original study relative to real-world flow conditions and bone morphologies, applying these broadly qualitative metrics to the fossil record is problematic. More experimental studies on the relationship between transport potentials, bone characteristics, and pathways of accumulation and burial are needed to untangle the factors influencing bone mobility and fossil preservation in fluvial depositional environments.
Acknowledgments
We would like to thank the staff and volunteers at St. Anthony Falls Laboratory for their help in conducting our experiments, especially B. Erickson, J. Prewett, W. Honold, and S. Hudec. We would also like to thank the Minnesota Science Museum for loaning the sheep skeleton for our experiments. We thank Field Museum crews led by PM who excavated the Eolambia bones used in this study in 2014 and 2015 under BLM Permit UT14-023E. We thank J. Driebergen for sharing her unpublished thesis.
Competing Interests
The authors declare no competing interests.
Data Availability Statement
Electronic Supplementary Material is available from the Zenodo digital repository: http://doi.org/10.5281/zenodo.17382288.


 Open access