


I
Financial markets are dynamic environments where regulations continuously evolve, influencing market mechanisms and investor behaviour. Among these regulations, short-selling restrictions have long been a subject of debate, particularly during times of financial distress. Short-selling – the practice of selling borrowed shares with the expectation of repurchasing them at a lower price – is often criticised for exacerbating market downturns and is frequently restricted by regulators in times of crisis (Bris et al. Reference BRIS, GOETZMANN and ZHU2007; Mohamad Reference MOHAMAD2016). However, short-selling also plays a crucial role in price discovery and preventing asset bubbles by allowing investors to express negative views on potentially overvalued stocks (Miller Reference MILLER1977; Boehme et al. Reference BOEHME, DANIELSEN and SORESCU2006; Frino et al. Reference FRINO, LECCE and LEPONE2011).
While short-selling bans aim to curb price declines and stabilise markets, their broader effects on liquidity and price efficiency remain contested. Some scholars argue that such restrictions impair market functioning by widening bid–ask spreads, reducing trading volumes, and delaying price adjustments (Miller Reference MILLER1977; Diamond and Verrecchia Reference DIAMOND and VERRECCHIA1987; Beber and Pagano Reference BEBER and PAGANO2013). Others contend that short-selling bans may filter out predatory traders, thereby improving liquidity for certain stocks, particularly in illiquid markets (Ye et al. Reference YE, ZHOU and ZHANG2020; Fohlin et al. Reference FOHLIN, LU and ZHOU2022).
We revisit these debates in a historical setting where the intervention was self-regulated rather than government-mandated: the short-selling (‘forward selling’) bans introduced by the Sydney and Melbourne stock exchanges (SSX and MSX) in July 1930. Unlike modern regulatory interventions, which are typically imposed by governments and regulators, these bans were self-regulated, implemented independently by the exchanges. Importantly, the bans applied only to investment stocks, with mining shares explicitly exempt, providing a built-in control group. The adoption was staggered, with SSX introducing its ban on 8 July and MSX following on 9 July, and enforcement focused on official call sessions rather than blanket prohibition. By analysing their impact on bid–ask spreads, trading volumes, and daily returns computed from mid-quotes, we assess whether these restrictions achieved their intended goal of market stabilisation or instead hindered market efficiency.Footnote 1
Our results show that bid–ask spreads widened significantly for non-mining firms, with the strongest effects among the most illiquid firms and on SSX, where enforcement was more immediate. In contrast, the MSX experienced weaker and sometimes opposite effects, consistent with short-lived substitution of speculative trading across venues. Trading volumes contracted most for high-volume non-mining and dual-listed firms, indicating that restrictions disproportionately curtailed activity where speculation had previously been most intense. Returns, by contrast, show no systematic impact of the ban. Across specifications, daily stock returns for non-mining firms remained statistically indistinguishable from controls, indicating that the bans altered trading conditions without producing consistent valuation effects. Relative gains were concentrated in non-mining firms with high pre-ban returns on SSX. Our empirical evidence suggests that self-regulated short-selling bans introduced new frictions in liquidity and participation but did not provide meaningful price support. These results highlight the complex and sometimes unintended consequences of self-regulated short-selling bans, contributing to a broader understanding of financial regulation and market dynamics.
The impact of short-selling restrictions on financial markets has been extensively studied, particularly in response to major economic crises. During the Great Depression, short-selling bans were introduced in several markets, including the United States, where Jones (Reference JONES2012) finds that such restrictions widened bid–ask spreads and reduced trading volumes, ultimately harming liquidity. Similarly, during the Global Financial Crisis (GFC) of 2008–9, a number of studies (Battalio and Schultz Reference BATTALIO and SCHULTZ2011; Beber and Pagano Reference BEBER and PAGANO2013; Boehmer et al. Reference BOEHMER, JONES and ZHANG2013) find that short-selling bans increased market volatility and failed to prevent price declines. More recently, during the COVID-19 pandemic, some European countries introduced short-selling restrictions, leading to worsened liquidity conditions (Bessler and Vendrasco Reference BESSLER and VENDRASCO2022). In the Australian context, Henker et al. (Reference HENKER, HENKER and HELMES2011) examine the impact of the GFC-era short-selling ban on the Australian Stock Exchange (ASX), finding that it reduced trading activity, widened bid–ask spreads, and increased intraday volatility. Lecce et al. (Reference LECCE, LEPONE and SEGARA2008) find that naked short-selling increased stock price volatility and reduced liquidity, contradicting Miller’s (Reference MILLER1977) hypothesis that short-selling restrictions prevent overpricing.
A key debate in the literature concerns the differential impact of short-selling bans on liquid versus illiquid stocks. While most studies suggest that bans worsen liquidity, recent research suggests a more nuanced effect. Kolasinski et al. (Reference KOLASINSKI, REED and THORNOCK2013), Bernal et al. (Reference BERNAL, HERINCKX and SZAFARZ2014) and Fohlin et al. (Reference FOHLIN, LU and ZHOU2022) find that short-selling bans sometimes improve liquidity for highly illiquid stocks, likely due to the removal of predatory trading activity. This is relevant to our study, as the SSX and MSX were relatively illiquid exchanges in the 1930s, with some firms trading only once or twice per month (Fleming et al. Reference FLEMING, LIU, MERRETT and VILLE2024), and that liquidity tiers shaped how firms were affected by the bans.
Regarding price effects, Miller (Reference MILLER1977) propose that short-selling restrictions lead to overpricing, as pessimistic investors are unable to express their views through short sales. This has been supported by Boehme et al. (Reference BOEHME, DANIELSEN and SORESCU2006), Bris et al. (Reference BRIS, GOETZMANN and ZHU2007) and Frino et al. (Reference FRINO, LECCE and LEPONE2011), who find that short-selling restrictions lead to positive abnormal returns. However, Kolasinski et al. (Reference KOLASINSKI, REED and THORNOCK2013) and Helmes et al. (Reference HELMES, HENKER and HENKER2016) challenge this view, arguing that short-selling bans can introduce market inefficiencies rather than support inflated prices. Our findings contribute to this debate by showing that bans did not lead to systematic overpricing, but relative gains accrued only to high-return non-mining firms on SSX. We therefore interpret the evidence not as support for overpricing, but as consistent with trading frictions and selective shifts in speculative activity.
Our paper makes three contributions to the literature on short-selling restrictions. First, while most prior studies examine government-imposed bans, we provide a rare investigation of restrictions in a self-regulated setting. By analysing the Sydney and Melbourne Stock Exchanges in 1930, we offer a historical case study of how markets responded when regulation was initiated and enforced by the exchanges themselves rather than by the state.
Second, we contribute to the literature on market liquidity by showing that the effects of short-selling bans were heterogeneous. Whereas prior work generally finds that bans reduce liquidity by widening bid–ask spreads (Diamond and Verrecchia Reference DIAMOND and VERRECCHIA1987; Beber and Pagano Reference BEBER and PAGANO2013), we find that the impact varied across firms and exchanges. Spreads widened most for illiquid firms on SSX, volumes contracted most for high-volume and dual-listed non-mining firms, and relative return gains were concentrated in high-return non-mining firms. This contrasts with some more recent findings that restrictions may actually enhance liquidity in very illiquid markets (Kolasinski et al. Reference KOLASINSKI, REED and THORNOCK2013; Fohlin et al. Reference FOHLIN, LU and ZHOU2022).
Third, we clarify the mechanisms through which the bans operated. They curtailed speculative activity and increased trading frictions, but they did not provide broad price support. Instead, their effects were uneven, amplifying illiquidity among thinly traded firms and constraining activity in the most heavily traded non-mining and dual-listed stocks, while selectively benefitting high-return firms. Taken together, these results show that although self-regulated exchanges could limit certain trading behaviours, their interventions fell short of securing overall market stability.
The remainder of the article is organised as follows. Section II provides a background to the institutional setting during the sample period in Australia. Section III outlines the data used and its collection methods. Section IV presents our results. Section V concludes.
II
The SSX and MSX were the two largest financial markets in Australia in the 1930s and operated under a self-regulated framework (Matthews Reference MATTHEW2019). Member-owners who held seats voted on major managerial decisions and for members of the exchange’s committee. A defining characteristic of these exchanges was the dual role of members, who not only facilitated trades as brokers but also engaged in proprietary trading for their own accounts, a practice known as ‘jobbing’ (Adamson Reference ADAMSON1984; Salsbury and Sweeney Reference SALSBURY and SWEENEY1988). By contrast, stock exchange members on the London Stock Exchange (LSE) and the New York Stock Exchange (NYSE) could offer either broking or jobbing but could not undertake both (Michie Reference MICHIE1986; Attard Reference ATTARD2000). The ability to broker on behalf of clients and invest on their own account created inherent conflicts of interest, particularly in regulatory decisions such as short-selling bans. Members whose revenues depended on brokerage commissions tended to oppose restrictions, as such bans could reduce market participation and trading activity. Conversely, those with large holdings in stocks vulnerable to short-selling often supported restrictions, viewing them as a means of price stabilisation.
Another defining characteristic of the SSX and MSX was the lack of formal regulatory oversight concerning short-selling, including record-keeping and disclosure requirements for exchange members. Unlike modern markets, short sales in 1930s Australia did not require collateral, making naked short-selling – selling shares without first borrowing them – a widespread practice. Failed deliveries were rarely penalised; instead, market discipline operated through informal reputational enforcement. In the tightly knit brokerage community, a short seller who failed to deliver shares risked swift reputational damage, which could undermine their ability to trade in the future (Adamson Reference ADAMSON1984). This unwritten system of creditworthiness functioned as a self-regulated alternative to formal enforcement mechanisms (Salsbury and Sweeney Reference SALSBURY and SWEENEY1988).
Both the SSX and MSX operated call markets with three trading sessions per day, contrasting with the continuous trading systems seen in markets like the NYSE. During these sessions, trading occurred at designated times, and no members were permitted to enter or exit the trading floor while a session was in progress (Adamson Reference ADAMSON1984). This system presented unique challenges for regulatory enforcement, as short-selling restrictions applied only to trades conducted within official sessions. Off-the-books trading, which was difficult to monitor, could still occur outside these regulated periods. In other words, the enforcement mechanism focused on official session activity and publicity rather than a blanket legal ban at all times and venues. In markets where call trading comprised a larger share of activity – and where bans arrived earlier – one would expect a larger contemporaneous widening of quoted spreads and sharper reallocation of volume.
In the aftermath of the 1929 Wall Street stock market crash, the SSX and MSX faced immense pressure to stabilise the local markets. Initially resistant to external pressures to impose a short-selling ban, both exchanges independently decided to implement restrictions during the early 1930s. These bans were primarily reactive to specific market conditions and were not influenced by government directives, reflecting their self-regulatory approach to market management (Adamson Reference ADAMSON1984).
The first significant ban took effect on 7 July 1930, when the SSX prohibited forward selling (a term synonymous with short-selling) for investment stocks.Footnote 2 The rationale for the ban was twofold: first, prices of nearly all investment stocks had weakened considerably, and second, forward-selling volumes had risen sharply in preceding months. Exchange officials feared that speculative short-selling was exacerbating price declines, undermining market confidence. This decision coincided with broader concerns over the Australian federal government’s budget announcements, particularly regarding potential tax increases on excisable goods, which were expected to impact specific sectors.Footnote 3
Shortly thereafter, on 9 July 1930, the MSX followed suit, implementing its own restrictions on short-selling.Footnote 4 Unlike the SSX, however, the MSX’s decision came after considerable internal debate. Initially, a proposal to ban all ‘time contracts’ except one-month buyer’s options was overwhelmingly rejected, with 86 members opposing and only 7 in favour (Adamson Reference ADAMSON1984). A revised proposal, which targeted short-selling only for investment stocks, was more successful – 71 members voted in favour, while 24 opposed.
Importantly, mining stocks were exempted from both bans. While no formal rationale was recorded, contemporaneous reports suggest concern about illiquidity and the speculative character of these stocks. The Age noted that ‘divergent views were expressed, and the general opinion appeared to be that, in respect of mining stocks at least, a suspension would be undesirable’.Footnote 5 This reluctance likely reflected fears that restricting already volatile and thinly traded mining counters could impair market functioning or magnify investor uncertainty.
Appendix D of this article provides a detailed chronology of short-selling bans across Australian exchanges, reconstructed from archival and newspaper sources. It shows how the bans were first adopted by SSX and MSX and were quickly followed by the Adelaide and Brisbane exchanges on 10 and 11 July. While the specific motivations and timing varied slightly across jurisdictions, there was a coordinated momentum to regulate short-selling in investment stocks, reflecting broader institutional responses to the 1930 market turmoil. In Appendix E, we further present selected contemporaneous quotations that illustrate the rationale, controversy, and divergent institutional perspectives surrounding the bans. These materials collectively highlight the uneven application of restrictions, the tension between speculative discipline and liquidity preservation, and the discretionary power exercised by self-regulated exchanges.
While this article focuses on the SSX and MSX bans enacted in July 1930, we note that similar restrictions persisted in varying forms through the late 1930s (Adamson Reference ADAMSON1984; Gibbs Reference GIBBS1988).Footnote 6 A fuller exploration of their long-run effects is beyond our scope but may be a fruitful avenue for future research.
III
We construct a hand-collected dataset from trading records of SSX and MSX, covering market activity before and after the implementation of short-selling restrictions in July 1930. The sample spans from 12 June 1930 to 1 August 1930, capturing about four weeks before and after the regulatory changes.
Primary data sources are newspaper lists of daily prices and trading, primarily The Sun for the SSX and The Age for the MSX. The Sun’s afternoon publication provided same-day trading information in its ‘Quotations on High’Change’ and ‘To-day’s Sales and Turnover’ sections, while The Age’s ‘Stocks & Shares’ section provided close-of-day price information that we collected from the day following the date of interest, together (in a separate section) volume data. All data was sourced via Trove, the National Library of Australia’s online newspaper archive. Trove’s internal search engine facilitated the retrieval of the necessary data, which was then manually transcribed and organised for use in this article. Examples of the articles used from both The Sun and The Age are included in Appendices A–C.
The key variables include sales prices, trading volumes, bid and ask prices, company identifiers, sector classifications and forward sale activity. For sales prices, if multiple transactions were recorded for a firm on the same day, the highest price was selected, unless the transaction was labelled as a ‘small-batch’ sale, in which case the next highest price was used. Trading volumes were sourced slightly differently, although from the same newspapers. For SSX, volume data was obtained from The Sun’s ‘To-day’s Sales and Turnover’ section. For MSX, volume data was manually interpreted from The Age’s ‘Stocks & Shares’ section, as volume figures were not separately listed in table format.
The dataset also includes sector classifications, directly adopted from newspaper trading tables. Firms were categorised into: Bank, Shipping, Insurance, Gas & Electric, Breweries, Miscellaneous, Land & Building, Coal, Copper, Silver-Lead, Gold, Tin, Miscellaneous Mining, Pastoral & Finance, Trust, Tram & Rail. The primary use of this classification is to discriminate between the mining firms and the non-mining firms, the key driver behind the analysis.
To track firms consistently, company identifiers were generated, in particular to account for firms dual-listed on both SSX and MSX. However, discrepancies arose due to slight variations in naming conventions between the two newspapers. To mitigate this, firm names were manually cross-referenced and mapped across both exchanges.
The primary dependent variables in our analysis are relative bid–ask spreads, trading volume, and daily stock returns. Bid and ask quotes were collected for each firm on each trading day; if either was missing, no spread was recorded. Relative spreads were calculated as the difference between the bid and ask prices, divided by their average, following the methodology of Fohlin et al. (Reference FOHLIN, LU and ZHOU2022) to assess market liquidity. Trading activity is measured by log daily trading volume, which provides a consistent scale across firms of different sizes and reduces skewness from extreme values.
For returns, we follow standard conventions in the market microstructure literature (Amihud and Mendelson Reference AMIHUD and MENDELSON1986; Goetzmann et al. Reference GOETZMANN, IBBOTSON and PENG2001) and compute daily log returns from mid-quotes. Mid-quotes are defined as the average of bid and ask prices, and where interim values are missing, we apply last-observation-carried-forward within firm to construct a continuous series. This method enables consistent firm-day return estimates even for thinly traded securities. Using these daily returns, we also compute an equal-weighted market return across all stocks listed on both SSX and MSX, which serves as a control in our regressions to separate the effects of the bans from broader market-wide fluctuations.
Following the observation by Case et al. (Reference CASE, POELMANS and VERDICKT2025) that selection bias and illiquidity can materially distort historical return estimates, we conduct a series of robustness checks to account for the sparsity of interwar trading records.Footnote 7 These alternative return constructions allow us to assess whether missing-price interpolation affects the estimated effects of the ban. Specifically, we (1) retain only firms with at least 85 per cent of observed transaction prices; (2) repeat the analysis using quote mid-points with the same 85 per cent coverage threshold; and (3) implement a capped carry-forward procedure that fills missing mid-quotes for up to three trading days.
Table 1 presents the summary statistics. As shown in Panel A, the dataset consists of 19,684 firm-day observations across 532 firms, comprised of 312 firms (58.6%) listed on the SSX and 220 (41.4%) on the MSX. There were 170 (32.0%) firms dual-listed on both exchanges.Footnote 8 Of these, 134 firms (25.2%) were classified as mining stocks, providing a natural control group, as mining companies were largely exempt from the short-selling bans. In contrast, non-mining firms, which comprised the treatment group, were directly affected by the restrictions. This distinction enables a difference-in-differences approach to assess the impact of short-selling bans on market liquidity, trading volumes, and price efficiency.
Summary statistics, mean differences by exchange and listing status

Table 1 Long description
Panel A reports pooled summary statistics for exchange and listing indicators, prices, trading activity, spreads, firm size, and returns. The sample has 19,684 firm-day observations, with SSX equal to 0.586 on average, MSX 0.414, Dual 0.32, and NonMining 0.748. Quoted prices are based on fewer observations: the mean bid is 34.857 shillings and the mean ask is 36.283 shillings, with medians of 17.75 and 19 and maxima near 850 to 860. Trading volume is available for 1,255 observations, averaging 722.786 shares per day with a median of 400 and a maximum of 13,000. Sale prices (2,361 observations) average 44.727 shillings with a median of 19 and a maximum of 852.5. The relative spread averages 0.095 with a median of 0.043 and ranges up to 1.997, indicating substantial dispersion. Paid-up capital averages 893,299.60 pounds (19,055 observations) and share denomination averages 33.972 shillings, both with wide ranges. Daily stock returns average minus 0.003 (12,875 observations) and daily market returns average minus 0.002 (19,464 observations), with small standard deviations. Because availability differs by variable, comparisons across rows should account for the varying numbers of observations.
Note: This table presents summary statistics for key variables in the dataset, including bid and ask prices (in shillings), trading volume (shares per day), sale prices, bid–ask spreads and firm characteristics. Panel A reports pooled statistics across both the Sydney Stock Exchange (SSX) and Melbourne Stock Exchange (MSX). Panel B and Panel C present summary statistics separately for the SSX and MSX subsamples, respectively. Panel D restricts the sample to dual-listed firms, while Panel E reports statistics for firms listed only on one exchange. In Panels B and D, we also report mean differences (SSX minus MSX, and Dual minus Non-Dual, respectively) and t-statistics to assess statistical significance. SSX, MSX and Dual are indicator variables that equal one if a firm is listed on the SSX, MSX or both exchanges, respectively. NonMining is an indicator for firms that do not operate in the mining sector. Bid and Ask are the highest and lowest quoted prices for a given day. Volume is the number of shares traded. Sale price refers to the transaction price in shillings, when available. Spread is the relative bid–ask spread, defined as (Ask–Bid)/(Mid), where Mid is the mid-quotes. Paid-up capital is recorded in pounds (£), while share denomination is in shillings. Daily stock return is the log return in mid-quotes (filled using last observation carried forward within firm). Daily market return is computed as the equal-weighted average of firm-level log returns for stocks listed on both SSX and MSX. Standard deviations, medians, and minimum/maximum values are reported for each variable. # Obs. denotes the number of firm-day observations available. t statistics are reported in parentheses.
* p < 0.05, ** p < 0.01, *** p < 0.001.
The average bid and ask prices in the sample are 34.86 shillings and 36.28 shillings, respectively. Only one-third of firm-day observations recorded an active bid or ask price, reflecting a market that was relatively illiquid compared to modern financial markets (Fleming et al. Reference FLEMING, LIU, MERRETT and VILLE2024). Our sample likely presents a skewed distribution of firm size. The mean paid-up capital is 893,299 pounds, while the median is 300,914 pounds, suggesting that a few large firms dominate the sample. The median share denomination is 20 shillings (or one pound), which aligns with the common face value of securities at the time. Both daily stock return and market return have a negative average, highlighting that the bans were imposed against a backdrop of sustained market weakness, which is consistent with contemporaneous economic pressures in 1930.
Panels B and C compare SSX and MSX. SSX stocks traded at lower volumes (407 shares per day) and wider spreads (0.108) compared to MSX (1,351 shares; 0.072 spreads). SSX firms also have wider bid–ask spreads (0.108 vs 0.072), lower paid-up capital, and smaller share denominations. SSX also has a slightly lower share of non-mining firms than MSX (0.731 vs 0.773). Taken together, these factors suggest that Melbourne firms were larger and more liquid than their Sydney counterparts.
Panels D and E split by listing status. Dual-listed firms were larger and more liquid, with average daily volume of 816 shares vs 573 for non-duals, tighter spreads (0.045 vs 0.132), and much higher paid-up capital (£1.79m vs £0.45m). Non-duals were smaller, more illiquid, and often confined to localised sectors such as mining.
In untabulated results, we also directly compare cross-listed firms on SSX and MSX using matched quotes for the same securities on the same trading days.Footnote 9 We find that bid, ask, sale prices, spreads and daily returns are statistically indistinguishable across the two markets. The only systematic difference is in trading volumes, which are significantly higher on MSX (mean difference of about 1,340 shares, t = -7.14, p < 0.001). This indicates that while both exchanges valued cross-listed securities similarly, Melbourne attracted much heavier trading activity.
We also provide pre-ban, ban-day and post-ban descriptive statistics in Appendix F (Table A1). These show no sharp discontinuities prior to the bans, though levels clearly differ across groups.
Table 2 provides industry-level averages. In Panel A (full sample), Banking stocks had the highest bid prices (188 shillings), while Gold (6 shillings) and Miscellaneous Mining (3 shillings) were at the low end. Spreads varied widely: Breweries (0.022) and Gas & Electric (0.044) were liquid, while Coal (0.214), Gold (0.245) and Miscellaneous Mining (0.162) were much less liquid. Volumes also varied, with Copper averaging 1,633 shares per day and Gold nearly 882, compared with negligible turnover in sectors such as Land & Building, Tram & Rail and Trust.
Industry-level summary statistics of trading activity by exchange and dual-listing status

Table 2 Long description
Industry averages are reported for bid and ask prices (in shillings), daily share volume, relative bid–ask spread, and daily return, along with the number of firm-day observations and unique firms. The Misc category dominates coverage with 10,878 observations and 294 firms, far exceeding any other industry. Bank shows the highest typical prices, with an average bid about 187.6 and average ask about 190.8, while Gold has the largest firm count outside Misc (42 firms) and 1,554 observations. Trading volume is highest for Copper (about 1,633 shares per day) and Past and Fin (about 1,429), and lowest among reported values for Bank (about 135). Spreads vary widely: Gold and Coal have the widest average spreads (about 0.245 and 0.214), while Bank, Breweries, Silver-Lead, and Tram and Rail are among the tightest (around 0.021 to 0.023). Average returns are near zero and slightly negative for most industries, with Copper the most negative (about minus 0.009) and a few categories at roughly zero (Misc Mining and Trust). Some industries have missing volume values (Land and Bdg, Tram and Rail, Trust), so comparisons involving volume are incomplete.
Note: This table presents industry-level summary statistics and subgroup breakdowns by exchange and listing status. Panel A reports means for key trading variables across the full sample. Panels B and C present the same summary statistics separately for firms listed on the Sydney Stock Exchange (SSX) and Melbourne Stock Exchange (MSX), respectively. Panel D restricts the sample to firms dual-listed on both SSX and MSX, while Panel E includes firms listed on only one exchange (non-dual-listed). Bid and ask prices are in shillings. Trading volume is number of shares traded per day. Spread is the relative bid–ask spread, defined as (Ask–Bid)/(Mid), where Mid is the mid-quotes. # Obs. denotes the number of firm-day observations; Daily returns are log changes in mid-quotes, where the mid-quote is the average of bid and ask prices. # Firms reports the number of unique firms per industry. Missing data (‘–’) indicates industries without recorded observations for that variable within the subgroup. Industry classifications follow historical exchange labels.
Panels B and C show exchange differences. MSX consistently had higher volumes than SSX in sectors such as Breweries (1,142 vs 469 shares) and Miscellaneous (1,938 vs 323 shares). SSX had relatively tighter spreads in some industries but weaker turnover overall, reinforcing Melbourne’s relative depth.
Panels D and E compare dual-listed and non-dual firms. Duals were concentrated in Banking, Breweries and Miscellaneous. They recorded higher prices, and tighter spreads (e.g. Breweries spread of 0.020 for duals vs 0.025 for non-duals). Non-duals were clustered in illiquid sectors such as Gold and Miscellaneous Mining, where spreads were much wider (0.265 and 0.194 respectively). This confirms that listing status was closely linked to sectoral liquidity.
We evaluate the impact of the short-selling ban using a difference-in-differences (DiD) framework that compares affected securities (non-mining) with exempt securities (mining). Our baseline specification is:
 \begin{equation}\begin{gathered}
{Y_{i,t}} = {\alpha _i} + {\beta _1}Ba{n_{i,t}} + {\beta _2}NonMinin{g_i} + {\beta _3}(Ba{n_{i,t}} \times NonMinin{g_i}) \\
+ {\beta _4}Control{s_{i,t}} + { \in _{i,t}} \\
\end{gathered} \end{equation}
\begin{equation}\begin{gathered}
{Y_{i,t}} = {\alpha _i} + {\beta _1}Ba{n_{i,t}} + {\beta _2}NonMinin{g_i} + {\beta _3}(Ba{n_{i,t}} \times NonMinin{g_i}) \\
+ {\beta _4}Control{s_{i,t}} + { \in _{i,t}} \\
\end{gathered} \end{equation}where Yi,t represents the dependent variable, including relative spread, trading volume, and daily stock return. Bani,t is an indicator variable equal to one for periods after the short-selling ban took effect on SSX or MSX, and 0 otherwise. NonMiningi is an indicator variable that takes the value of one if the firm is not a mining company (treatment group), and zero otherwise (control group). Bani,t×NonMiningi captures the interaction effect, identifying the differential impact of the short-selling ban on non-mining firms. Controls include the equal-weighted daily market return; the natural logarithm of paid-up capital, serving as a proxy for firm size; and the natural logarithm of share denomination, as smaller-denomination shares may be easier to short sell.
To build on the findings of Bernal et al. (Reference BERNAL, HERINCKX and SZAFARZ2014), Fohlin et al. (Reference FOHLIN, LU and ZHOU2022) and Kolasinski et al. (Reference KOLASINSKI, REED and THORNOCK2013), which suggest that less liquid securities may sometimes experience improved liquidity under short-selling restrictions, we allow the ban effect to vary by pre-ban liquidity. Firms are stratified into Low, Med and High groups using the full cross-section of firms (both mining and non-mining) and the relevant pre-ban measure computed over the pre-treatment window.Footnote 10 For spread regressions, stratification is based on average pre-ban spreads; for volume regressions, it is based on average pre-ban log volumes; and for return regressions, it is based on average pre-ban daily returns. The corresponding specification is:
 \begin{equation}\begin{gathered}
{Y_{i,t}} = {\alpha _i} + {\beta _1}Ba{n_{i,t}} + {\beta _2}NonMinin{g_i} + {\beta _3}Me{d_i} + \\
{\beta _4}Hig{h_i} + {\beta _5}(Ba{n_{i,t}} \times Me{d_i}) + {\beta _6}(Ba{n_{i,t}} \times Hig{h_i}) \\
+ {\beta _7}(NonMinin{g_{i,t}} \times Me{d_i}) + {\beta _8}(NonMinin{g_{i,t}} \times Hig{h_i}) \\
+ {\beta _9}(Ba{n_{i,t}} \times NonMinin{g_{i,t}} \times Me{d_i}) \\
+ {\beta _{10}}(Ba{n_{i,t}} \times NonMinin{g_{i,t}} \times Hig{h_i}) + {\beta _{11}}Control{s_{i,t}} + { \in _{i,t}} \\
\end{gathered} \end{equation}
\begin{equation}\begin{gathered}
{Y_{i,t}} = {\alpha _i} + {\beta _1}Ba{n_{i,t}} + {\beta _2}NonMinin{g_i} + {\beta _3}Me{d_i} + \\
{\beta _4}Hig{h_i} + {\beta _5}(Ba{n_{i,t}} \times Me{d_i}) + {\beta _6}(Ba{n_{i,t}} \times Hig{h_i}) \\
+ {\beta _7}(NonMinin{g_{i,t}} \times Me{d_i}) + {\beta _8}(NonMinin{g_{i,t}} \times Hig{h_i}) \\
+ {\beta _9}(Ba{n_{i,t}} \times NonMinin{g_{i,t}} \times Me{d_i}) \\
+ {\beta _{10}}(Ba{n_{i,t}} \times NonMinin{g_{i,t}} \times Hig{h_i}) + {\beta _{11}}Control{s_{i,t}} + { \in _{i,t}} \\
\end{gathered} \end{equation} Where Medi, and Highi indicate the medium and high tiers (the Low tier is the omitted reference group). In this parameterisation,  ${\beta _9}$ and ${\beta _{10}}$ are the key coefficients: they measure how the DiD effect for non-mining firms changes within the Med or High tier relative to the Low tier. The various two-way terms ensure proper DiD comparisons within each tier and treatment cell. We estimate (1)– (2) separately for SSX, MSX, SSX non-dual-listed, MSX non-dual-listed, Dual-listed, and All firms, matching the reporting structure in the tables. Given the bans were implemented one day apart (SSX on 8 July, MSX on 9 July), estimating models by exchange and listing status directly accommodates this short stagger. Appendix F further documents pre-ban, announcement-day and immediate post-ban summary statistics around the event window.
IV
We begin our analysis by examining the bid–ask spread dynamics for mining (control) and non-mining (treatment) firms before and after the short-selling ban. This preliminary visualisation provides initial insights into liquidity trends before turning to the formal regression analysis. Figure 1 presents the evolution of bid–ask spreads over a subsample of the event window from trading day –15 to trading day +15, where day 0 represents the introduction of the short-selling ban. Given that the SSX and MSX implemented the ban on different dates, day 0 is aligned separately for each exchange. Panels A to D illustrate subsamples for the full sample, SSX, MSX, and dual-listed firms, respectively. We have added a linear trend to each group.
Bid–ask spreads before and after the short-selling ban

Figure 1 Long description
Panel A shows the full sample with the x-axis labeled as trading days from negative 15 to positive 15 and the y-axis as bid-ask spread. The spread fluctuates around 0.6, peaking near day negative 5 and day positive 10. Panel B displays the SSX sample with similar axes. The spread starts high around 0.7, decreases towards day 0 and rises again after. Panel C illustrates the MSX sample, where the spread is more volatile, peaking around day negative 10 and day positive 5. Panel D shows dual-listed firms with a steadier spread, slightly increasing post-ban. Each panel uses different line styles to differentiate between mining and non-mining firms, showing varied responses to the ban.
A close examination of Figure 1 reveals several key findings. First, non-mining firms exhibit a noticeable increase in bid–ask spreads post-ban, particularly in the SSX sample (Panel B). In contrast, MSX-listed non-mining firms (Panel C) exhibit no clear upward trend and greater volatility, suggesting a weaker and more inconsistent liquidity impact. Furthermore, the dual-listed firms (Panel D) exhibit relatively stable bid–ask spreads, with minimal divergence between mining and non-mining stocks.
Table 3 presents the DiD estimates for bid–ask spreads, using Model 1, across six different subsamples based on stock exchange listings. The results provide evidence on the liquidity effects of the short-selling ban for non-mining firms.
Difference in difference regressions on bid–ask spreads

Table 3 Long description
The table reports difference-in-differences regression estimates of how a short-selling ban relates to bid–ask spreads across 12 model columns and multiple subsamples (SSX, MSX, non-dual-listed, dual-listed, and all firms). The ban indicator is negative and statistically significant in the SSX sample and in the all-firms baseline model, but is small and not statistically significant in most other subsamples and specifications. The non-mining indicator is generally negative and statistically significant in many columns, indicating lower spreads for non-mining firms outside the ban interaction. The key interaction term for non-mining firms during the ban is positive and statistically significant in the SSX sample and in the all-firms models, suggesting spreads for non-mining firms rose relative to mining firms during the ban in those specifications; it is not consistently significant in MSX, non-dual-listed MSX, or dual-listed samples. In the alternative specifications (columns 7 to 12), additional controls are included: market daily return is not statistically significant, while paid-up capital is consistently negative and statistically significant, and share denomination shows mixed signs with significance in a few columns. Sample sizes range from about 1,053 to 6,887 observations, and adjusted R-squared values are higher in the controlled specifications than in the baseline models. Standard errors are reported in parentheses and statistical significance is indicated by stars, so results should be interpreted with attention to uncertainty and differences across subsamples.
Notes: This table reports regression results estimating the impact of the short-selling ban on bid–ask spreads across different subsamples. NonMining × Ban represents the interaction term measuring the effect of the ban on non-mining firms. Columns (1)–(6) present results for the SSX, MSX, non-dual-listed and full samples, while columns (7)–(12) show alternative specifications. Standard errors are in parentheses.
*** , ** and * denote statistical significance at the 1%, 5% and 10% levels, respectively.
The interaction term (NonMining×Ban) is positive and statistically significant in the full sample (columns 6 and 12) and in the SSX subsample (columns 1 and 7). This indicates that the short-selling ban widened bid–ask spreads for non-mining firms, suggesting a deterioration in market liquidity for the firms directly affected by the restriction. In contrast, the interaction term is positive but not statistically significant in the MSX subsamples (columns 2, 4, 8 and 10) and in the dual-listed subsample (column 5 and 11). This suggests that the liquidity impact of the ban was not as pronounced for MSX-listed firms or dual-listed firms. These regression results are in line with the visual evidence presented in Figure 1.
The coefficient on NonMining is negative and statistically significant in almost all samples, indicating that non-mining firms, on average, had narrower bid–ask spreads than mining firms. The coefficient on Ban is negative and statistically significant in the SSX and full samples, suggesting that spreads tended to decline during the ban period. However, the significance of Ban disappears once market return, firm size (paid-up capital) and share denomination are included as control variables, implying that changes in spreads during the ban may be partially explained by differences in firm characteristics.
A key takeaway from these results is that the short-selling ban’s impact was most evident in the SSX sample, where the restriction was first introduced. The non-significance in the MSX subsamples and the dual-listed sample raises two possible explanations. First, enforcement bite was greater at SSX: the measure explicitly prohibited forward dealing ‘on call’ (i.e. during official call sessions), directly constraining the main trading venue (Appendix E, SMH, 8 July 1930). By contrast, MSX adopted a narrower ban two days later after a divided vote (86–7 against a broad ban; 71–24 for a limited measure), consistent with weaker compliance and later effective exposure (Appendix D; Adamson Reference ADAMSON1984).
Second, dual-listed firms could substitute order flow across venues – potentially into MSX prior to 9 July and into Adelaide/Brisbane once those exchanges followed on 10–11 July – diluting measured liquidity impacts on MSX and within the dual-listed subsample (Appendix D). Many of these firms were also larger and more established, likely benefiting from greater liquidity reserves compared to their non-dual-listed counterparts. The ability to trade across multiple venues may have helped mitigate the observed liquidity effects.
Table 4 extends the analysis by stratifying firms into low-, medium- and high-spread groups using pre-ban averages. This reveals important heterogeneity in how the restrictions affected liquidity. The results for the high-spread group highlight a sharper distinction between mining and non-mining firms. When all firms are considered together, the interaction term High × Ban is negative and significant in several samples, implying that the most illiquid firms sometimes experienced narrower spreads during the ban period. This pattern is consistent with the idea that curbing informed short-selling can stabilise trading conditions in very thin markets, as argued by Bernal et al. (Reference BERNAL, HERINCKX and SZAFARZ2014), Kolasinski et al. (Reference KOLASINSKI, REED and THORNOCK2013) and Fohlin et al. (Reference FOHLIN, LU and ZHOU2022). However, once the analysis isolates non-mining firms, the three-way interaction term High × NonMining × Ban reveals a striking divergence across exchanges. For the SSX, SSX non-dual-listed, dual-listed and overall samples, the coefficients for the high-spread group are positive and significant, implying that the ban amplified liquidity costs – widening spreads – especially among the most illiquid non-mining firms in Sydney. This accords with the view that the SSX ban had the strongest bite in thinly traded investment stocks. By contrast, in the MSX and MSX non-dual-listed samples, the interaction term is negative and significant, suggesting that spreads narrowed for highly illiquid non-mining stocks in Melbourne. A likely explanation is the staggered implementation of the bans: with forward trading already restricted in Sydney, speculative activity may have shifted briefly toward Melbourne, temporarily improving liquidity in its most illiquid segment (Appendix D).
Stratified difference in difference regressions on bid–ask spreads

Table 4 Long description
The table reports stratified difference-in-differences regression coefficients for bid–ask spreads, grouping firms by pre-ban liquidity (low as the reference group, plus medium and high). Results are shown for SSX, MSX, non-dual-listed subsamples, dual-listed firms, and the full sample, with two sets of specifications (columns 1 to 6 and 7 to 12). Across all columns, the high-liquidity indicator is large and strongly positive (about 0.16 to 0.31), and the medium-liquidity indicator is smaller but generally positive (about 0.037 to 0.058), indicating higher baseline spreads for those groups relative to low. The ban main effect is small and usually not statistically significant, except a small positive effect in the full sample in column 12. The interaction for high-liquidity firms during the ban is consistently negative and often statistically significant (roughly minus 0.04 to minus 0.07), implying spreads fell for high-liquidity firms relative to low during the ban. The interaction for medium-liquidity firms during the ban is modest and sometimes weakly significant (around 0.02 to 0.04), suggesting little change or slight increases relative to low. Triple interactions with non-mining are mixed: for high-liquidity non-mining firms during the ban the coefficient is positive and significant in SSX and the full sample but negative and significant in MSX, indicating market-specific differences. Alternative specifications add controls such as market daily return, paid-up, and share denomination; these do not change the main pattern for the high-liquidity ban interaction. Sample sizes range from about 1,053 to 6,887 observations, and adjusted R-squared values are around 0.28 to 0.39, so effects should be interpreted as model-based associations with standard errors reported.
Notes: This table presents regression results, stratified by pre-ban liquidity levels, to examine the impact of the short-selling ban on bid–ask spreads. Low, Med and High represent firms grouped by their average bid–ask spreads during the pre-ban period, using the full sample of firms (both mining and non-mining). Their interactions with Ban capture the differential effect of the restriction. Columns (1)–(6) report results for the SSX, MSX, non-dual-listed, dual-listed and full samples, while columns (7)–(12) show alternative specifications. Standard errors are in parentheses.
*** , ** and * denote statistical significance at the 1%, 5% and 10% levels, respectively.
The stratified results underscore that the short-selling ban had uneven effects. Liquidity deteriorated most sharply for non-mining firms, particularly those already illiquid before the ban, while mining firms were partially shielded from these dynamics and in some cases experienced relative improvements. The evidence therefore reinforces the central interpretation of the ban as a policy that constrained liquidity in the treatment group, with its stabilising effects confined to exempt sectors.
The overall findings are consistent with both theoretical and empirical literature, including Diamond and Verrecchia (Reference DIAMOND and VERRECCHIA1987), Miller (Reference MILLER1977), Beber and Pagano (Reference BEBER and PAGANO2013) and Boehmer and Wu (Reference BOEHMER, JONES and ZHANG2013). These studies suggest that short-selling restrictions can impair market efficiency by obstructing price discovery, preventing the correction of overvalued securities, and widening bid–ask spreads. Our results support these conclusions, particularly in the context of self-regulated markets, where enforcement and market structure can shape the effectiveness of trading restrictions.
We explore now whether the short-selling ban influenced market participation, particularly for non-mining firms directly affected by the restriction. Trading volume serves as a crucial measure of market liquidity, with declining volumes often signalling reduced activity and potential market inefficiencies. However, changes in trading volume may also reflect shifts in investor behaviour, as market participants adjust to new regulatory constraints.
The results in Table 5 show a mixed picture. For the SSX non-dual-listed sample, the interaction term (NonMining × Ban) is positive and statistically significant (columns 3 and 9). This indicates that non-mining firms trading exclusively on SSX experienced a noticeable increase in volume after the ban, even though these were generally smaller and less liquid firms prior to the intervention. At first glance, this increase in trading volume may seem counterintuitive, as short-selling restrictions are generally expected to dampen market activity. However, this result could be driven by speculative trading behaviour or increased demand from investors unable to short-sell, forcing them to seek alternative strategies. This would be consistent with Appel and Fohlin (Reference APPEL and FOHLIN2010) and Fohlin et al. (Reference FOHLIN, LU and ZHOU2022), which argue that short-selling restrictions can, under certain conditions, improve or at least stabilize trading volumes during periods of market distress by reducing informational asymmetry.
Difference in difference regressions on trading volumes

Table 5 Long description
The table reports difference-in-differences regression estimates for trading volume across 12 model columns and several subsamples (SSX, MSX, non-dual-listed, dual-listed, and all firms). The ban indicator is generally negative and usually not statistically significant; the largest negative estimates are about minus 0.36 in SSX non-dual-listed models, where it is significant in both baseline and alternative specifications. The non-mining indicator shows large, statistically significant differences in several columns, including about minus 0.95 to minus 1.00 in SSX-related samples and about minus 0.77 in the full sample, while one MSX non-dual-listed alternative model shows a large positive estimate around 1.88. The interaction capturing the ban’s additional effect for non-mining firms is mostly small and not significant, with a few marginally significant positives around 0.45 to 0.47 in SSX non-dual-listed models and a marginally significant negative around minus 0.37 in the MSX sample alternative model. Alternative specifications add controls: paid-up capital is positive and significant in most columns (except a negative estimate around minus 0.37 in MSX non-dual-listed), share denomination is consistently negative and significant, and market daily return is not significant. Sample sizes range from 77 to 1,255 observations, and adjusted R-squared values rise notably in the alternative specifications (roughly 0.24 to 0.48) compared with the baseline models (roughly 0.03 to 0.15). Results should be interpreted with attention to differing subsamples and model controls, since significance and direction vary most for the non-mining indicator and the interaction term.
Notes: This table reports regression results estimating the impact of the short-selling ban on trading volumes across different subsamples. NonMining × Ban represents the interaction term measuring the effect of the ban on non-mining firms. Columns (1)–(6) present results for the SSX, MSX, non-dual-listed and full samples, while columns (7)–(12) show alternative specifications. Standard errors are in parentheses.
*** , ** and * denote statistical significance at the 1%, 5% and 10% levels, respectively.
By contrast, the interaction is insignificant or negative in most other subsamples, and in the MSX sample (column 8), it is negative and significant. These differences highlight that the volume response was not uniform across markets or listing status.
Table 6 stratifies the analysis further by pre-ban trading activity, grouping firms into low-, medium- and high-volume categories. Here, the heterogeneity becomes more pronounced. The coefficient on HIGH_v × NonMining × Ban is negative and significant in several specifications, most notably for the dual-listed and overall samples. This shows that non-mining firms in the highest pre-ban trading volume tier experienced a contraction in activity once the ban took effect, despite their greater liquidity. These stocks were natural targets of speculative short-selling before the ban, and when that activity was curtailed, volumes fell disproportionately. The effect is particularly evident in Melbourne and in dual-listed firms, consistent with restrictions disrupting speculative and cross-exchange trading in the most liquid non-mining stocks. Several coefficients in the MSX and MSX non-dual-listed samples are missing because the vast majority of Melbourne firms naturally fall into the high-volume group, leaving very few observations in the lower-volume terciles. This aligns with our earlier descriptive evidence that Melbourne stocks were, on average, much more actively traded than Sydney’s.
Stratified difference in difference regressions on trading volumes

Table 6 Long description
The table reports stratified difference in difference regression estimates for trading volume, split by firms’ pre-ban liquidity groups (low, medium, high) and by sample (SSX, MSX, non-dual-listed, dual-listed, and all firms), with two sets of specifications. The main ban indicator is generally modest and often not statistically significant in the first set of models, but becomes positive and significant in the SSX and all-firm columns of the second set (about 0.34 in SSX and 0.33 overall). Medium and high pre-ban volume groups have higher baseline trading volume than the low group in most columns, with high volume showing large, consistently significant positive coefficients. The interaction for high volume firms during the ban is negative and frequently significant, indicating a larger ban-related decline for high-liquidity firms (for example around minus 1.01 in SSX and about minus 0.66 overall in the first set, and around minus 0.90 in SSX and about minus 0.64 overall in the second set). Medium volume interactions with the ban are near zero in the first set and more negative in the second set for SSX and the full sample (around minus 0.49 and minus 0.48, respectively). Non-mining firms differ from mining firms in baseline volume in several columns, but the three-way interactions suggest the ban’s differential effect by sector is limited and only clearly negative for high-volume dual-listed firms and in the overall sample in some specifications. Some columns include additional controls (such as market return and firm characteristics), and results vary by sample size and model fit, so comparisons should focus on sign, magnitude, and statistical significance rather than any single coefficient.
Notes: This table presents regression results, stratified by pre-ban liquidity levels, to examine the impact of the short-selling ban on trading volumes. Low_v, Med_v, and High_v represent firms grouped by their average trading volumes during the pre-ban period, using the full sample of firms (both mining and non-mining). Their interactions with Ban capture the differential effect of the restriction. Columns (1)–(6) report results for the SSX, MSX, non-dual-listed, dual-listed, and full samples, while columns (7)–(12) show alternative specifications. Standard errors are in parentheses.
*** , ** and * denote statistical significance at the 1%, 5% and 10% levels, respectively.
The overall evidence presents some contrasts with much of the prior literature, which generally documents volume declines under short-selling bans (e.g. Lecce et al. Reference LECCE, LEPONE and SEGARA2008; Beber and Pagano Reference BEBER and PAGANO2013). The Australian case shows more uneven effects. Non-mining firms as a group did not experience uniform declines in trading activity, and some subsets even registered significant increases. These results reinforce the broader conclusion that the consequences of bans depend not only on market structure but also on firm characteristics and the adaptability of investors. They also reflect the limitations of enforcement in self-regulated markets, where the capacity to impose uniform trading constraints was uneven across exchanges and listing statuses (Adamson Reference ADAMSON1984).
We now assess whether the short-selling ban influenced daily stock returns. Unlike the spread and volume regressions, which capture direct trading frictions, the return regressions test whether restrictions distorted price formation or altered investor confidence.
Table 7 reports the baseline difference-in-difference specifications across various subsamples. The interaction term (NonMining × Ban) is consistently small and statistically insignificant, regardless of exchange or listing status. This indicates that, on average, non-mining firms did not experience return dynamics that diverged systematically from mining firms during the ban period. The coefficients on Ban itself are generally indistinguishable from zero, and even where significant – for example, in the dual-listed sample (columns 5 and 11) – the magnitudes are economically negligible. Overall, the baseline regressions provide little evidence that the ban directly altered daily returns for the affected firms.
Difference in difference regressions on returns

Table 7 Long description
The table reports difference-in-differences regressions of cumulative returns, estimated separately for SSX, MSX, non-dual-listed subsamples, dual-listed firms, and the full sample, with two sets of specifications. In the baseline specifications (columns 1 to 6), the ban coefficient is near zero in most subsamples, but is positive and weakly significant for dual-listed firms at about 0.0032; the full-sample estimate is about 0.00090. The key interaction term capturing the ban’s differential effect for non-mining firms is small and not statistically significant across all columns, ranging roughly from minus 0.0020 to plus 0.0026. The non-mining indicator itself is generally small; it is negative and weakly significant in the MSX non-dual-listed subsample (about minus 0.0047 in column 4). In the alternative specifications (columns 7 to 12) that add controls, market daily return is strongly positive and statistically significant in SSX and in the full sample (about 0.26 and 0.19), while it is not consistently significant in MSX. Additional controls show mixed results: paid-up is weakly negative in MSX and in the full sample, and share denomination is positive and significant in MSX non-dual-listed and in the full sample. Adjusted R-squared values are very low throughout (about 0.000 to 0.008), so the models explain little of the variation in returns even where some coefficients are statistically significant.
Notes: This table reports regression results estimating the impact of the short-selling ban on cumulative returns across different subsamples. NonMining × Ban represents the interaction term measuring the effect of the ban on non-mining firms. Columns (1)–(6) present results for the SSX, MSX, non-dual-listed and full samples, while columns (7)–(12) show alternative specifications. Standard errors are in parentheses.
*** , ** and * denote statistical significance at the 1%, 5% and 10% levels, respectively.
We further examine the robustness of these findings under the three alternative return constructions described in above. As shown in Table A2 in Appendix G, the NonMining × Ban coefficient remains small and statistically insignificant in the price- and mid-coverage-filtered samples (options 1 and 2) but becomes modestly positive and significant for the SSX and SSX non-dual-listed subsamples under the capped-fill specification (option 3). This pattern suggests that allowing limited forward-filling of quotes reduces measurement noise without altering the substantive interpretation of the results. It is also possible that the non-significant estimates in the filtered samples arise from the limited variation among the most liquid firms retained under the 85 per cent threshold and the smaller sample sizes that result.
Table 8 extends the analysis by stratifying firms into low-, medium- and high-return groups, based on their pre-ban average daily returns. This approach allows us to test whether the ban’s effects varied across firms with different ex-ante return characteristics. The triple interaction terms (Liquidity group × NonMining × Ban) highlight an important asymmetry. For the high-return group, the coefficient is consistently positive and significant in the SSX, SSX non-dual-listed and overall samples. This indicates that non-mining firms with higher pre-ban return dynamics fared relatively better after the ban, compared to both mining firms and lower-return non-mining firms. The restriction thus appears to have cushioned speculative stocks most exposed to return volatility, redirecting trading activity in ways consistent with contemporary commentary on the reshaping of speculative flows.
Stratified difference in difference regressions on returns

Table 8 Long description
The table reports stratified difference-in-differences regressions of daily stock returns, splitting firms by pre-ban average returns (low, medium, high) and estimating results across SSX, MSX, non-dual-listed, dual-listed, and all firms, with two sets of specifications. The ban indicator is positive and statistically significant in every column, about 0.0049 to 0.0073, indicating higher daily returns during the ban period on average. Medium- and high-return groups have higher baseline returns than the low-return group, with the high-return coefficient consistently large and significant (about 0.012 to 0.019). However, the ban effect is reduced for medium- and especially high-return firms: the medium-group interaction with the ban is negative (about minus 0.0055 to minus 0.015, sometimes significant), and the high-group interaction is negative and usually significant (about minus 0.0072 to minus 0.019). Non-mining status alone is small and not statistically significant, while some non-mining interactions are negative, and the three-way interaction for high-return non-mining firms during the ban is positive and sometimes significant, partially offsetting the negative high-return interaction in some samples. In the alternative specifications (columns 7 to 12), market daily return is strongly positive and significant in most samples, while paid-up capital and share denomination are generally small and not significant. Sample sizes range from about 2,721 to 12,875 observations, and adjusted R-squared values are low (roughly 0.007 to 0.018), so effects should be interpreted as modest in explanatory power and conditional on the model and sample definitions.
Notes: This table presents regression results, stratified by pre-ban return levels, to examine the impact of the short-selling ban on daily stock returns. Low_r, Med_r and High_r represent firms grouped by their average daily returns during the pre-ban period, using the full sample of firms (both mining and non-mining). Their interactions with Ban capture the differential effect of the restriction. Columns (1)–(6) report results for the SSX, MSX, non-dual-listed, dual-listed and full samples, while columns (7)–(12) show alternative specifications. Standard errors are in parentheses.
*** , ** and * denote statistical significance at the 1%, 5% and 10% levels, respectively.
The extended three-way interaction results in Table A3 in Appendix G are broadly consistent with the baseline findings. The High_r × NonMining × Ban term remains positive and significant in the SSX sample under the capped-fill (option 3) specification, while becoming insignificant in the more restrictive price- and quote-filtered samples (options 1 and 2). This likely reflects the much smaller and more homogeneous subset of firms meeting the 85 per cent coverage requirement, which limits the cross-sectional variation needed to detect differential effects across return groups.
Our findings differ from the predictions of Miller (Reference MILLER1977) and Diamond and Verrecchia (Reference DIAMOND and VERRECCHIA1987), which emphasise overvaluation mechanisms when short-selling is restricted. In the Australian case, the ban does not appear to have inflated prices for non-mining firms. Instead, the return regressions suggest that prices broadly tracked underlying market conditions, with the ban neither amplifying nor reversing return trends in a systematic way. To the extent that effects are detected, they appear in the form of increased return variation among firms with extreme high pre-ban performance.
These results stand in contrast to our liquidity evidence presented above, where the ban produced significant and heterogeneous effects on spreads and volumes. For returns, by contrast, the estimated effects are weak, economically small, and largely undifferentiated between mining and non-mining firms. The most conservative interpretation is that the ban influenced how stocks traded, without fundamentally altering their price trajectories. In this sense, the Australian bans functioned more as liquidity shocks than as valuation distortions.
V
This article examines whether self-imposed short-selling bans stabilised markets, improved liquidity, or enhanced price efficiency, drawing on evidence from the SSX and MSX during the 1930s. Our findings point instead to unintended consequences and limited effectiveness.
The most consistent evidence concerns bid–ask spreads. We find that the ban significantly widened spreads for non-mining firms, particularly on the SSX where enforcement was stronger, while effects on the MSX were weaker and statistically insignificant. These results are consistent with Beber and Pagano (Reference BEBER and PAGANO2013) and Diamond and Verrecchia (Reference DIAMOND and VERRECCHIA1987), who show that short-selling restrictions impair liquidity by raising transaction costs and restricting informed trading. However, the stratified analysis reveals that for the most illiquid firms, spreads did not widen and in some cases even narrowed, supporting the view that bans can reduce speculative pressure in thin markets (Kolasinski et al. Reference KOLASINSKI, REED and THORNOCK2013; Fohlin et al. Reference FOHLIN, LU and ZHOU2022).
The impact on trading volumes is more complex. Contrary to the expectation that bans reduce market participation, we do not observe a uniform decline. Some non-mining firms – particularly those listed only on the SSX – recorded increases in activity following the restriction. Stratified regressions show highly traded firms experienced volume contractions, consistent with bans discouraging participation where speculative short-selling had been most active.
For returns, the evidence is notably weaker. Across specifications, the ban did not systematically alter daily returns for non-mining firms, and the estimated interaction terms are generally insignificant. We find no evidence that short-selling restrictions produced systematic overvaluation. Instead, the results imply that prices largely tracked broader market conditions, while the ban’s main effect was on liquidity rather than valuation.
Our article contributes to the broader understanding of short-selling restrictions in financial markets, particularly in self-regulated environments. The bans worsened liquidity in many segments, shifted rather than uniformly reduced trading activity, and left returns essentially unaffected. The divergent experiences of the SSX and MSX underscore the importance of enforcement strength and institutional design in shaping outcomes. These insights are particularly relevant for modern self-regulated markets, such as cryptocurrency exchanges and decentralised finance platforms, where market participants operate with minimal government oversight. Offers by self-regulated markets that they can impose bans to stabilise markets at times of uncertainty should be treated with caution, if not scepticism.
Appendix
Appendix A. Sample page from The Age, ‘Stocks & Shares’, 13 June 1930
Source: The Age, 13 June – 2 August 1930, from http://nla.gov.au/nla.news-article203089953 to http://nla.gov.au/nla.news-article202469731

Figure A1 Long description
The table is divided into three main sections: Stocks and Shares, Investment Stock and Mining Shares. Each section contains multiple columns including company or stock name, buying price, selling price and price change values. Prices are expressed in pounds, shillings and pence format. The Stocks and Shares section is the largest, containing approximately 30 or more rows listing individual company names alongside corresponding numeric price columns. Notable entries include Commonwealth Stock Confirm and various preference stocks. Price values appear across columns labeled with numeric headings indicating current and previous prices along with movement indicators. The Investment Stock section continues with similar column structure, listing additional company names with corresponding price data. Entries include named investment trusts and government-linked stocks. Some rows show dashes indicating no change or no data available. The Mining Shares section appears at the lower right and is shorter in length, containing around 10 rows. It lists mining company names such as Copper related entries alongside numeric price columns. Column headers across all sections include fields for current price, previous price and change, with some sub-columns showing high and low values. Certain rows appear in bold or larger print indicating notable movers or highlighted entries. The overall table spans the full page width and is printed in small dense typeface consistent with a newspaper financial page.
Appendix B. Sample page from The Sun, ‘Quotations on High 'Change’, 12 June 1930
Source: The Sun, 12 June – 1 August 1930 (Final extra), from http://nla.gov.au/nla.news-article224268781 to http://nla.gov.au/nla.news-article224260303

Figure A2 Long description
The table is titled Quotations on High Change at the top. It is formatted in a newspaper-style multi-column layout with dozens of entries arranged across several narrow columns side by side. Each entry includes a stock or company name, a numeric price value and a numeric change value. The change values appear as small positive or negative numbers alongside the price figures. Some entries show no change value, with the corresponding cell left blank. Representative visible entries include names such as Tramways, Land and various abbreviated company titles paired with numeric price figures and small change figures. The data is printed in small type across what appears to be four or more parallel columns, each following the same structure of name, price and change. The layout is consistent throughout, with entries running top to bottom within each column before continuing in the next. No units label is explicitly printed next to individual values in the visible text.
Appendix C. Sample page from The Sun, ‘To-day’s sales and turnover’, 12 June 1930
Source: The Sun, 12 June – 1 August 1930 (Final extra), from http://nla.gov.au/nla.news-article224268780 to http://nla.gov.au/nla.news-article224260268

Figure A3 Long description
The table is titled To-day′s Sales and Turnover and presents daily market data across multiple categories of securities. The data is arranged in sections, each covering a distinct asset category. Values appear to represent price quotes in pounds, shillings and pence, alongside percentage coupon or yield rates. A footnote at the bottom states: Turnover exclusive of vestibule sales. Section 1: Federal Loans. Entries include 100 pounds bonds at 5 and a half percent, 1933, with prices ranging from 99 pounds 8 shillings 6 pence to 100 pounds 5 shillings. A further entry lists 10 pounds bonds at 5 and a half percent, 1932, quoted at 9 pounds 17 shillings 6 pence. Section 2: N.S.W. Funded Stock. Listed as 5 percent, taxable, with a price of 1 and 7 eighths percent noted alongside. Section 3: Banks. Commercial of Sydney listed at 5 pounds with a quote of 21 pounds 7 shillings 6 pence. Commercial of Australia listed at 5 pounds with a quote of 21 pounds 5 shillings. General is listed at 12 shillings 8 pence. A.P.A. is listed at 1 pound 3 shillings 6 pence. Section 4: Insurance. Adelaide General at 12 shillings 8 pence and A.P.A. at 1 pound 3 shillings 6 pence. Section 5: Miscellaneous. Entries include Breweries at 35 shillings 6 pence, 6 pence and 25 shillings. Associated Hordern at 18 shillings to 1 pound 5 shillings 6 pence. Aust. Glass at 6 pence to 42 shillings 9 pence. Jones 2nd pref at 20 shillings 6 pence. Denjon-Perdriau at 14 shillings 6 pence, 18 shillings and 18 shillings 6 pence. Goodyear pref at 25 pence. Horksball at 100 shillings. W.A.W. at 20 shillings 6 pence. Standard Cement at 2 shillings 6 pence. Penfolds at 1 pound 4 shillings 6 pence. Wunderlich pref at 100 shillings. Winderich at 1 pound 5 shillings. Section 6: Gold. Luckens pref at 1 shilling 8 pence. C.I. Goldfields at 3 shillings 4 pence. Alkane at 3 shillings 4 pence. Alumin at 2 shillings 6 pence. Broken Hill at 2 shillings 3 pence. Section 7: Tin. Larut at 5 shillings 6 pence. Kamonene at 1 pound 1 shilling 6 pence. Kuala Kampar at 1 pound 3 shillings 6 pence. Sugar at 42 pounds 12 shillings 6 pence and 42 pounds 15 shillings. David at 42 pounds 18 shillings 6 pence.
Appendix D. Chronology of short-selling bans in 1930 across Australian stock exchanges
This appendix draws on contemporary newspaper reports and archival records to detail the timing, motivations and scope of regulatory actions taken by the Sydney (SSX), Melbourne (MSX), Adelaide (ASX) and Brisbane (BSX) stock exchanges

Appendix E. Selected newspaper commentary on the 1930 short-selling ban debate
This appendix compiles selected quotes from contemporary newspapers offering insight into the rationale, controversy and divergent views surrounding short-selling and forward-dealing bans, particularly with respect to investment versus mining stocks.
The Sydney Morning Herald, 8 July 1930, p. 11. ‘Stock exchange business: forward dealing prohibited on call’
Investment securities have undergone a drastic marking down necessitated by depression in the external influences which affect the market, and the Stock Exchange committee, by virtue of its position of responsibility to investors, adjudges that the time has arrived when depreciation of share values should not be accentuated by purely market operations.
The Sydney Morning Herald, 7 July 1930, p. 4. ‘“Forward” restrictions discussed: Stock Exchange holds special meeting’
On the MSX meeting:
The opinions expressed at the meeting will guide the Exchange in its policy toward forward operations. Although no official statement has been made, it is known that the proposals originated from a section of members who consider that speculative sellers, operating mainly on a forward basis, have contributed to the weakness of the market in recent months and have forced prices in many cases to unnecessarily low levels. The subject has been widely discussed in Stock Exchange circles recently, but many of the most experienced operators do not favour any restrictions on the free working of the market, even as a temporary expedient.
The Age, 8 July 1930, p. 14. ‘Stock Exchange trading. “Forward” dealing discussed’
Members of the Stock Exchange of Melbourne, at a special meeting yesterday, discussed at length the advisability of placing a restriction on ‘forward’ dealing in general investment and mining stocks. This form of trading permits of the delivery of scrip in six weeks. Divergent views were expressed, and the general opinion appeared to be that, in respect of mining stocks at least, a suspension would be undesirable. A decision has yet to be arrived at in relation to investment stocks.
Appendix F. Additional summary statistics and mean differences
Summary statistics and mean differences (pre-ban and immediate post-ban period)

Table A1 Long description
The table summarizes pre-ban trading and firm characteristics using mean, median, variability, range, and number of observations for each variable. Non-mining firms make up about three quarters of observations (mean 0.749; 9,796 firm-days). Quoted prices are right-skewed: the median bid is 18.5 shillings and the median ask is 19.5 shillings, while means are higher (about 35.6 and 37.0) and maxima reach roughly 850 to 860. Trading activity is limited in the typical case (median volume 500 shares per day) but varies widely up to 13,000, and volume has fewer observations (650) than quotes. Sale prices, when available, have a median of 20 shillings and a higher mean (47.5), indicating occasional very high transactions. Spreads are generally small (median 0.039; mean 0.093) but can be large in some cases (maximum near 2.0). Paid-up capital and share denomination show substantial dispersion, with medians around 300,914 pounds and 20 shillings, respectively, and very large maxima. Daily stock returns are centered near zero (median 0.000; mean about negative 0.003) with a range from about negative 0.155 to 0.131. Because observation counts differ by variable, comparisons across rows should consider missing data and differing sample sizes.
Note: This table presents summary statistics and group mean differences for key variables in the dataset – including bid and ask prices (in shillings), trading volume (shares per day), sale prices, bid–ask spreads, and firm characteristics – across three distinct periods surrounding the short-selling ban. Panel A reports statistics for all trading days prior to the implementation of the ban. Panel B presents statistics for the ban announcement day (Day 0), while Panel C covers the ban day and the two subsequent trading days (Days 0 to 2). In Panels B and C, we also report mean differences (A minus B, and A minus C, respectively) and t-statistics to assess statistical significance. NonMining is an indicator for firms that do not operate in the mining sector. Bid and Ask are the highest and lowest quoted prices for a given day. Volume is the number of shares traded. Sale price refers to the transaction price in shillings, when available. Spread is the relative bid–ask spread, defined as (Ask–Bid)/(Mid), where Mid is the mid-quotes. Paid-up capital is recorded in pounds (£), while share denomination is in shillings (s.). Daily stock return is the log return in mid-quotes (filled using last observation carried forward within firm). # Obs. denotes the number of firm-day observations available. t statistics are reported in parentheses. * p < 0.05, ** p < 0.01 and *** p < 0.001.
Appendix G. Robustness checks for alternative return constructions
Robustness of difference in difference regressions on returns

Table A2 Long description
Panel A reports difference in difference style regressions where the outcome is daily stock return, estimated separately for SSX, MSX, non dual listed subsamples, dual listed firms, and the pooled sample. In the baseline specifications without added controls, the Ban coefficient is near zero across groups (about minus 0.003 to plus 0.009) and is not statistically significant; the NonMining indicator is also near zero and not significant where estimated. The interaction between NonMining and Ban is likewise small (roughly minus 0.008 to plus 0.007) and not statistically significant, suggesting no clear differential return response for non mining firms during the ban in this panel. In the expanded specifications that add an equal weighted market return and firm controls, the market return is positive and statistically significant in most samples, including SSX (about 0.30, significant), MSX (about 1.14, highly significant), and the pooled sample (about 1.00, highly significant), while it is not significant for the dual listed sample. Other added controls such as paid up capital and share denomination are generally not statistically significant. Model fit varies widely, with adjusted R squared near zero in many columns but very high for the MSX non dual listed sample in the controlled specification, so results should be interpreted with attention to sample size and specification differences. Observations range from 36 in the smallest subsamples to 324 in the pooled sample.
Notes: This table reports the results of the event-study regressions corresponding to Table 7 in the main text, using three alternative constructions of daily returns that address missing-price interpolation and thin trading. Panel A restricts the sample to firms with at least 85 per cent observed transaction prices (Option 1). Panel B repeats the analysis using bid–ask mid-quotes with the same 85 per cent coverage threshold (Option 2). Panel C employs the full sample of firms without a coverage threshold but allows mid-quotes to be carried forward for at most three trading days since the last observed quote (Option 3). The dependent variable is the daily return. All specifications include an equal-weighted market return constructed from the corresponding option. Standard errors are in parentheses.
* , ** and *** indicate significance at the 5%, 1% and 0.1% levels, respectively.
Robustness of stratified difference in difference regressions on returns

Table A3 Long description
Panel A reports event-study difference-in-differences regressions where the outcome is daily stock return, estimated across 12 specifications split by exchange sample (SSX, MSX), listing status (non-dual-listed, dual-listed), and an all-firms sample. Key regressors include indicators for a ban period, sector (non-mining), return strata (medium and high), and their interactions; later specifications also add an equal-weighted market return plus firm controls. Most Ban coefficients are close to zero and statistically insignificant across samples, including the all-firms models (about 0.004 in column 6 and near zero in column 12). Interaction terms involving the ban and return strata are also generally small and not statistically significant, with several cells reported as zero or not estimated for restricted subsamples. In contrast, the market return control is positive and statistically significant in multiple models, notably in the MSX sample and the MSX non-dual-listed sample where the estimated market sensitivity is very large and highly significant. Model fit varies widely: adjusted R squared is negative in several baseline specifications but rises substantially when market return and controls are included, reaching about 0.93 in the MSX non-dual-listed specification with controls. Sample sizes range from 36 observations in the non-dual-listed subsamples to 324 in the all-firms specifications, so precision differs across columns and several estimates are unavailable in smaller subsamples.
Notes: This table reports the results of the event-study regressions corresponding to Table 8 in the main text, re-estimated using three alternative constructions of daily returns that address missing-price interpolation and thin trading. Panel A restricts the sample to firms with at least 85 per cent observed transaction prices (Option 1). Panel B repeats the analysis using bid–ask mid-quotes with the same 85 per cent coverage threshold (Option 2). Panel C employs the full sample of firms without a coverage threshold but allows mid-quotes to be carried forward for at most three trading days since the last observed quote (Option 3). The dependent variable is the daily return. All specifications include an equal-weighted market return constructed under the corresponding option. Standard errors are in parentheses.
* , ** and *** indicate significance at the 5%, 1% and 0.1% levels, respectively.
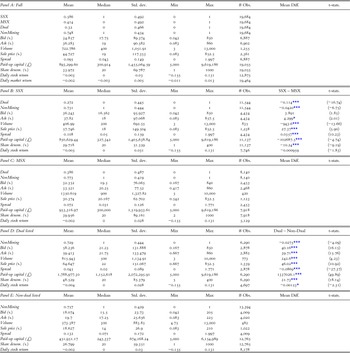


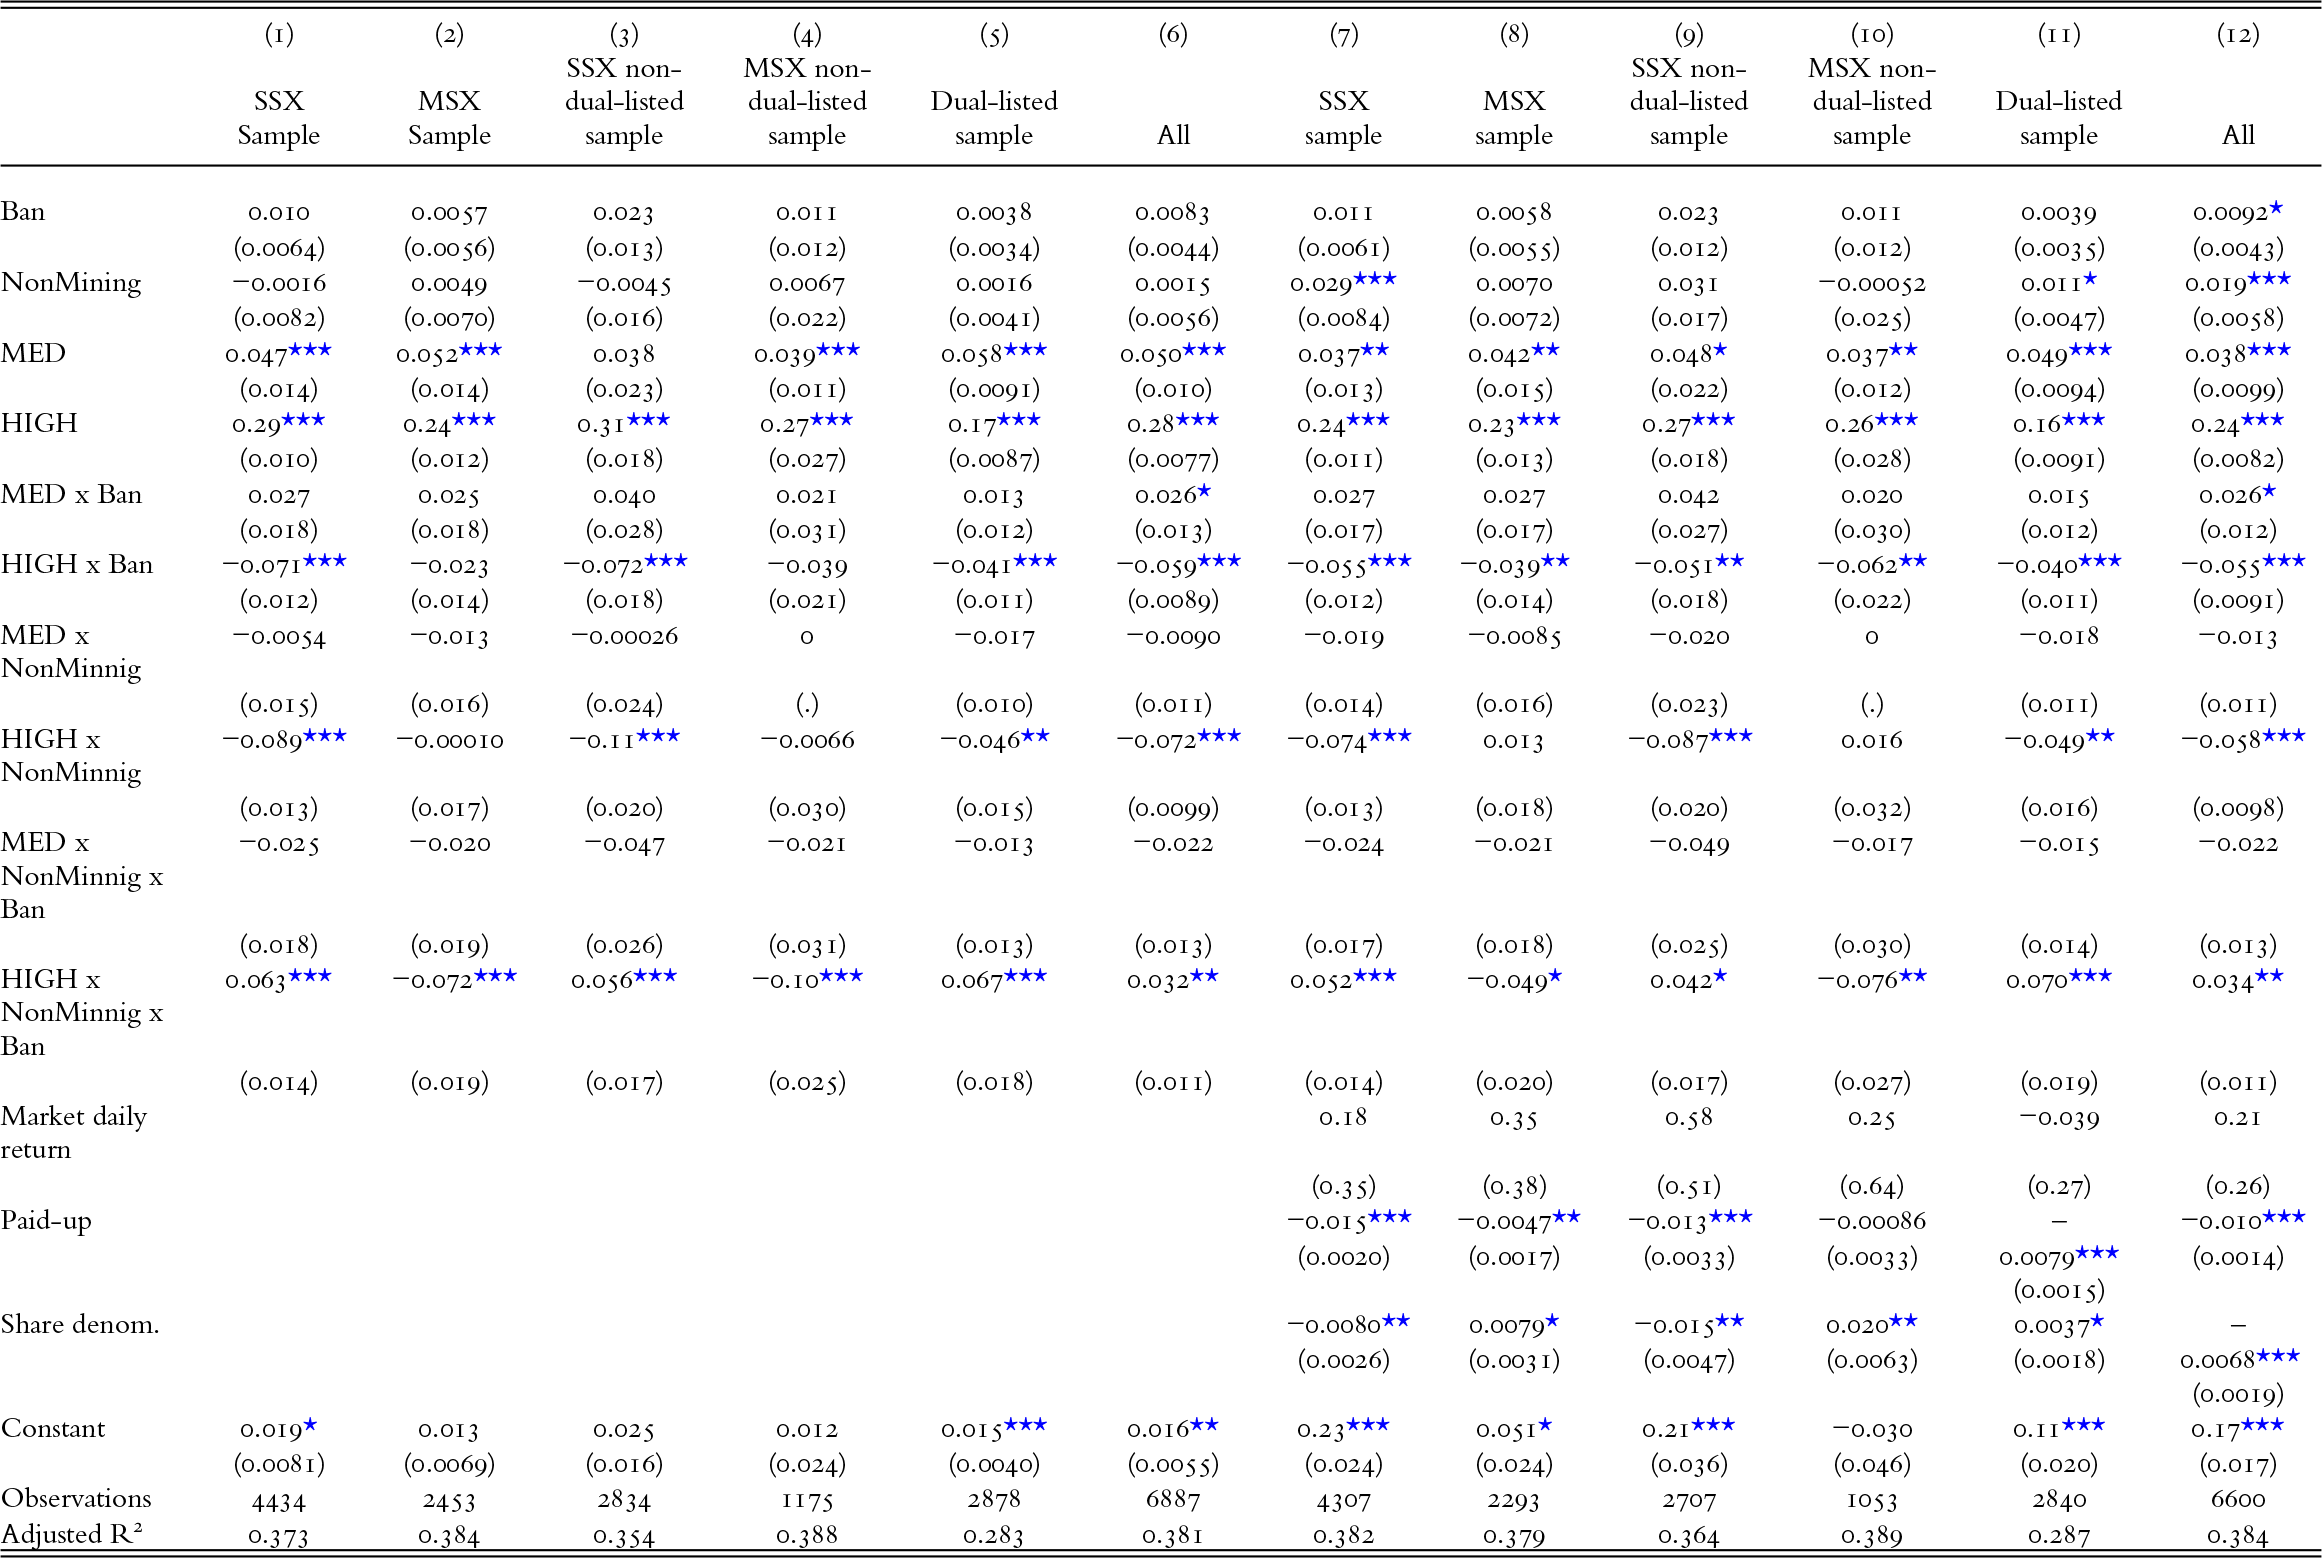

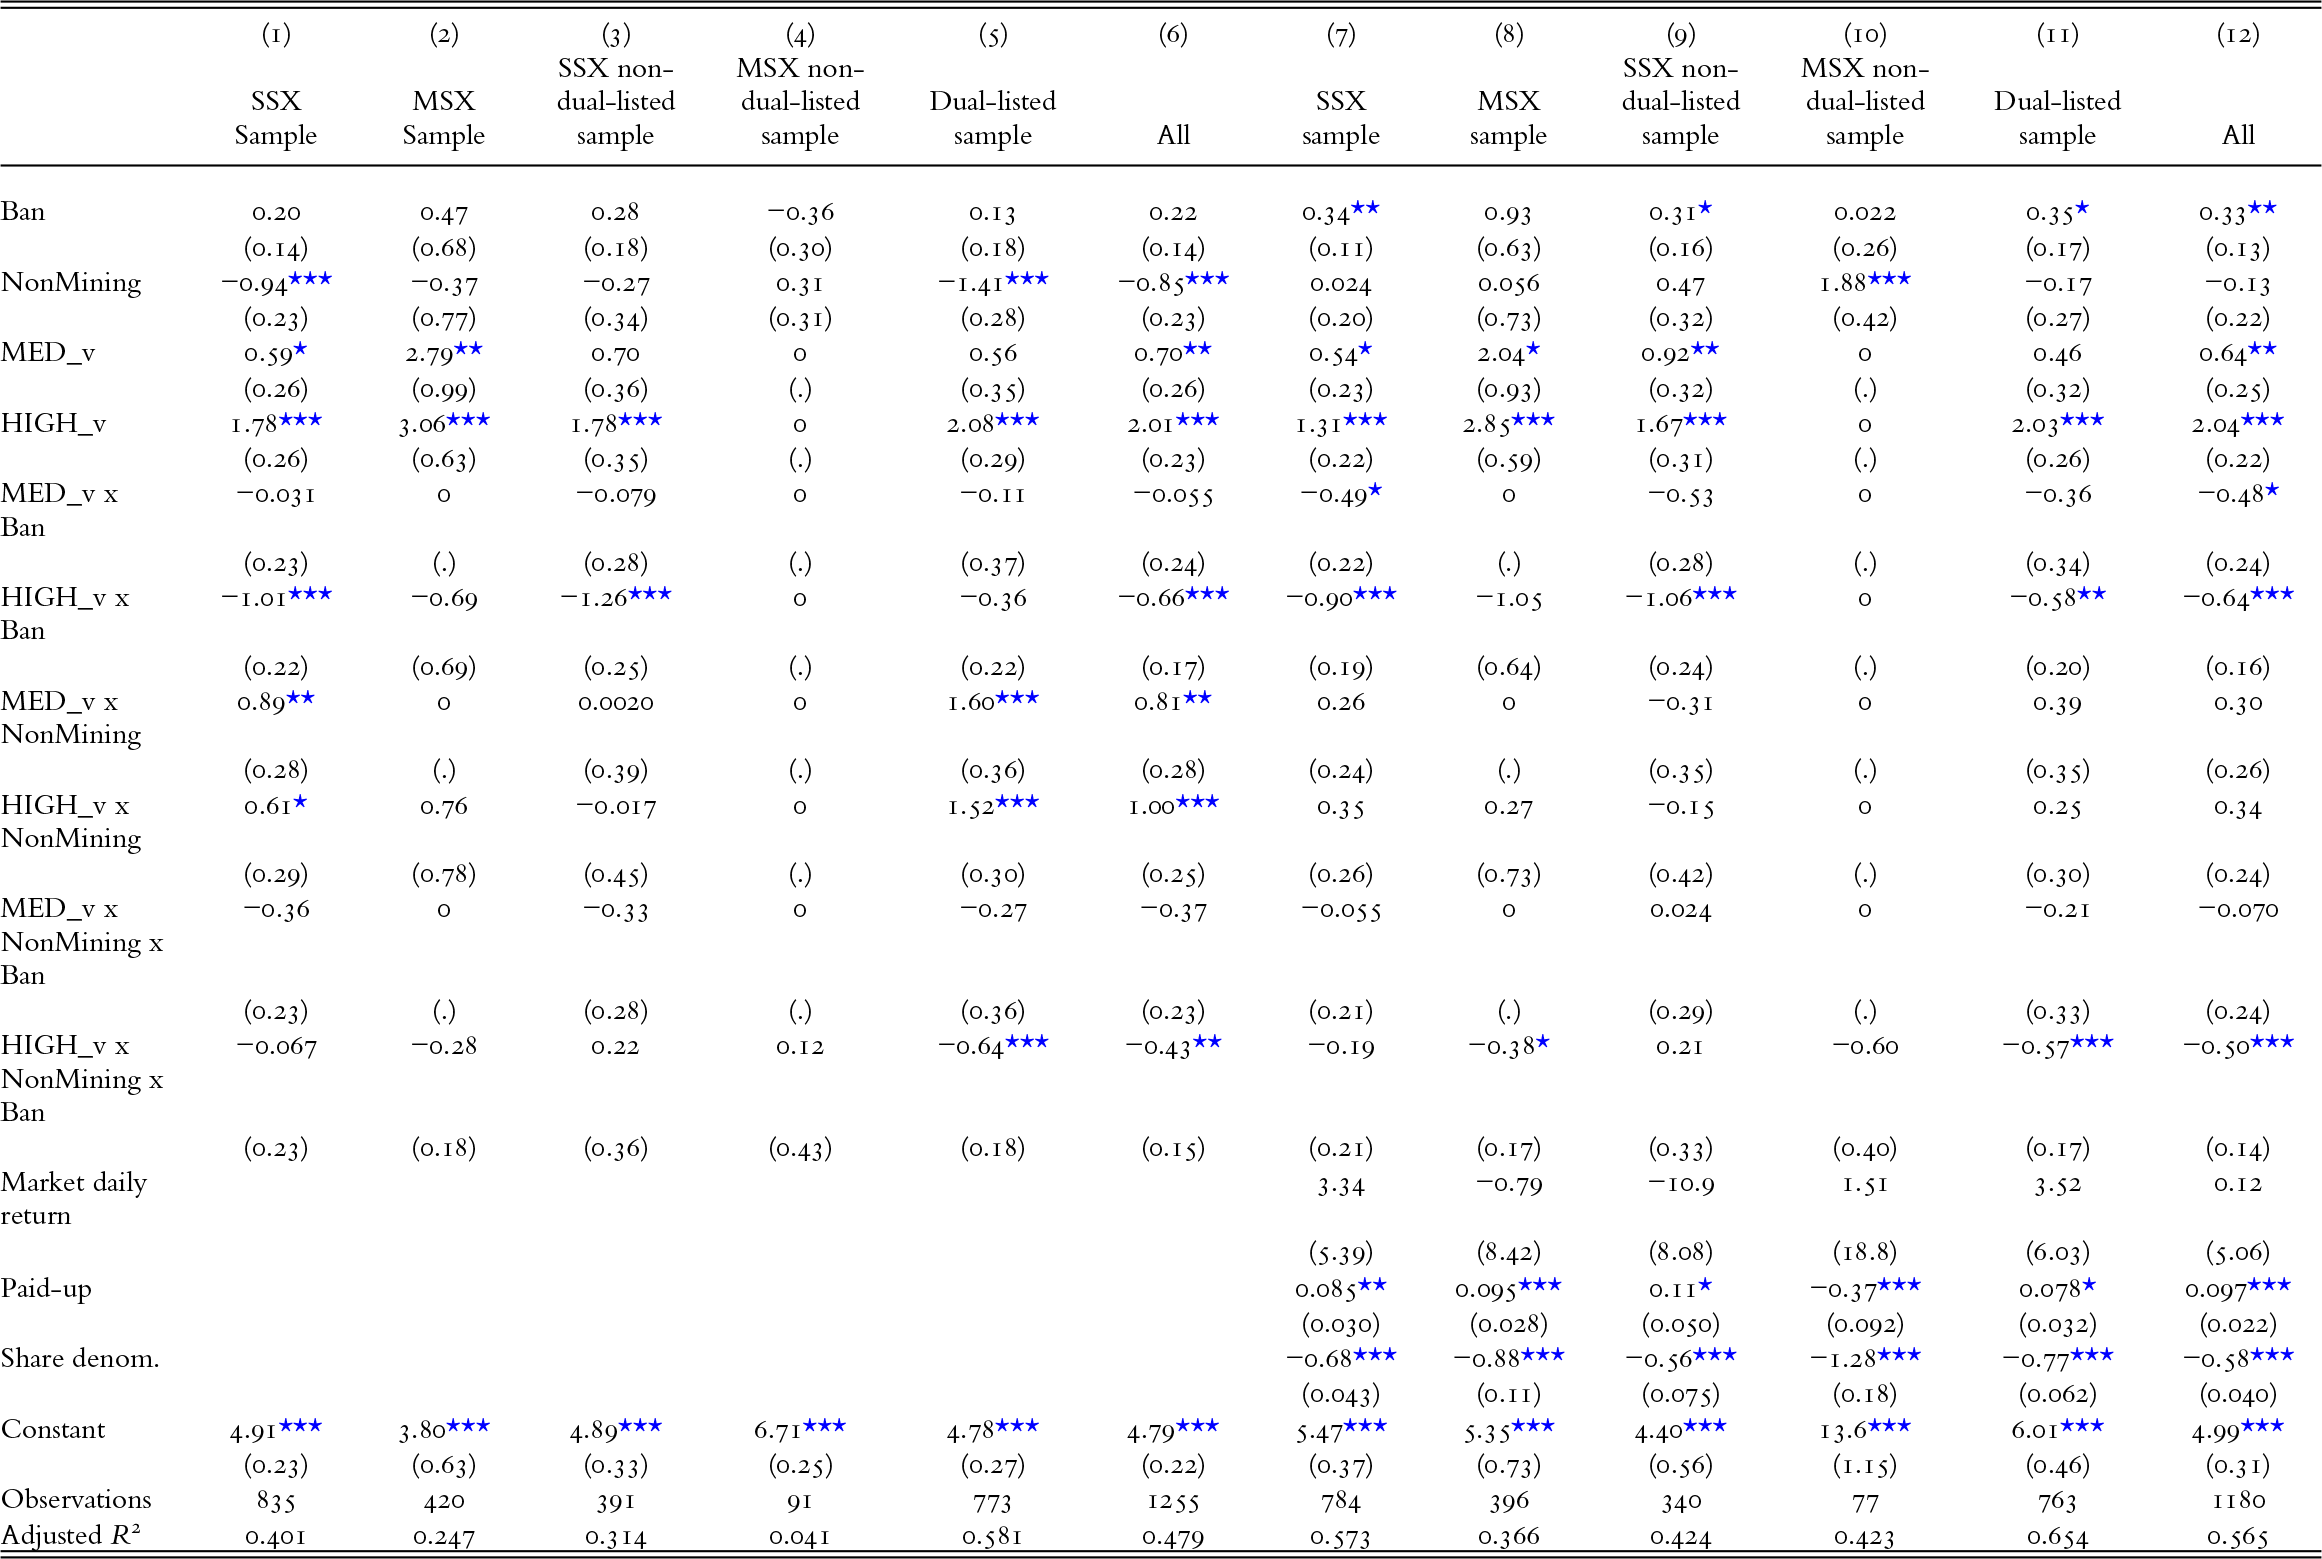
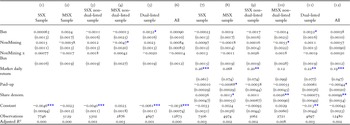
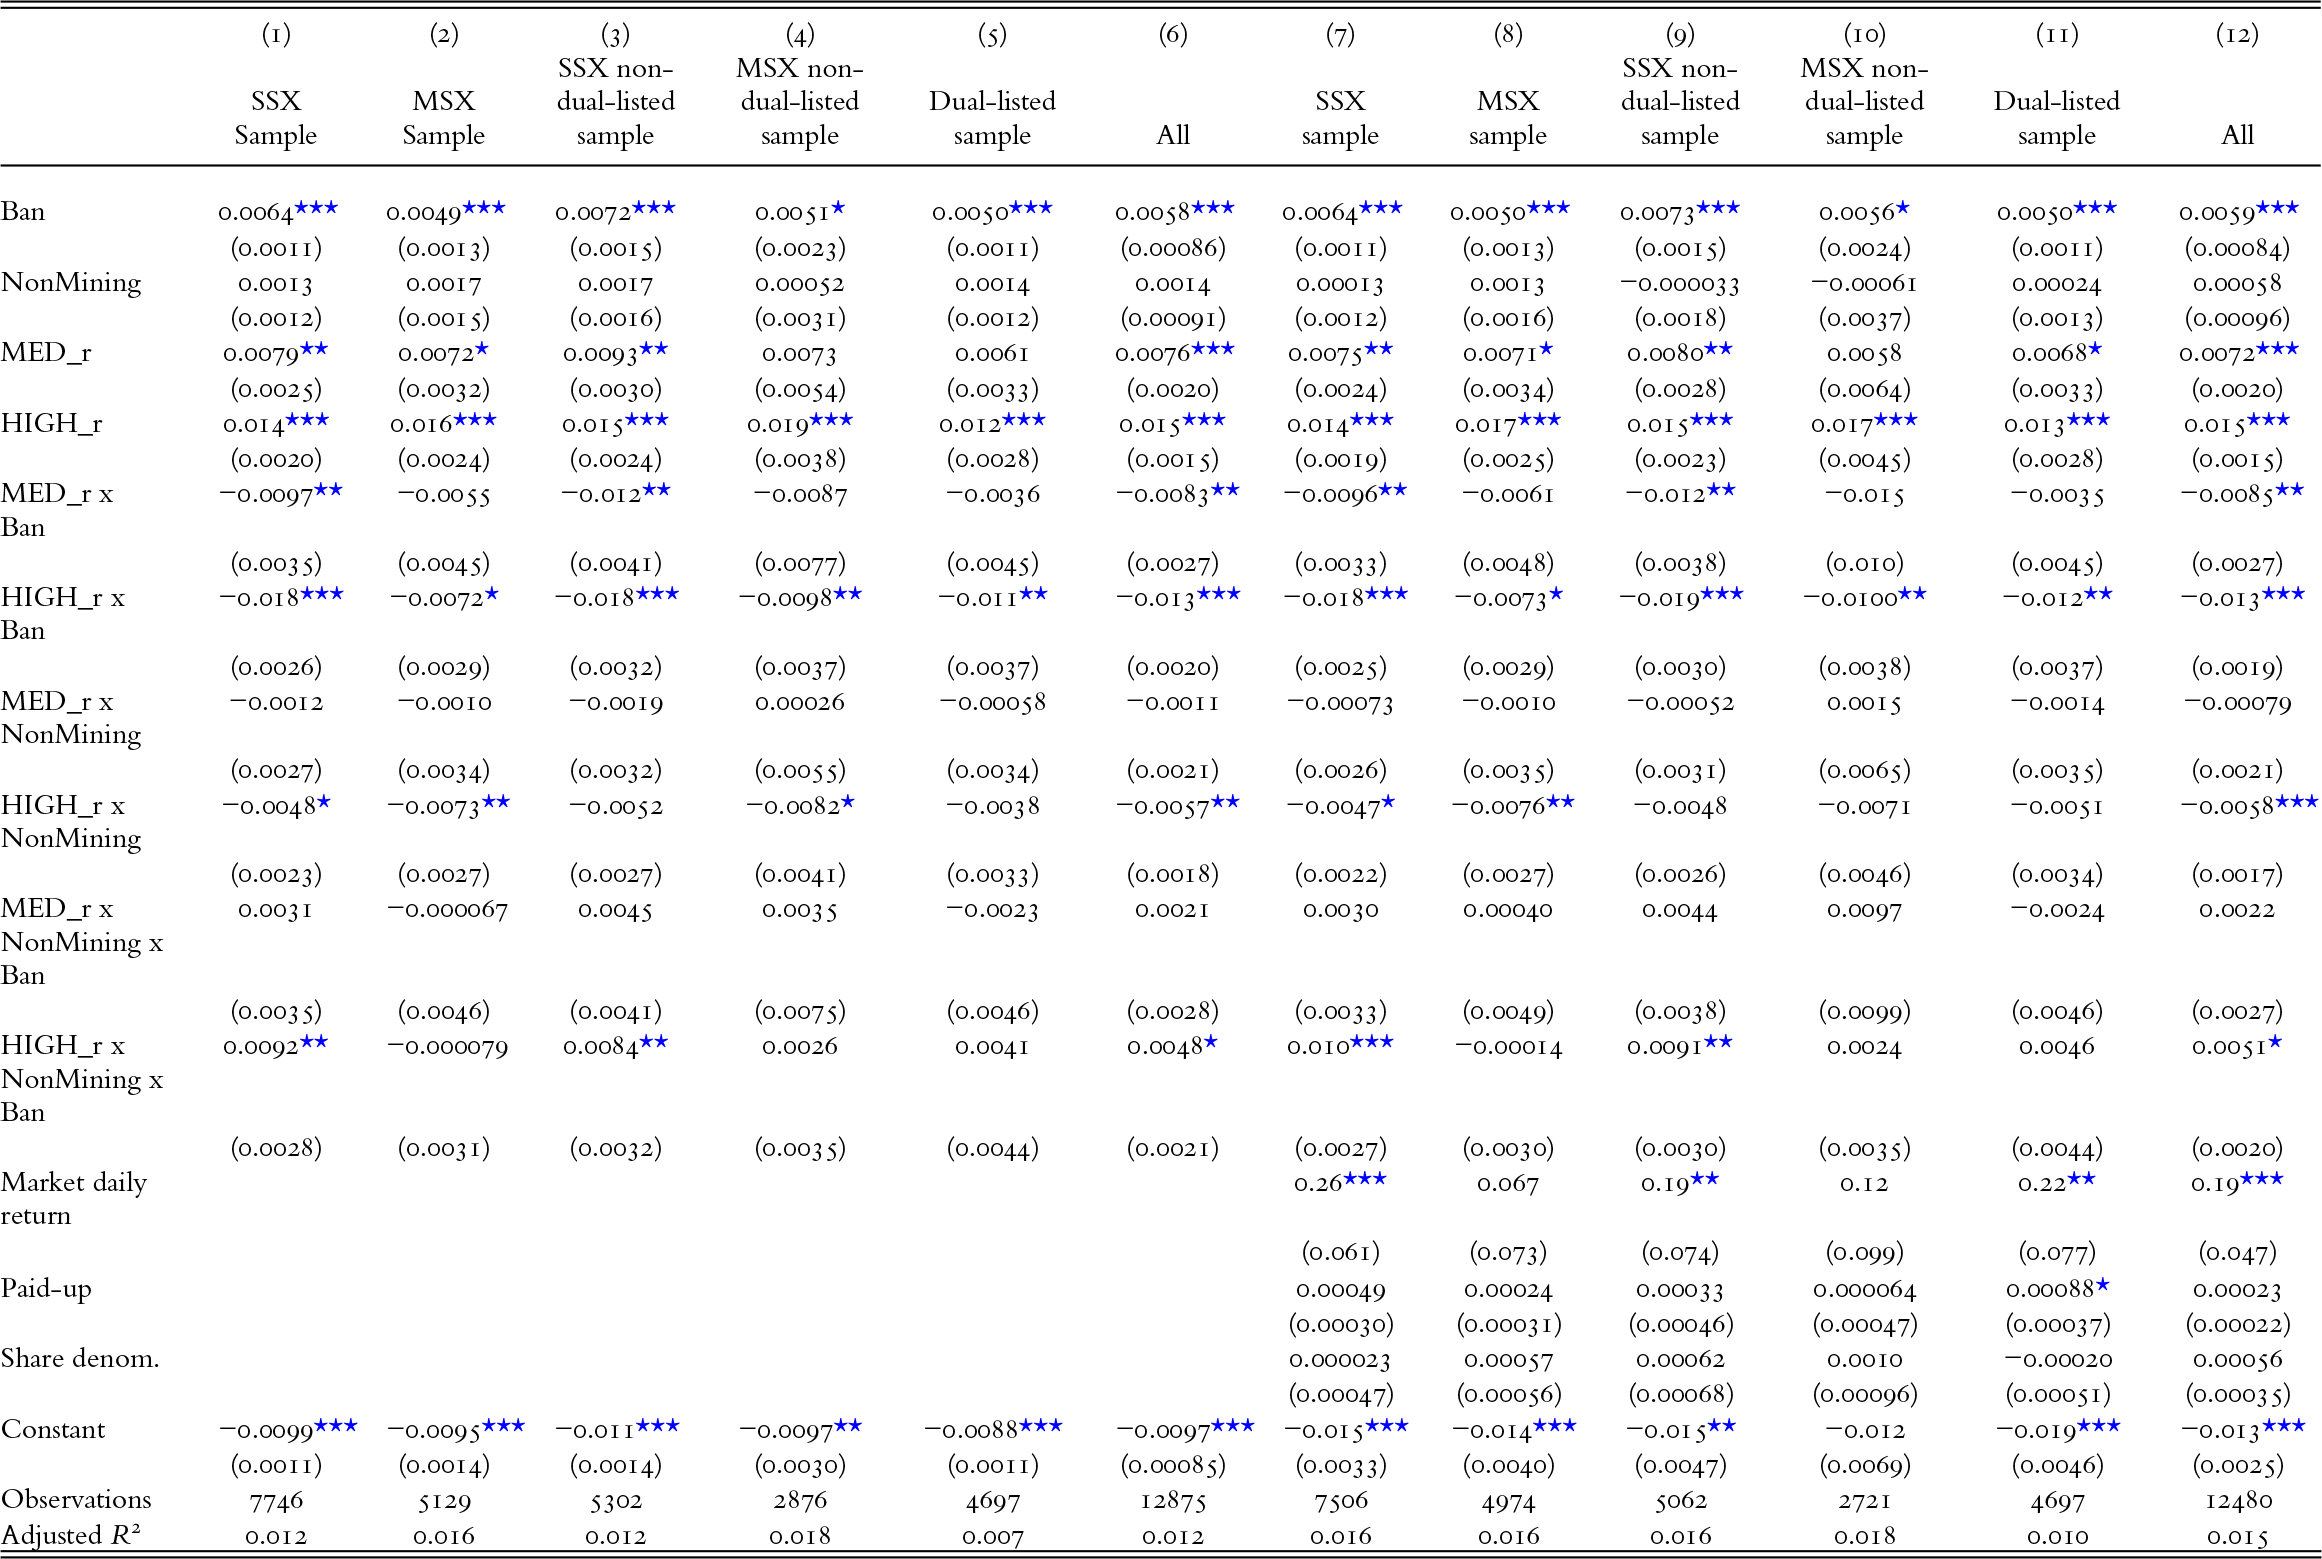


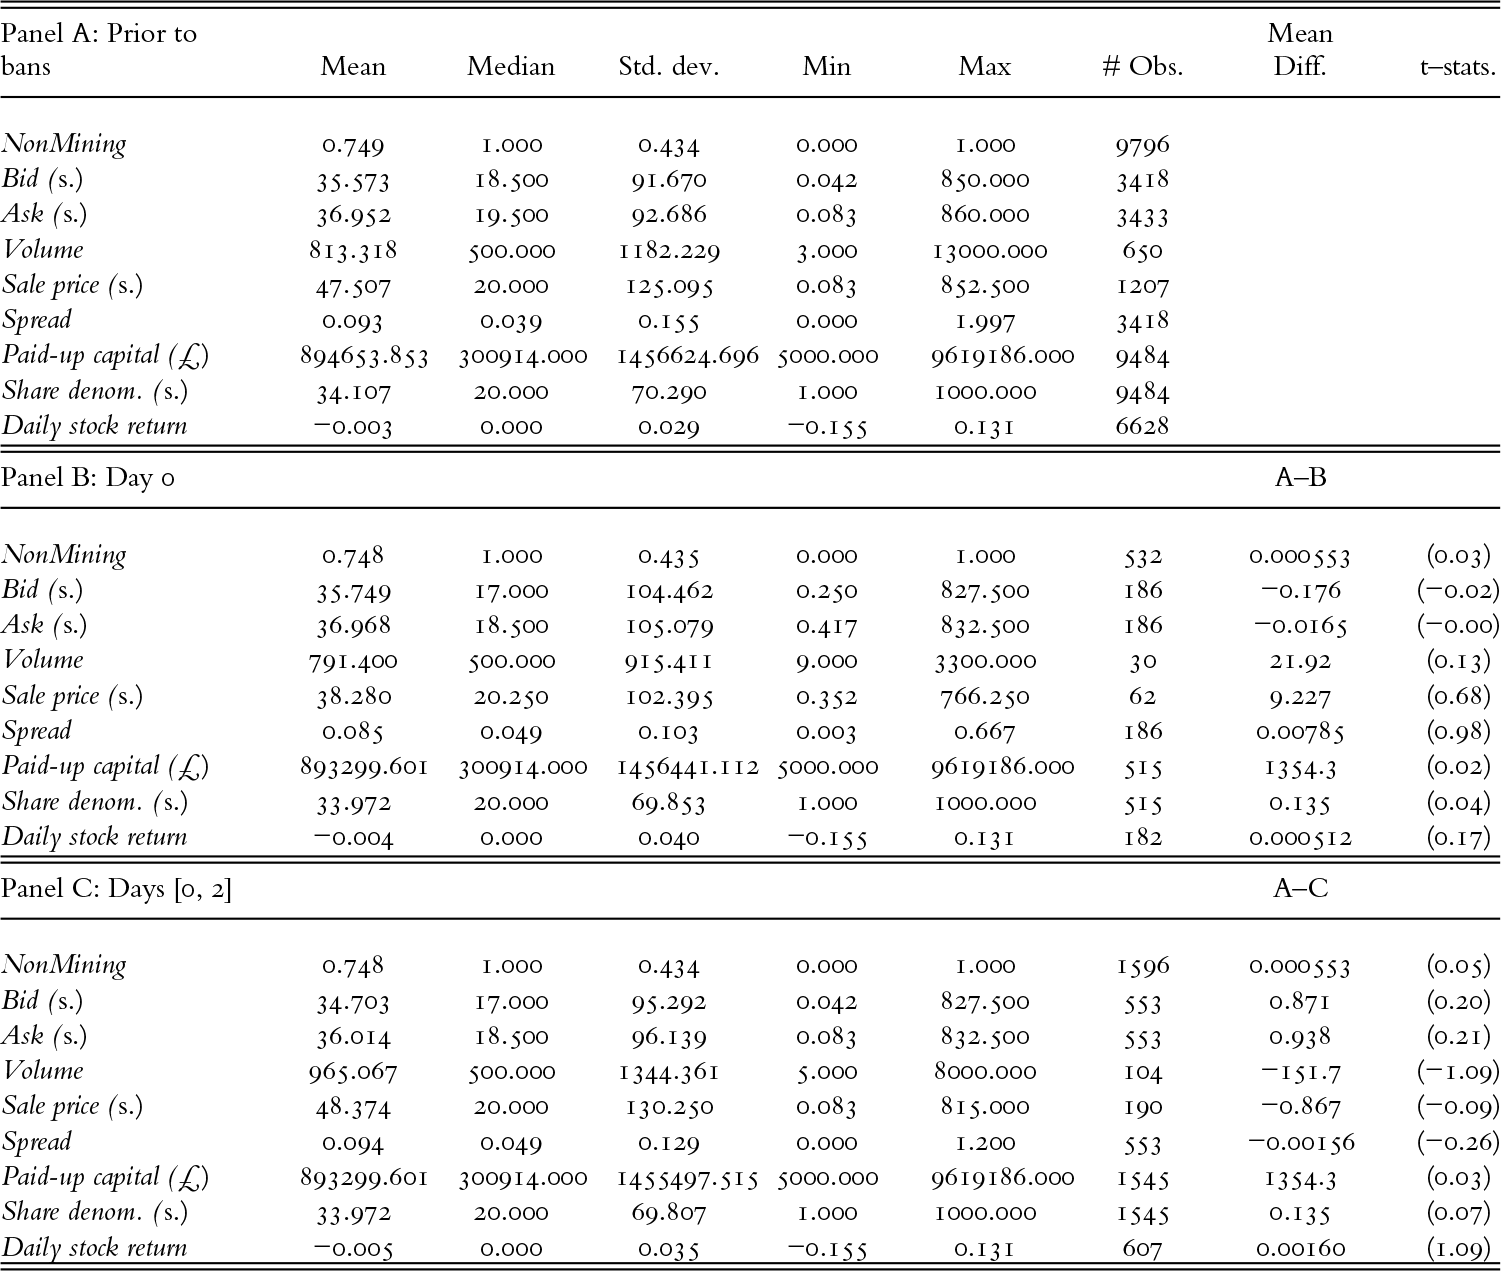


 Open access