


β-Carotene is a major source of vitamin A from plant-based diets for a large segment of the population, especially for those in developing countries. As an important precursor of vitamin A, it plays a major role in normal vision. Besides this, β-carotene also plays an important role in human health by acting as a natural antioxidant, protecting cells and tissues from the damaging effects of free radicals and singlet oxygen(Reference Benedich1). β-Carotene imparts several of its health benefits through its antioxidant property, which makes it an important nutrient in the prevention of CVD and several types of cancer(Reference Young and Lowe2). It has important protective effects against CVD, erythropoietic protoporphyria, cancer, cataract, immune response and cystic fibrosis. β-Carotene brings about immunomodulation by stimulating the immune response, protecting phagocytic cells from auto-oxidative damage, enhancing T- and B-lymphocyte proliferative responses, stimulating effectors of T-cell functions, enhancing macrophages and cytotoxic T-cells, enhancing the tumoricidal capacity of natural killer cells and increasing the production of certain interleukins(Reference Benedich1, Reference Young and Lowe2).
Spices, natural food additives that contribute immensely to the taste and flavour of our foods, have been recognised to possess several medicinal properties and have been effectively used in the indigenous systems of medicine in India and other countries(Reference Nadkarni and Nadkarni3). Apart from their traditional use, a host of beneficial physiological effects have been brought to the fore by extensive animal studies and several human trials during the past three decades(Reference Srinivasan4). Among these are their ability to stimulate digestion, beneficial influence on lipid metabolism, anti-lithogenic influence, anti-diabetic effect, antioxidant property, anti-inflammatory potential and cancer-preventive potential.
Capsaicin, the pungent principle of the hot spice red pepper, is a known hypocholesterolaemic agent and can induce body heat and possibly enhance energy expenditure and prevent oxidative stress(Reference Govindarajan and Satyanarayana5). The antioxidant potential of capsaicin has been experimentally documented in in vitro systems and in a few in vivo studies(Reference Srinivasan4). Ginger, a pungent spice, is used in a variety of foods in both fresh and dry forms and also in carbonated drinks(Reference Govindarajan6). Piperine, the bioactive compound of black pepper, has been endowed with an ability to enhance the bioavailability of a number of therapeutic drugs as well as phyto-nutrients(Reference Srinivasan7). It is also evident that the bioavailability of these compounds by piperine is partly attributable to an increased absorption, facilitated by alterations in the intestinal epithelial membrane lipid dynamics and permeation characteristics. It would be most relevant to understand whether these compounds also enhance the bioavailability of β-carotene by facilitating its intestinal absorption. Higher uptake of β-carotene ex vivo by the intestinal segments was evidenced in animals fed black pepper/piperine, ginger and red pepper/capsaicin, with dietary piperine increasing the uptake of β-carotene by as much as 2·5-fold(Reference Veda and Srinivasan8). Thus, there is an indication that the three pungent spices tested in the present study might alter the permeation characteristics presumably by increasing the absorptive surface and thereby enhance the intestinal absorption of β-carotene. It would be most relevant to evidence the potential of these specific dietary spices to beneficially alter the absorbability of β-carotene in the in vivo system, thus contributing to its increased bioavailability.
In vertebrates, provitamin A carotenoids are converted to retinal by the enzyme β-carotene 15,15′-dioxygenase (EC 1.13.11.21), recently rechristened as β,β-carotene 15,15′-mono-oxygenase (EC 1.14.99.36)(Reference Borel, Drai and Faure9), and further converted to retinol by retinal reductase, the activity of which is expressed specifically in the intestinal epithelium and liver. The intestinal enzyme determines whether provitamin A carotenoids are converted to vitamin A or circulated in the body as intact carotenoids. Thus, the bioconversion of β-carotene to retinal is dependent on the regulation of the activity of these enzymes. Since the cleavage enzyme is located in the intestinal cells, which are directly exposed to various food components, actions of dietary components such as spices on the enzyme activity might affect the bioavailability of β-carotene derived from plant foods and its bioconversion to vitamin A. Thus, the possible modulation of the conversion efficacy of β-carotene to vitamin A by dietary factors such as spices also merits investigation.
The present study was conducted to evaluate the potential of dietary piperine, capsaicin and ginger on the absorption of the orally administered fat-soluble nutrient β-carotene. The present animal study also evaluated the influence of these dietary spices on the conversion efficacy of β-carotene to vitamin A. The study was further extended to understand the activities of two enzymes specifically involved in the bioconversion of β-carotene to vitamin A in the intestine and liver of spice-fed animals. In the present study, the spice-active principles, piperine, capsaicin and zingerone, were also examined for their in vitro influence on the activities of β-carotene 15,15′-dioxygenase and other enzymes involved in the intestinal conversion of β-carotene.
Experimental methods
Materials
All-trans retinol, all-trans retinal, all-trans retinyl acetate, β-apo-carotenal, phosphatidylcholine, NAD, NADH, GSH and bovine serum albumin were obtained from Sigma Chemical Company (St Louis, MO, USA). Capsaicin (N-vanillyl-6-nonenamide), sodium taurocholate and dithiothreitol were obtained from M/s Fluka Chemie (Buchs, Switzerland). Piperine (1-piperoyl-piperidine) and zingerone were from M/s Aldrich Chemical Company (Milwaukee, WI, USA) . All other organic solvents used were of analytical reagent or of HPLC grade. Fresh ginger rhizomes were procured from a local supermarket. These were cleaned, macerated and freeze-dried into a dry powder.
Animal treatment
Animal experiments were carried out taking appropriate measures to minimise pain or discomfort in accordance with the standard guidelines laid down for the care and use of animals for experimental procedures and with due approval from the Institute's Animal Ethics Committee (CFTRI, Mysore, India). The animals were housed in individual stainless-steel cages and had free access to food and water. The basal control diet comprised 21 % casein, 10 % cane sugar, 54 % maize starch, 10 % refined peanut oil, 4 % Bernhardt–Tommarelli-modified salt mixture, and National Research Council vitamin mixture. Piperine (0·02 %), capsaicin (0·01 %) and ginger powder (0·05 %) were included in this basal diet to give various experimental diets.
In the first experiment, male Wistar rats (n 8) weighing 80–85 g were maintained on specific semi-synthetic diets containing piperine (0·02 %), capsaicin (0·01 %) and ginger powder (0·05 %) for 8 weeks. Diet consumption and body-weight gain during the experimental regimen in all spice treatments were comparable with controls. After 8 weeks of feeding, the animals were fasted overnight and were administered a single oral dose of β-carotene (5·6 μmol or 3 mg) in 1 ml of refined peanut oil. Rats from each group were killed at time 0 to obtain baseline values. After 4 h per os administration, the animals were killed under light diethyl ether anaesthesia. Blood collected from the heart was allowed to clot, and serum was obtained by centrifugation at 1200 g for 5 min. Small intestine and liver were excised quickly and washed with ice-cold saline, and fresh weights were noted. Serum and tissues were kept frozen at − 20°C.
In the second experiment, groups of male Wistar rats (n 8) weighing 80–85 g were maintained on semi-synthetic diets containing piperine (0·02 %), capsaicin (0·01 %) and ginger powder (0·05 %) for 8 weeks. At the end of the feeding trial, these animals were fasted overnight and killed under light diethyl ether anaesthesia. Liver and small intestine were quickly excised, washed with ice-cold saline and processed for enzyme activity determinations.
Extraction of β-carotene and retinoids
β-Carotene and retinol in serum were extracted under yellow light at 4°C by a slight modification of the procedure given by Barua & Furr(Reference Barua and Furr10). Serum was mixed with ethanol (1 ml), dilute acetic acid (3·3 mol/l, 0·1 ml), ethyl acetate (1 ml) and hexane (1 ml). The mixture was vortexed (30 s) and then centrifuged (1200 g) for 1 min. The supernatant was removed, and the pellet was extracted with hexane (1 ml). The pooled extracts were vortexed with water (0·5 ml) and then centrifuged at 1200 g for 1 min. The organic extract was evaporated to dryness under a stream of N2. The residue was dissolved in the mobile phase and injected into the HPLC column. Retinyl acetate was used as an internal standard, and the recovery of this internal standard was 90–95 %. The efficiency of β-apo-8′-carotenal was similar to that of retinyl acetate under the same conditions.
Liver and intestinal samples were weighed (approximately 1 g) and homogenised in 5 ml of CHCl3 and CH3OH (2:1, v/v) using a Potter–Elvehjem homogeniser. Another 5 ml of CHCl3 and CH3OH were used to rinse the polytron glass homogeniser, and the rinse was combined with the homogenate. After adding 2 ml of 0·9 % saline, the mixture was vortexed for 2 min and then centrifuged at 2500 rpm at 4°C for 10 min. The CHCl3 layer was evaporated to dryness under N2. The residue was redissolved in 5 ml of the mobile phase, and a 20 μl aliquot was injected into the HPLC system.
Determination of β-carotene and retinoids
Determinations of β-carotene and retinol were carried out by reverse-phase HPLC using a Shimadzu system (Model LC 10AVP; Shimadzu Corporation, Kyoto, Japan) equipped with a photodiode array detector. β-Carotene and retinol were separated on a C18 5 μm, 150 × 4·6 mm reverse-phase column (SS Exil, Dandenong, VIC, Australia). The mobile phase consisted of a mixture of 65 % (v/v) acetonitrile, 15 % (v/v) methylene chloride and 20 % (v/v) methanol containing 1·3 mm-ammonium acetate. An isocratic analysis was performed at a flow rate of 1 ml/min. β-Carotene was monitored at a wavelength of 450 nm and retinol at a wavelength of 325 nm with a photodiode array detector. They were quantified from their peak areas using the standard curves of their reference compounds. The peak identities and λmax values were confirmed by their retention time and characteristic spectra of standard chromatograms.
Activity of β-carotene 15,15′-dioxygenase (EC 1.13.11.21) or β,β-carotene 15,15′-mono-oxygenase (EC 1.14.99.36)
The assay procedure was a modification of the method described by van Vliet et al. (Reference van Vliet, van Vlissingen and van Schaik11). The small intestine of rats was flushed with ice-cold PBS containing 16·5 mm-sodium taurocholate to remove mucus and blotted gently with absorbent paper. The duodenum and jejunum portions of the intestines (approximately the first 60 cm) were cut lengthwise; the mucosa was scraped off with a glass slide. The mucosal scraping was homogenised in a Potter–Elvehjem homogeniser using 5 ml of ice-cold potassium phosphate buffer (100·0 m-potassium phosphate, 4·0 mm-MgCl2 and 1·0 mm-dithiothreitol), pH 7·7. The homogenate was centrifuged at 9000 g at 4oC for 30 min, and the supernatant was collected. Liver lobe weighing approximately 1 g was homogenised with nine volumes of 100 mm-potassium phosphate buffer, pH 7·4, with 50 mm-KCl in a glass homogeniser for 2 min to get 10 % (w/v) liver homogenate. Protein was measured by Lowry's procedure(Reference Lowry, Rosebrough and Farr12) using bovine serum albumin as the reference.
β-Carotene 15,15′-dioxygenase enzyme activity was assayed in an incubation mixture (2·0 ml) that consisted of 100·0 mm-potassium phosphate buffer (pH 7·7), 30·0 mm-NAD, 2·0 mm-MgCl2, 5·0 mm-GSH, 1·7 mm-sodium dodecyl sulphate, 6·0 mm-sodium taurocholate, egg phosphatidyl choline (0·2 g/l) and 25 μl α-tocopherol solution in ethanol (0·125 g/l) and 3 μg β-carotene (added as solution in 20 μl acetone). The reaction was initiated by the addition of 3·5 mg of intestinal supernatant protein. The mixture was incubated in a shaking water-bath at 37°C in the dark for 1 h. The reaction was stopped by the addition of 2 ml of ethanol. Parallel controls were run without added β-carotene and also without added enzyme preparation. Under the conditions used, retinal was the only product that we could detect.
At the end of the enzyme reaction, the assay mixture was mixed with an equal volume of ethanol containing 1 % pyrogallol and extracted twice with an equal volume of hexane. After a brief centrifugation, the upper phase was transferred into a vial, dried under N2 and resuspended in the mobile phase. Retinal formed in the reaction was determined by reverse-phase HPLC as described earlier. Unutilised β-carotene was also quantified by monitoring at a wavelength of 450 nm, while the product retinal was monitored at a wavelength of 380 nm. The peak identities and λmax values were confirmed by their retention time and characteristic spectra of standard chromatograms.
Activity of retinal reductase (EC 1.1.1.1)
The assay procedure was a slight modification of the method described by Sundaresan et al. (Reference Sundaresan, Cope and Smith13). Intestinal mucosal scrapings were homogenised for 2 min in a polytron glass homogeniser in 10 ml of 250 mm-sucrose solution containing 25 mm-KCl. The homogenate was centrifuged at 14 000 g for 15 min in a superspeed refrigerated centrifuge (Sorvall RC-5B; Dupont Instruments Corporation, Newtown, CT, USA), and the supernatant fraction was centrifuged at 100 000 g for 60 min in an ultracentrifuge (Beckman L2-65B; Beckman Instruments, Inc., Fullerton, CA, USA) at 4°C. The supernatant was used for the assay of retinal reductase. The assay was performed with 500 nmol of all-trans retinal (Sigma Chemical Company) in 2 ml of potassium phosphate buffer (100 mm-potassium phosphate, 30·0 mg Tween-40, 0·5 mm-NADH and 1·0 mm-GSH (pH 7·2)) in a shaking water-bath at 37°C in the dark for 1 h. The reaction was stopped by adding 5 ml of ethanol. Controls with identical reaction mixtures but with added ethanol at time 0 itself were also included. After the addition of ethanol, samples were extracted twice with an equal volume of hexane. The upper phase was dried under N2 and resuspended in the mobile phase. Retinal reductase activity was expressed as nmol of retinol formed/h per mg of protein. The mobile phase consisting of 100 % methanol and 0·5 % ammonium acetate was pumped at a flow rate of 1 ml/min.
Effect of the spice compounds on the activities of β-carotene 15,15′-dioxygenase and retinal reductase in vitro
A group of five male Wistar rats weighing 150–160 g were maintained on a basal semi-synthetic diet (described earlier) for 1 week for acclimatisation. These animals were fasted overnight and killed under diethyl ether anaesthesia. Liver and small intestine were quickly excised, washed with ice-cold saline and processed for enzyme activity determinations in the presence of the test spice compounds added to the assay mixture. Stock solutions of spice compounds, capsaicin, piperine and zingerone, were prepared in acetone (mg/ml). Suitable aliquots of these stock solutions were included in the assay systems of β-carotene 15,15′-dioxygenase and retinal reductase to give a final concentration of 1 × 10− 6, 1 × 10− 5 and 1 × 10− 4 m. Activities of β-carotene 15,15′-dioxygenase and retinal reductase were determined as outlined previously. All assays were conducted in quadruplicates.
Statistical analysis
Results are expressed as means with their standard errors, and comparisons between groups were made by one-way ANOVA(Reference Dowdy and Weardew14). Comparisons among different groups were made by applying Dunnett's test(Reference Lowry, Rosebrough and Farr12). Differences were considered significant when P < 0·05.
Results
Influence of the dietary spices on intestinal absorption of orally administered β-carotene
In an initial study with control rats, it was observed that β-carotene concentration reached its maximum in circulation about 4 h following its oral administration (Fig. 1). Hence, the animal experiment involving the oral administration of β-carotene was terminated at 4 h following its oral dosage.
Serum β-carotene concentration as a function of time following its oral administration.

The present animal study was conducted to evaluate the influence of dietary spices, piperine, capsaicin and ginger, on the in vivo absorption of orally administered β-carotene and its conversion to vitamin A. Young Wistar rats maintained on specific spice-containing diets for 8 weeks were administered a single oral dose of β-carotene at the end of this feeding trial. After 4 h per os administration, concentrations of β-carotene and retinol in serum, liver and intestine were determined (Figs. 2–4). There was a significant increase in β-carotene concentration in the serum, liver and intestine of piperine- and ginger-fed rats compared with control (Table 1). β-Carotene concentration was 70 and 51 % higher in piperine- and ginger-fed animals, respectively, in the serum as compared with control animals. Similarly, intestinal β-carotene was 69 and 55 % higher in the dietary piperine and ginger treatment, respectively. Hepatic β-carotene was 118 % higher in the dietary piperine group after 4 h per os administration of this provitamin. β-Carotene concentration was also higher in the liver of the capsaicin-fed group (by 44 %) and the ginger-fed group (by 18 %). The results on tissue β-carotene concentrations following its oral administration suggest that dietary piperine and ginger improve the intestinal absorption of β-carotene, leading to an increased β-carotene concentration in circulation and in tissues. The concentration of retinol was not significantly changed in these spice-fed groups compared with the control, suggesting that the bioconversion of β-carotene to vitamin A was not significantly influenced by these dietary spices (Table 1).
HPLC profile of carotenoids and retinoids present in the serum of control rats at 4 h after a single dose administration of β-carotene. (a) β-Carotene (detected at 450 nm) and (b) retinol (detected at 325 nm). Peak no. 1: β-apo-8′-carotenal (internal standard); peak no. 2: β-carotene; peak no. 3: retinal; peak no. 4: retinyl acetate (internal standard).

HPLC profile of carotenoids and retinoids present in the intestine of control rats at 4 h after a single dose administration of β-carotene. (a) β-Carotene (detected at 450 nm) and (b) retinol (detected at 325 nm). Peak no. 1: β-apo-8′-carotenal (internal standard); peak no. 2: β-carotene; peak no. 3: retinal; peak no. 4: retinyl acetate (internal standard).

HPLC profile of carotenoids and retinoids present in the liver of control rats at 4 h after a single dose administration of β-carotene. (a) β-Carotene (detected at 450 nm) and (b) retinol (detected at 325 nm). Peak no. 1: β-apo-8′-carotenal (internal standard); peak no. 2: β-carotene; peak no. 3: retinal; peak no. 4: retinyl acetate (internal standard).

(Mean values with their standard errors, n 6)

a,b,c,d Mean values within a column with unlike superscript letters were significantly different (P < 0·05).
Influence of the dietary spices on the activities of intestinal and hepatic enzymes involved in the bioconversion of β-carotene
Evaluation of the potential of dietary piperine, capsaicin and ginger to influence the absorption of β-carotene and the efficacy of its conversion to vitamin A by measuring the retinol levels was further extended to determine the activities of two enzymes specifically involved in the bioconversion of β-carotene to vitamin A in the intestine and liver (Figs. 5 and 6). The activity of intestinal β-carotene 15,15′-dioxygenase was comparable with the control in the piperine treatment (Fig. 5). On the other hand, enzyme activity was significantly lowered in capsaicin- and ginger-fed animals. The decrease in enzyme activity was 20 and 19 % in capsaicin- and ginger-fed groups, respectively. β-Carotene 15,15′-dioxygenase activity was also lowered in the liver of capsaicin-fed animals, with the decrease being 19 % (Fig. 5). The activity of retinal reductase either in the intestine or liver was not influenced by the test dietary spices (Fig. 6).
β-Carotene 15,15′-dioxygenase activity in the (a) small intestine and (b) liver of spice-fed animals. Values (expressed as pmol retinal formed/h per mg protein) are means, with their standard errors represented by vertical bars (n 6). * Mean value was significantly different from that of the control (P < 0·05).

Retinal reductase activity in the (a) small intestine and (b) liver of spice-fed animals. Values (expressed as nmol retinol formed/h per mg protein) are means, with their standard errors represented by vertical bars (n 6).

Effect of the spice compounds on the activities of rat intestinal and hepatic β-carotene 15,15′-dioxygenase and retinal reductase in vitro
Since the dietary test spices did not enhance retinol concentration in body tissues, in spite of a higher absorption of administered β-carotene, and also did not have a positive influence on the activities of either the hepatic or intestinal β-carotene cleavage enzyme and retinal reductase, it is clear that these spices did not enhance the bioconversion of β-carotene to vitamin A under the experimental conditions. On the other hand, dietary capsaicin even lowered the activities of the cleavage enzyme involved in the bioconversion of β-carotene in the intestine and liver, while dietary ginger lowered the activity of the cleavage enzyme in the intestines. Hence, in the present study, the spice active principles, piperine, capsaicin and zingerone, were also examined for their in vitro influence on the activities of the β-carotene cleavage enzyme 15,15′-dioxygenase as well as retinal reductase involved in the bioconversion of β-carotene. Zingerone (a main constituent of ginger) was used in this in vitro experiment along with piperine and capsaicin since in this in vitro system, it was desirable to avoid insoluble ginger powder, which was employed in the two in vivo studies involving the dietary treatment. Rat intestinal and liver homogenate was used as the enzyme source. Enzyme activities were determined in the presence of the spice compounds in the assay system at three different concentrations: 1 × 10− 6, 1 × 10− 5 and 1 × 10− 4 m.
The in vitro influence of the spice compounds on the activities of intestinal and liver β-carotene 15,15′-dioxygenase is presented in Table 2. Capsaicin significantly decreased the activity of liver β-carotene 15,15′-dioxygenase when included in the assay medium at 1 × 10− 6, 1 × 10− 5 and 1 × 10− 4 m levels, while piperine and zingerone inhibited this activity only at 1 × 10− 4 m level in the assay medium (Table 2). The decrease in hepatic β-carotene 15,15′-dioxygenase activity by capsaicin was roughly proportional to its concentration in the assay medium. Intestinal β-carotene 15,15′-dioxygenase activity was significantly decreased by capsaicin present at 1 × 10− 6, 1 × 10− 5 and 1 × 10− 4 m (Table 2). Similarly, zingerone showed the inhibitory effect at 1 × 10− 5 and 1 × 10− 4 m in the assay medium, while piperine produced this effect only at a concentration of 1 × 10− 4 m in the assay medium. The decrease in intestinal β-carotene 15,15′-dioxygenase activity by capsaicin or zingerone was roughly proportional to their concentration in the assay medium.
(Mean values with their standard errors, n 5)
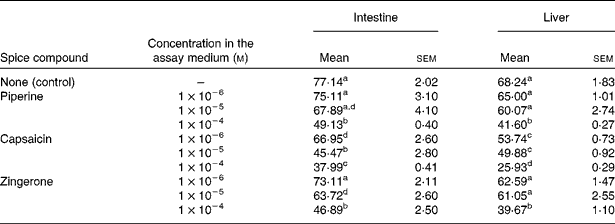
a,b,c,d Mean values within a column with unlike superscript letters were significantly different (P < 0·05).
The in vitro effect of the spice compounds on the activities of intestinal and liver retinal reductase is presented in Table 3. Piperine when present in the assay medium at the 1 × 10− 5 and 1 × 10− 4 m levels significantly increased the activity of hepatic retinal reductase, the increase being as much as 2·5-fold at the latter concentration. A similar increase in the activity of the hepatic enzyme was observed with capsaicin and zingerone only at a concentration of 1 × 10− 4 m in the assay medium. Whereas intestinal retinal reductase activity was significantly increased by all three tested concentrations of piperine, such an effect was observed only at the 1 × 10− 4 m level in the assay medium in the case of either capsaicin or zingerone. The increase in intestinal enzyme activity was more than threefold in the two higher concentrations of piperine.
(Mean values with their standard errors, n 5)

a,b,c,d,e Mean values within a column with unlike superscript letters were significantly different (P < 0·05).
Discussion
The present animal study suggests that the intestinal absorption of β-carotene is higher in animals fed the spice compounds piperine, capsaicin and ginger, as indicated by the concentration of β-carotene in serum, liver and intestinal tissue following the oral intake of β-carotene. On the other hand, these dietary spices had no similar beneficial influence on the bioconversion of absorbed β-carotene to vitamin A, as indicated by the tissue concentrations of retinol as well as the activities of hepatic and intestinal enzymes involved in the cleavage of β-carotene and further reduction during its bioconversion to vitamin A.
We have recently reported that in vitro absorption of β-carotene by the intestines isolated from rats fed black pepper, red pepper, ginger, piperine and capsaicin are higher compared with control(Reference Veda and Srinivasan8). It was inferred that these pungent spices alter permeation characteristics presumably by increasing the absorptive surface and thereby enhance the intestinal absorption of β-carotene. The present in vivo animal study that evidenced a significantly increased absorption of orally administered β-carotene in the spice-fed groups is consistent with the previous ex vivo intestinal uptake study(Reference Veda and Srinivasan8). The present animal study has not only reiterated the bioavailability-enhancing effect of piperine with respect to the micronutrient β-carotene, but has also documented that two other pungent spices, capsaicin, the pungent constituent of red pepper (Capsicum annuum), and ginger (Zingiber officinale), have the potential of significantly enhancing the intestinal absorption of the micronutrient β-carotene.
Piperine, the active principle of black and long pepper, is now established as a bioavailability enhancer of various structurally and therapeutically diverse drugs and other phytochemicals(Reference Srinivasan7, Reference Zutshi, Singh and Zutshi15–Reference Bano, Raina and Zutshi17). Piperine increases the serum response of β-carotene by non-specific mechanisms that operate directly on the gastrointestinal tract and the liver. This mechanism may involve increased micelle formation(Reference Annamalai and Manavalan18), modification of the epithelial cell wall due to the lipophilic nature of piperine(Reference Johri, Thusu and Khajuria19) or an increase in the bioenergetic processes of the gastrointestinal epithelium due to the thermogenic properties of piperine(Reference Reanmongkol, Janthasoot and Wattanatorn20).
The effectiveness of an extract of black pepper consisting of 98 % piperine for its ability to improve the serum response of β-carotene during oral supplementation has been studied in human subjects, where the subjects ingested 15 mg β-carotene daily either with 5 mg of piperine or with placebo during each of two 14 d supplementation periods(Reference Badmaev, Majeed and Norkus21). Significantly greater increases in serum β-carotene during supplementation with β-carotene plus piperine compared with β-carotene plus placebo were inferred. It has been suggested that serum response during oral β-carotene supplementation is improved through the non-specific thermogenic property of piperine, which is an active thermonutrient. It has been suggested that piperine may form an apolar complex with drugs and may modulate membrane dynamics due to its easy partitioning, thus helping in efficient permeability across the barriers(Reference Khajuria, Zutshi and Bedi22). It has also been suggested that piperine may induce alterations in membrane dynamics and permeation characteristics along with induction of the synthesis of proteins associated with cytoskeletal function, resulting in an increased small-intestinal absorptive surface, thus assisting efficient permeation through the epithelial barrier(Reference Khajuria, Thusu and Zutshi23).
Piperine has been reported to stimulate the activities of intestinal leucine aminopeptidase and glycine–glycine dipeptidase located on the external surface of the brush-border membrane, and whose activity is dependent on the interaction with the lipid microenvironment of the membrane(Reference Ugolev, Mityushova and Egorova24, Reference McDonald, Barrette, McDonald and Barrette25). It has been suggested that piperine modulates the membrane dynamics due to its apolar nature by interacting with the surrounding lipids and hydrophobic portions in the protein vicinity, which may decrease the tendency of membrane lipid to act as stearic constrains to enzyme proteins and thus modify enzyme conformation. Ultrastructural studies with piperine have shown an increase in microvilli length with a prominent increase in free ribosomes and ribosomes on the endoplasmic reticulum in enterocytes, suggesting that the synthesis or turnover of cytoskeletal components or membrane proteins may be involved in the observed effect. In a recent study, dietary black pepper/piperine, red pepper/capsaicin and ginger were evidenced to induce alteration in membrane dynamics and permeation characteristics, associated with an induction in the increased microvilli length, resulting in an increased absorptive surface of the small intestine(Reference Prakash and Srinivasan26).
The dietary doses of piperine (0·02 %), capsaicin (0·01 %) and ginger powder (0·05 %) in the diets used in the present animal study correspond to the levels reported earlier by us to beneficially alter small-intestinal ultrastructure and permeability(Reference Prakash and Srinivasan26). The present animal study has evidenced that dietary pungent spices, piperine of black pepper, capsaicin of red pepper and ginger, can effectively enhance the absorption of β-carotene. Although the dosages of these employed in the present study are much higher than the usually encountered levels of the spices black pepper, red pepper and ginger in our diet, such higher doses have been proved to be safe. Red pepper/capsaicin and black pepper/piperine have been found to have no adverse effects on growth, organ weights, feed efficiency ratio, N balance and blood chemistry in animal models(Reference Srinivasan, Sambaiah and Satyanarayana27–Reference Bhat and Chandrasekhara29). The dose of piperine required to enhance the absorption of nutrients is considered to be 4–150 μg of piperine/kg body weight. This concentration is much lower than the 50 % lethal dose of piperine in mice and rats.
Bile salts have a prominent role in carotenoid absorption through the solubilisation of dietary carotenoids and facilitating their transport in the form of micelles from the intestinal lumen to the brush border. β-Carotene has been reported to be well absorbed into rat everted gut from micellar solutions made with bile salt mixtures(Reference El-Gorab, Underwood and Loerch30), and β-carotene dispersed in a micellar solution was absorbed into slices of intestinal tissues and converted to retinyl ester only when bile or conjugated bile salts were present(Reference Olson31). These studies have suggested that bile salts not only serve to solubilise carotenoids in the small intestine, but may also be required for their transport through the brush-border membrane. Incidentally, dietary capsaicin/red pepper and ginger are known to cause higher secretion of bile with significantly enhanced titres of bile salts(Reference Bhat, Srinivasan and Chandrasekhara32, Reference Bhat, Sambaiah and Chandrasekhara33). Thus, the capacity of these dietary spices to enhance the secretion of bile salts, which participate in the absorption of lipophilic compounds including β-carotene, could also be responsible for the observed higher absorption of orally administered β-carotene in the present animal study.
Provitamin A carotenoids are converted to retinal by β-carotene-15,15′-dioxygenase, which is expressed predominantly in the intestinal epithelium and liver. The intestinal enzyme also determines whether provitamin A carotenoids are converted to vitamin A or circulated in the body as intact carotenoids. The significantly lowered activity of the β-carotene cleavage enzyme in the intestines and liver in capsaicin- and ginger-fed animals in the present study was also corroborated by the inhibitory effects of the spice compounds on this enzyme in vitro. Although this appears to be a point for concern with regard to the bioconversion of β-carotene to vitamin A, it is to be noted that the observed in vivo effect is only in the vitamin A adequate status, and in spite of a decrease in the activity of the β-carotene cleavage enzyme, retinol status in the tissues was comparable with the controls. Secondly, the concentrations of the spice compounds that inhibited the β-carotene cleavage enzyme in vitro would generally never be encountered in the tissues when the animals fed spices through the diet. In rats administered a single high oral dose of capsaicin or piperine(Reference Suresh and Srinivasan34), the tissue levels of the administered spice compounds were far below the concentrations that produced a reduction in enzyme activity in the present study.
Nagao et al. (Reference Nagao, Maeda and Lim35) reported that flavonols having a catechol structure in the B-ring and 2,6-di-tert-butyl-4-methylphenol inhibited the activity of β-carotene dioxygenase of pig intestinal homogenate in vitro. Flavonols with a catechol structure in the B-ring also inhibited the conversion of β-carotene to retinol in Caco-2 human intestinal cells(Reference Nagao, Maeda and Lim35). Lycopene, lutein and astaxanthin have been shown to competitively inhibit carotenoid dioxygenase activity(Reference Erchov, Bykhovsky and Dmitrovskii36). Thus, the conversion of β-carotene to vitamin A can be modulated by various dietary components that inhibit carotenoid dioxygenase activity. Regulation of the dioxygenase activity and its relation to the retinoid metabolism as well as to lipid metabolism deserve further study in the context of understanding the beneficial effects of carotenoids on human health.
Results of the present in vitro study corroborate with the in vivo observation of the influence of dietary spices/or their bioactives on the bioconversion of β-carotene to vitamin A. The in vitro influence of the tested spices on the activities of β-carotene 15,15′-dioxygenase involved in the bioconversion of β-carotene to vitamin A was in fact negative. The lack of a positive influence of the test spices on the bioconversion of β-carotene to vitamin A could be attributed to the fact that these animals were in a nutritionally well-fed state, and that vitamin A status was adequate. Blood level of vitamin A is a poor indicator of vitamin A status, even in the case of deficiency, as maintenance of optimal plasma retinol concentration is very tightly regulated. Furthermore, it is extremely unlikely to observe any difference in tissue retinol status after a single dose of β-carotene in vitamin A-sufficient animals. As such, the higher β-carotene absorption did not result in a parallel increase in its bioconversion. The possibility of an associated enhanced bioconversion of the absorbed β-carotene into vitamin A in vitamin A-deficient states cannot be ruled out. Even in the absence of any positive influence of the dietary piperine, capsaicin and ginger, the appreciable increase in the intestinal absorption of orally administered β-carotene is desirable, since apart from its role as a provitamin, β-carotene acts as a very good antioxidant, and hence a higher absorption of the same contributes to an improved antioxidant status. Carotenoids have been linked with protective roles against diseases including cancer, CVD, cataract and age-related macular degeneration(Reference Young and Lowe2).
Although the activity of retinal reductase was increased in vitro by the three spices in the present study, the same were comparable with control animals in the in vivo situation. Higher activity of this enzyme was not discerned in spice-fed animals probably because such higher levels of the spice compounds in the tissues (10− 6–10− 4 m), which would have brought about the enhancing effect, are not encountered. Furthermore, since the β-carotene cleavage enzyme, which is the rate-limiting enzyme in the bioconversion of β-carotene rather than retinal reductase, was not similarly influenced, the positive influence on the latter enzyme alone was of no consequence. Retinol is a product of metabolic conversion of β-carotene, and its blood levels would be affected by the inhibition/stimulation of the concerned enzyme. The doses of the three test spices that enhanced the bioavailability of β-carotene in the present study do not affect the metabolic conversion of this nutrient in the body, as measured by the blood levels of retinol. In the context of the toxic effects of an overdose of vitamin A, the observation that piperine does not enhance the conversion of β-carotene to retinol under conditions of adequate vitamin A status is noteworthy. The benefit of increased blood levels of β-carotene without the risk of vitamin A toxicity translates into the safe and effective enhancement of antioxidant protection provided by β-carotene.
Acknowledgements
S. V. is thankful to the University Grants Commission, New Delhi for the award of Senior Research Fellowship. The authors declare that they have no conflicts of interest. S. V. is responsible for the bench work. K. S. supervised the whole animal experiment and analytical investigation. K. S. is also the project leader, who handled research planning, data interpretation and writing of the manuscript.



