


Breakfast is an important part of a healthful diet, because it facilitates energy balance over the day and typically supplies major nutrients( Reference Rampersaud, Pereira and Girard 1 ). Consuming breakfast (compared with skipping breakfast) has been associated with weight gain prevention( Reference Timlin, Pereira and Story 2 ) and positive health status in general( Reference Rampersaud, Pereira and Girard 1 ). Young people, especially teenagers, are at high risk of skipping breakfast( Reference Alexy, Wicher and Kersting 3 – Reference Deshmukh-Taskar, Nicklas and O'Neil 5 ), with one out of five 9–13-year-olds and a third of 14–17-year-olds regularly skipping breakfast in the USA in 1999–2006( Reference Deshmukh-Taskar, Nicklas and O'Neil 5 ).
Ready-to-eat (RTE) cereals are one common choice for breakfast. RTE cereal consumption increased through the mid-1990s in the USA( Reference Siega-Riz, Popkin and Carson 4 ); a third of children (9–13 years of age) and a quarter of adolescents (14–18 years) ate RTE cereals for breakfast in the first half of the 2000s( Reference Deshmukh-Taskar, Nicklas and O'Neil 5 ). RTE cereals provide carbohydrates including fibre and micronutrients (due to enrichment widely practised since the 1970s), but low fat content( Reference Rampersaud, Pereira and Girard 1 ). They have therefore been recommended as components of a healthful breakfast, together with dairy products (milk is usually consumed with RTE cereals) and fruit (fresh or juice)( 6 ). The research documenting the health benefits of RTE cereals typically compares this choice with skipping breakfast altogether( Reference Albertson, Affenito and Bauserman 7 ) or with high-fat breakfast options such as those including fried eggs, cheese, bacon or sausage( Reference Cho, Dietrich and Brown 8 ). As shown in a controlled study( Reference Rosado, del and Montemayor 9 ), the benefit of RTE cereal consumption was sizeable only when accompanied by nutritional education, suggesting that the positive impact is probably due more to other healthy behaviours associated with such food choices than to the nutritional quality of the products consumed.
One feature of RTE cereals is their wide variation in nutritional composition across brands; specifically, some products contain sizeable amounts of added sugars and salt( Reference Harris, Schwartz and Brownell 10 ). Child-targeted RTE cereals are of special concern( Reference Schwartz, Vartanian and Wharton 11 ) because they are more energy-dense and contain higher amounts of sugars compared with their adult-targeted counterparts. Previous studies have found that RTE cereals of low nutritional quality continue to be advertised extensively to children( Reference Harris, Schwartz and Brownell 10 ) despite cereal companies’ pledges to reduce marketing of unhealthy products to children( Reference Schwartz, Ross and Harris 12 ). Importantly, during the 2003–2007 period, exposure to RTE cereal advertising decreased among 2–5-year-old children (−23 %), but remained relatively constant among older children (−3 %) and adolescents (−0·8 %)( Reference Powell, Szczypka and Chaloupka 13 ). Different advertising exposure trends were also observed by cereal manufacturer. For example, both General Mills and Kellogg participate in the children's food marketing pledges, but older children's exposure to General Mills advertising went down by 10 % during that period whereas exposure to Kellogg advertising went up by 7 %. Similarly, exposure to advertising by younger children went down by 30 % for General Mills products, but by just 11 % for Kellogg products. Manufacturers also committed to reduce the sugar and Na contents of cereals marketed to children( Reference Harris, Schwartz and Brownell 10 ). However, as of early 2009, the average nutritional quality of children's cereals improved by only 2–5 % v. formulations in 2007( Reference Harris, Schwartz and Brownell 10 ). In addition, how these small improvements influence RTE cereal purchases and intake, especially in children and adolescents, remains to be understood( 14 ). Recent observations on RTE cereals intake are also needed.
Studying RTE cereal purchases can contribute to our understanding of the relationship between nutritional quality, marketing and product intake( Reference Larson, Story and Nelson 15 ). Databases of individual dietary intake assessments (such as 24 h recalls) contain little or no information about brands of manufactured products consumed, and generic foods do not take into account variations in nutritional content from one brand to another. Therefore, such surveys do not enable analyses of specific nutrient variations based on the exact products eaten( Reference Slimani, Deharveng and Unwin 16 ). Despite their limitations( Reference Einav, Leibtag and Nevo 17 ), databases designed to provide economic information can be used to conduct detailed analyses of purchase behaviours by finely classifying each RTE cereal product according to its specific nutritional content and comparing product purchases with advertising exposure. Knowing how RTE cereal purchases vary according to their nutritional content and advertising exposure could lead to public health actions aimed at improving the quality of products actually chosen by the population. In addition, it is hypothesized that purchases vary across sociodemographic categories of the population in relation to the nutritional content and/or the advertising volume and that different population categories may be prone to ‘respond’ differently to these factors. Improving access to good-quality RTE cereals for subgroups of the population so identified would also further public health action.
The objective of the present study was to describe purchases of RTE cereal products in the US population overall and across sociodemographic categories according to (i) cereal nutritional content and (ii) product advertising, including target market (child, family and adult) and whether the product was advertised on television.
Methods
The Nielsen Homescan data (now ‘National Consumer Panel’)
Panel recruitment and data collection
Nielsen recruits panel members, 18 years and older, living in all US states and interested in participating in the collection of data on their product purchases through its dedicated website complementary to a random recruitment. Participants are further selected on the basis of sociodemographic characteristics they provide. Each time they shop, they register the date, store name and location of their purchases. They use a hand-held scanner to register the barcode of all goods purchased along with the quantity and whether the purchase was made with a promotion or manufacturer's coupons (specifying its amount). They send the data once weekly through the dedicated and secured website.
Based on the barcodes, Nielsen identifies the detailed product and brand information, as well as weekly average price when purchases are made at stores registered in the store-level data (‘Scan Track’). Otherwise, volunteers manually enter the price paid using a hand-held scanner. Nielsen verifies this information according to the median of prices in the area and corrects outlier entries (i.e. those outside 99 % thresholds of acceptable actual prices). It typically uses the median price that is most appropriate for the store where the purchase has been made. The data set used in the present analysis included RTE cereal purchases made in 2008 by households in the Homescan panel that provided any purchase registration for at least 10 months during the year and purchased any RTE cereal (n 57 171).
Nielsen purchase indicators
Calibration based on the national census for household size, household income, female head age, race, Hispanic origin, male and female head education, head of house occupation, presence of children and Nielsen county size is carried out to provide national estimations for sociodemographic characteristics and product purchases. Based on the sociodemographic characteristics of Homescan panel households, Nielsen provides estimates for a nationally representative sample of households and by sociodemographic category. The data set includes the following measures for each RTE cereal in their database: ‘Total spending’, the total dollars spent during the year by the entire estimated population group; ‘Item buyers’, the estimated total number of households who bought the product during the year; ‘Buying rates’, the mean annual spending per household on the cereal (in dollars); ‘Purchase frequency’, the mean number of times the product was bought during the year per household; ‘Purchase size’, the average amount spent per purchase (in dollars); ‘Purchase cycle’, the average number of days between two purchases; ‘Loyalty’, the average share of spending for a given RTE cereal as a percentage of all spending for RTE cereals during the year by households; ‘Dollars purchased on deal’, the share of total spending when the product was on promotion at the store (in %); and ‘Dollars with manufacturer coupon’, the share of total spending using coupons supplied by manufacturers (in %).
Nielsen also computes an aggregated ‘volume index’ by sociodemographic category. The volume index describes the extent to which the share of purchases of a given RTE cereal, by households in a specific sociodemographic category, compare with those that would be expected given that category's share of the total population. The volume index is calculated by dividing the percentage of RTE cereal spending in the sociodemographic group by the percentage of the group in the national population according to the US Census. A volume index greater than 100 indicates that the group purchases a higher-than-average amount of a given cereal; whereas an index below 100 indicates that it purchases a lower-than-average amount.
Nutrient content database and nutrient profiling index model score computation
The detailed list of RTE cereals in the Homescan data set included products purchased by a minimum of seventy-five households during 2008, other products being grouped into a summarizing category. This RTE cereal list was then merged with a database of RTE cereals, including nutrient content and advertising, developed for a comprehensive analysis of the RTE cereal industry in 2008( Reference Harris, Schwartz and Brownell 10 ). When the nutrient content was missing for a given RTE cereal, it was completed by using manufacturer websites and checking the nutrition facts on packaging in the supermarket. This step was required for very few cereals (<5 %), therefore it is unlikely to have biased the final estimations. The nutrient data set included serving size supplied by manufacturers and the content of energy (kcal/serving), saturated fat (g/serving), sugar (g/serving), fibre (g/serving) and Na (mg/serving). The nutrient content database contained 573 registered RTE cereals.
The Nutrient Profile Index (NPI) score( 18 ) was calculated for each product. The NPI is based on a model developed for the Food Standards Agency (FSA) in the UK and validated to reflect food quality assessments by nutritionists( Reference Arambepola, Scarborough and Rayner 19 , Reference Scarborough, Arambepola and Kaur 20 ). The model takes into account both ‘positive’ (i.e. to encourage) and ‘negative’ (i.e. to limit) nutrients together. Thus it provides a more nuanced evaluation of foods’ nutritional quality based on their entire nutrient composition. The original model was launched to identify products that are healthy and can be advertised to children on television in the UK; other applications, with modified calculations, are currently being evaluated for labelling products, for instance in Australia and New Zealand (http://www.foodstandards.gov.au/). Briefly, the model provides one score for individual products based on points for components that should be limited in the diet (energy, saturated fat, simple sugars and Na; ‘A’ points) relative to points for components considered favourable for a healthy diet (fruits, vegetables and nuts, NSP fibre or AOAC (Association of Official Analytical Chemists) fibre and protein; ‘C’ points). Points are assigned based on nutrients in 100 g of the product. The overall score is then calculated by subtracting the C points (from 0 to 15 points maximum) from the A points (from 0 to 35 points maximum)( 18 ). In the original model, a solid food is considered as ‘less healthy’ if it scores 4 or more points. The initial model is difficult to interpret as higher scores indicate lower nutritional quality, and the range of scores falls between −15 and 35. Therefore, we modified the original model calculation as follows( Reference Harris, Schwartz and Brownell 10 ).
-
• The score was transformed as ‘(−2 × NP score) + 70’. The new NP index (NPI) therefore falls between 0 [(−2 × 35 points) + 70] and 100 [(−2 × −15 points) + 70], with a higher NPI indicating better nutritional content. An initial NP score lower than 4 points is considered by FSA as a threshold for identifying ‘healthful products’. The corresponding threshold for the NPI is therefore higher than 62 points.
-
• Since no information about AOAC and NSP fibre was available separately, only the calculation for AOAC fibre was used( 18 ).
Targeted advertising exposure
The present study categorized RTE cereals using the same method as the previous analysis that also examined advertising and packaging for 277 RTE cereals and classified them as ‘child-targeted’, ‘family-targeted’ or ‘adult-targeted’( Reference Harris, Schwartz and Brownell 10 ). Cereals were classified as child-targeted if they advertised directly to children in 2008. Cereals were classified as family-targeted if their packaging or marketing copy indicated that they were appropriate to feed children and/or families, but the researchers found no evidence of marketing directed to children. All other cereals were classified as adult-targeted. Products not advertised on television at all in 2008 were categorized separately as ‘no advertising’ in our analyses.
Statistical analyses
Based on the NPI describing the nutrient content of RTE cereals, four categories of nutrient quality were created: (i) very poor (<40 points); (ii) poor (40–49 points); (iii) fair (50–62 points); and (iv) good (>62 points). Given that individual data at the household level were not available for the Homescan panel, distributions (median and 25th–75th percentiles) are used to describe purchase indicators (number of buyers, purchase frequency, etc.) and volume indices across the NPI advertising target categories. Medians were preferred due to small sample sizes in some subgroups. For volume indices, box-and-whisker plots are also used to illustrate distributions across target-advertising categories for some sociodemographic groups. Nielsen recommends that a volume index less than 80 indicates ‘under-purchasing’ of the product by a given sociodemographic group, and that a volume index higher than 120 indicates that the RTE cereal is purchased in amounts sizeably higher than expected given the share of the group in the overall population. Indeed, Nielsen considers a difference of 20 % as meaningful given the standard errors usually observed for panel volume estimates. Sociodemographic characteristics analysed here were presence of any child at home (and if yes, the age category of the child), household size, race/ethnicity, female head-of-household education, income and geographic region. Statistical comparisons across categories were carried out using ANOVA and trend tests when appropriate. Statistical analyses were conducted using the STATA statistical software package version 10·0 (2007; Stata Corporation, College Station, TX, USA).
Results
The Homescan data set included purchases of 290 different RTE cereals. Of these cereals, five consisted of ‘Ralston Food products’ (comprised of thirty-five various store brands) and one observation summarized private label product (‘CTL-BR’) purchases for which nutrition data were not available; in 2008, these two categories represented 10·4 % of total purchases in dollars. In addition, thirteen items consisted of RTE cereal in mixed cereal packs (1·1 % of the total purchases), nutritional content was not available for an additional eighteen cereals (mostly because they had been discontinued; 0·9 % of the total purchases) and four items were excluded because they were not RTE cereals (cereal straws or wheat germ; 0·5 % of the total purchases in 2008). The 249 RTE cereals included in the final analysis represented 87·1 % of total purchases in US dollars in 2008.
Ready-to-eat cereal purchases across household sociodemographic categories
Based on medians (25th–75th percentiles) of volume index (‘All’ column, Table 1), purchases of RTE cereals were lower than average (volume index median <80) in households with one member, African-American and Asian households, and households earning <$US 30 000 per annum. Purchases were also low (volume index median <90) in households in which the female head of household was not a high-school graduate and those without children in the home. In contrast, RTE cereal purchases were higher than average (volume index median >120) in households with five or more members and those with at least one child of any age. In addition, median volume indices increased regularly with the number of household members, female head-of-household education and income (Table 1).
Ready-to-eat (RTE) cereal volume indexFootnote † (median and 25th–75th percentiles) according to nutritional quality (NPI category)Footnote ‡, Homescan data, Nielsen, 2008Footnote §

NPI, Nutrient Profiling Index.
† Volume index = ratio of RTE cereal spending in the sociodemographic group divided by percentage of the sociodemographic group in the US population.
‡ For definition of NPI, see the Methods section and Rayner et al.( 18 ).
§ Comparison tests across NPI categories: *P < 0·05, **P < 0·01, ***P < 0·001.
∣ ∣Census definition.
Purchase indicators according to ready-to-eat cereals’ nutrient quality
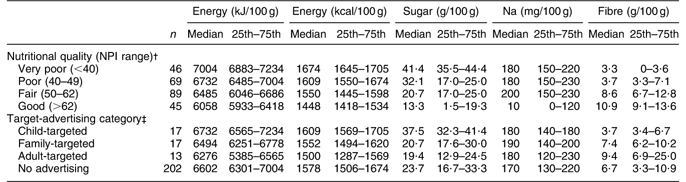
RTE cereals were distributed across NPI categories as follows: very poor (<40), n 46 (18·5 %); poor (40–49), n 69 (27·8 %); fair (50–62), n 89 (35·7 %); and good (>62), n 45 (18·1 %). Most RTE cereals contain little or no saturated fat, protein or vegetables/fruits/nuts per 100 g; the variation between cereal NPI scores is mostly due to differences in sugar, fibre and Na content. Indeed, the higher the NPI range, the lower the sugar content and the higher the fibre content (Table 2). Variations in Na are not sizeable in the lowest three NPI categories, but the Na median is much lower in the ‘good’ quality products. In addition, slightly higher energy content was observed as the NPI score decreased.
Energy and nutrient contents (median and 25th–75th percentiles) of ready-to-eat (RTE) cereals according to nutritional quality (NPI category)Footnote † and target-advertising categoryFootnote ‡, Homescan data, Nielsen, 2008
NPI, Nutrient Profiling Index.
† For definition of NPI, see the Methods section and Rayner et al.( 18 ).
‡ For definition of target-advertising categories, see the Methods section.
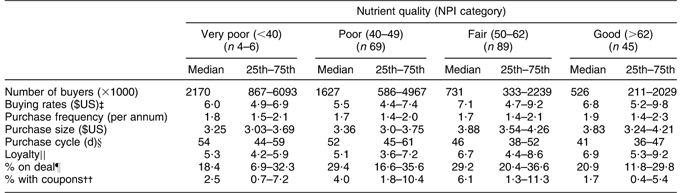
Purchase indicators varied significantly across nutrient content categories, with the exception of purchase frequency (P = 0·10; Table 3). With improvement in NPI, the number of buyers decreased (P = 0·01) but loyalty increased dramatically (P < 0·001). Buying rates per annum and purchase size (P = 0·002) increased with nutritional quality; whereas the purchase cycle (i.e. time between two purchases) decreased (P < 0·001). Finally, share of purchases using coupons or promotions was lowest in the extreme nutrient profile categories (NPI < 40 and NPI > 62) and highest in the two intermediate categories (Table 3).
Ready-to-eat (RTE) cereal purchase indicators (median and 25th–75th percentiles) according to nutritional quality (NPI category)Footnote †, Homescan data, Nielsen, 2008
NPI, Nutrient Profiling Index.
† For definition of NPI, see the Methods section and Rayner et al.( 18 ).
‡ Mean annual spending per household on the cereal (in $US).
§ Average number of days between two purchases.
∣∣ Average share of spending for a given RTE cereal as a percentage of all spending for RTE cereals during the year by households.
¶ Share of total spending when the product was on promotion at the store.
†† Share of total spending using coupons supplied by manufacturers.
In each household sociodemographic group, volume index varied across nutrient content categories (Table 1). The RTE cereal volume index decreased when nutritional quality increased in households with at least one child, while the opposite occurred in households without children. A similar pattern was also observed for household size (volume index increased in households with one or two members and decreased in households with three or more members) and according to female head-of-household education level (volume index decreased with nutritional quality in the first three education categories, but increased for households with a college graduate female head of household). Moreover, variations across nutritional content categories differed according to race/ethnicity: the volume index increased with nutritional quality in Caucasian households, but decreased in Hispanic and African-American households. Asian households showed a different pattern with an increasing volume index up to the fair (50–62) NPI category and then a decrease. RTE cereal volume indices also increased significantly with nutritional quality in the highest household income category (≥$US 100 000 per annum) and in the East and West regions. By contrast, volume indices decreased significantly with NPI category in households earning $US 30 000–39 999 and $US 50 000–59 999 per annum, as well as in the South and Central regions.
Purchase indicators according to whether the product was advertised on television and by target audience
Of the RTE cereals in the final analysis, forty-seven were advertised on television in 2008. All child-targeted RTE cereals with television advertising (n 17) had an NPI score in the very poor to poor range (<50). By contrast, eleven of thirteen adult-targeted advertised cereals and twelve of seventeen family-targeted cereals exhibited an NPI score >50 (four and two cereals, respectively, scored >62). RTE cereals that were not advertised on television in 2008 (n 202) had the following distribution by NPI score: 17·4 % were very poor (<40), 27·7 % were poor (40–49), 35·6 % were fair (50–62) and 19·3 % were good (>62). Nutrient content variations were observed by advertising category (Table 2). Whereas the nutrient content of no-advertised products fell between the three other categories, the highest energy and sugar contents were observed in child-targeted RTE cereals and the lowest in the adult-targeted products. The Na content was comparable across advertising categories.
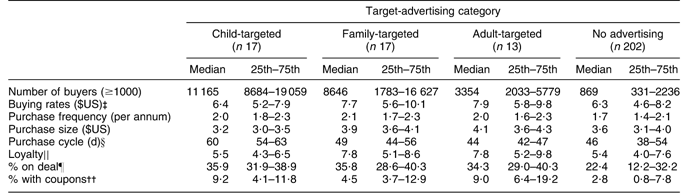
Purchase indicators varied greatly by advertising target (Table 4). Compared with cereals not advertised in 2008, the median number of buyers for advertised child-targeted RTE cereals was more than thirteen times higher, buyers for advertised family-targeted products were ten times higher and those for advertised adult-targeted cereals were nearly four times higher. Purchase frequency and dollar share using promotions or coupons were also higher across the board for advertised compared with not-advertised RTE cereals. Additionally, advertised child-targeted RTE cereals exhibited unique purchase behaviours: their median purchase size was the lowest and median purchase cycle was the highest of the advertised categories. Finally, median loyalty for RTE advertised cereals targeted to children was comparable to that of not-advertised cereals, while advertised family- and adult-targeted RTE cereals showed the highest loyalty.
Ready-to-eat cereal (RTE) purchase indicators (median and 25th–75th percentiles) according to target-advertising categoryFootnote †, Homescan data, Nielsen, 2008
† For definition of target-advertising categories, see the Methods section.
‡ Mean annual spending per household on the cereal (in $US).
§ Average number of days between two purchases.
∣∣ Average share of spending for a given RTE cereal as a percentage of all spending for RTE cereals during the year by households.
¶ Share of total spending when the product was on promotion at the store.
†† Share of total spending using coupons supplied by manufacturers.
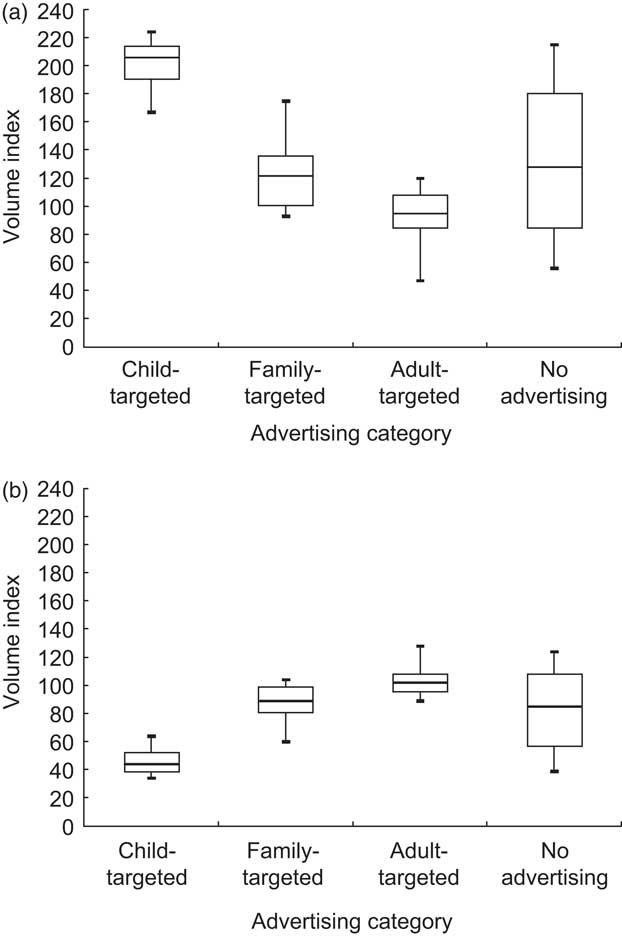
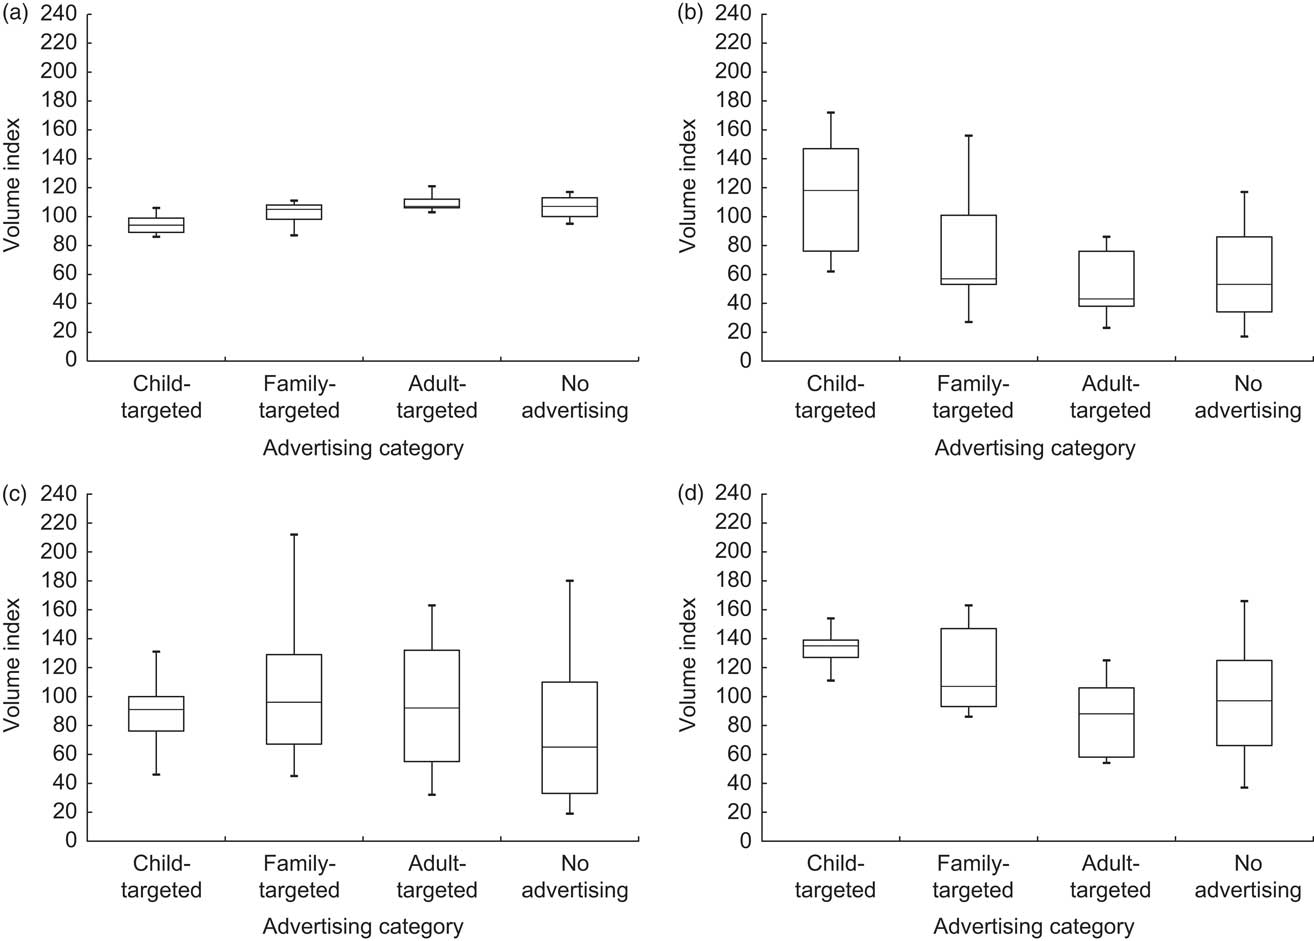
In several population subgroups, RTE cereal volume indices also varied according to whether products were advertised or not and across target-advertising categories. As would be expected, in households with at least one child (Fig. 1a), volume indices were higher for child-targeted advertised RTE cereals than for advertised cereals targeted to families and adults (P < 0·001). In contrast, households without children purchased family- and adult-targeted advertised RTE cereals more often (Fig. 1b). Variations according to the number of household members followed the same patterns (data not shown). Additionally, Caucasian households (Fig. 2a) were less likely to purchase child-targeted RTE cereals compared with family- and adult-targeted RTE cereals (P < 0·001), while African-American households exhibited the opposite pattern (P < 0·001; Fig. 2b). Finally, in households in which the female head of household had some college (P = 0·047), the volume index (median (25th–75th percentile)) was higher for advertised child-targeted RTE cereals (123 (116–128)) than for family-targeted (104 (96–117)), adult-targeted (90 (82–101)) and not-advertised RTE cereals (106 (84–124)). For households in the remaining sociodemographic categories, the volume index of RTE cereals did not vary significantly according to whether the product was advertised or the advertising target.
Ready-to-eat (RTE) cereal volume index according to target-advertising category in: (a) households including at least one child; and (b) households without children (Homescan data, Nielsen, 2008). Volume index = ratio of RTE cereal spending in the sociodemographic group divided by percentage of the sociodemographic group in the US population; for definition of target-advertising categories, see the Methods section
Ready-to-eat (RTE) cereal volume index according to target-advertising category in various race/ethnic groups: (a) Caucasian; (b) African American; (c) Asian; and (d) Hispanic (Homescan data, Nielsen, 2008). Volume index = ratio of RTE cereal spending in the sociodemographic group divided by percentage of the sociodemographic group in the US population; for definition of target-advertising categories, see the Methods section
Discussion
Analyses of various aggregated indicators of RTE cereal purchases highlight interesting variations across sociodemographic categories in US households. RTE cereal purchases varied according to nutritional value, television advertising and target market. Nevertheless, the extent of such variations was not the same across household categories. Overall, these results illustrate the need for improvement in the nutritional content of RTE cereals advertised on television and targeted to children.
To our knowledge, such a detailed description of RTE cereal-buying patterns across sociodemographic categories has not been previously published. One study conducted in 1996 in Canada( Reference Ricciuto, Tarasuk and Yatchew 21 ) showed that, overall, RTE cereals were bought by fewer than half of households, and purchased more often with increasing education and income and with the presence of youth aged <15 years at the dwelling. Our observations based on purchase volume index are similar to previous studies of US individual intake data. For adults( Reference Siega-Riz, Popkin and Carson 22 ) and children( Reference Deshmukh-Taskar, Nicklas and O'Neil 5 ), consumption of RTE cereals was lower in African-American, Hispanic and low socio-economic status households (based on education for adults and poverty-to-income ratio for children in these studies) compared with non-Hispanic white and high socio-economic status households. Lower purchases of RTE cereals could be markers of low breakfast intake in these subgroups of the population as RTE cereals are commonly consumed at breakfast. Given the consequences of skipping breakfast on health( Reference Rampersaud, Pereira and Girard 1 ), this can be considered a public health issue for which surveillance of individual diet behaviours is necessary.
In the present study of 2008 purchases, US households with at least one child bought relatively more RTE cereals, which would be expected as many RTE cereals are marketed as ‘kid products’. Nevertheless, households with at least one child exhibited particularly elevated purchases of RTE cereals of poor nutritional quality. This can be related to the fact that while product advertising was closely associated with buying patterns (purchases of child-targeted advertised products were thirteen times higher than not-advertised products), child-targeted products were also those with the poorest nutritional content (i.e. in 2008 all child-targeted advertised products had an NPI < 50). Our observations together with previous analyses( Reference Story and French 23 ) underline the potential impact of television advertising on food-buying behaviours, especially for advertising directed at children. Nevertheless, indicators analysed here such as purchase frequency, time between purchases and resulting loyalty suggest that buying behaviours for healthier products could increase with increased advertising (adult-targeted products were bought four times as often as products not advertised in 2008) and potentially the use of promotions and coupons( Reference Hawkes 24 ).
Sociodemographic characteristics were also associated with RTE cereal-buying patterns, in particular household race/ethnicity and education of the female head of household. RTE cereal purchases made by white households were rather homogeneous for all products (based on volume index medians and 25th–75th percentiles). African-American and Hispanic households under-purchased RTE cereals overall, but they purchased more of the cereals with poorest nutritional quality, especially the child-targeted advertised RTE cereals. Similar buying patterns were found with lower female head-of-household education, lower income and southern region, and indicates that sociodemographic groups for whom RTE cereal consumption is not the norm in adults( Reference Siega-Riz, Popkin and Carson 22 ) may be more susceptible to advertising directed towards their children and adolescents. Again, these observations support the need to promote healthier RTE cereals among population subgroups in which advertising seems to have a direct impact.
The present study has some limitations. First, we chose to use a standardized nutrition score so that we could classify products within the RTE cereal group according to their nutritional quality. This does not tell us how consuming these cereals influenced the entire diet over a day( 18 ). Second, the requirements for participating in the Homescan panel might produce biased estimations despite the calibration of data on the census( Reference Einav, Leibtag and Nevo 17 ). Households must regularly register and transmit information about their grocery store purchases which can be a time-consuming process. Therefore, retired individuals may be over-represented among one-member households relative to young single adults. This potential self-selection bias could explain why one-member households purchased more RTE cereals of good nutritional quality. Further research could examine the buying behaviours of young single adults to evaluate whether they continue to purchase the less-healthy cereals consumed when they were younger and living with their parents. Third, these aggregated data do not provide information about individual household purchasing patterns nor individual intake within households, especially by gender and age. We assume that a product targeted to children purchased by households with children is predominantly eaten by children; however, parents may also consume these cereals. Indeed, as previously mentioned, such households did not also purchase adult- and family-targeted RTE cereals in higher quantities compared with other households. Finally, our results are based on a cross-sectional survey; therefore, we cannot make conclusions about the direct impact of advertising on behaviours. Experimental studies, such as naturalistic trials in ‘real contexts’, are necessary to confirm a causal relationship. In spite of these limitations, only these kinds of economic databases enable researchers to attribute a precise nutritional value to each product and to describe purchases using various complementary indicators.
Conclusions
RTE cereal purchases are an interesting example to understand the relationship between advertising, nutritional quality and food purchase behaviours. Indeed, RTE cereal advertising is widely targeted to children, but often for products with nutritional quality that is far from optimal. A great variety of products exists in the market and advertising for high-quality products should be encouraged given its probable effect on purchases. This is relevant to improve diet, nutritional status and health in the population categories which seem particularly susceptible to food advertising according to our results (e.g. households with children, African-American and Hispanic households). Changes in food composition toward lower contents of sugar and Na and higher fibre content would be a complementary public health action. The NPI model could be used to identify new product formulations that would improve the overall nutritional quality of different cereals. In addition, cost variance analyses would help identify strategies to increase purchases of healthy RTE cereals, which tend to be priced higher than the less-healthy cereals. It would also be interesting to conduct equivalent analyses for other manufactured products containing sizeable amounts of sugar, salt and/or fat.
Acknowledgements
The research was funded by the Robert Wood Johnson Foundation and the Rudd Foundation. The authors declare no conflict of interest. K.C. was a visiting researcher at Rudd Center for Food Policy and Obesity at the time of the study; she conceived the analysis design, carried out analyses, interpreted results and drafted the manuscript. J.L.H. contributed to the analysis design conception, acquisition of data and interpretation of results, and revised the manuscript. M.B.S. contributed to interpretation of results and revision of the paper. All authors approved the final version of the paper for publication. The authors are grateful to Vishnudas Sarda (Rudd Center) for his help on data management.



