Depressive mood is common after myocardial infarction (MI)(Reference Guck, Kavan and Elsasser1) and 20 % of MI patients develop an episode of major depression(Reference Meneses, Almeida and Abecasis2). The association of depression with MI is critical, as the mortality rate is increased three to four times in depressed MI patients compared to non-depressed MI patients(Reference Frasure-Smith, Lespérance and Talajic3). As the level of non-responders is still high with antidepressant treatments(Reference Li, Kuk and Rush4, Reference Boessen, Groenwold and Knol5) and that the treatment may interfere with myocardial infarct size(Reference Naumenko, Latysheva and Gilinskii6), new antidepressant strategies need to be identified for such cases.
The physiopathology of depression is complex and different mechanisms are involved(Reference Krishnan and Nestler7). Our previous work and that of others indicate that proinflammatory cytokines may play a key role in depression-like behaviour(Reference Kaloustian, Bah and Rondeau8–Reference Simen, Duman and Simen10). Indeed, injection of proinflammatory cytokines is followed by depression-like behaviour(Reference Raison, Capuron and Miller11). Post-MI increased levels of proinflammatory cytokines are accompanied by apoptosis in the hippocampus and the amygdala, another physiopathological element of depression(Reference Kaloustian, Bah and Rondeau8, Reference Wann, Boucher and Kaloustian9, Reference Drzyzga, Marcinowska and Obuchowicz12).
Dietary interventions can be used to prevent the post-MI elevation of proinflammatory cytokines. For example, we have shown that high-PUFA n-3 diets reduce the circulating level of TNFα after MI(Reference Rondeau, Picard and Bah13). High-PUFA n-3 diets also reduce levels of monocyte chemotactic protein-1 (MCP-1), a chemokine that contributes to inflammatory states(Reference Diaz Encarnacion, Warner and Cheng14, Reference Wang, Wu and Matthan15). In parallel, it has been observed that Lactobacillus helveticus R0052 reduces proinflammatory cytokines IL-1β and IL-6, but non-significantly reduces TNF-α(Reference Cazzola, Tompkins and Matera16), whereas Bifidobacterium longum R0175 can reduce TNF-α as well as IL-8(Reference Wagar, Champagne and Buckley17). Combined with L. helveticus R0175, B. longum subsp. infantis R0033 and B. bifidum R0071 can also elevate the concentrations of anti-inflammatory cytokines IL-4(Reference Cazzola, Tompkins and Matera16), modifying the balance between pro- and anti-inflammatory cytokines. The fact that such nutritional interventions also reduce apoptosis in the limbic system suggests a potential antidepressant-like effect. The objective of the present study was thus to determine if probiotics and n-3-rich diets, combined or alone, could be beneficial to attenuate post-MI depression-like behaviour. While previous studies(Reference Rondeau, Picard and Bah13, Reference Girard, Bah and Kaloustian18) used nutritional strategies before heart ischaemia, the present protocol aimed at implementing the nutritional intervention after MI in order to increase clinical relevance.
Experimental methods
Ethics statement
These experiments conformed to animal care guidelines published by the Canadian Council on Animal Care, and the procedures performed were approved by the local Animal Care Committee of Hôpital du Sacré-Coeur de Montréal.
Experimental design
We studied a total of sixty-four male, 3-month-old Sprague–Dawley rats weighing 325–350 g at the start of the experiments (Charles River Canada). Rats were housed individually under constant conditions (temperature of 21–22°C and humidity of 40–50 %), including a 12 h dark–12 h light cycle, which began at 08.00 hours. Chow pellets and tap water were available ad libitum throughout the study. An acclimatisation period of 3 d after delivery by the supplier was allowed before the rats were randomly distributed in one of the four groups: a low- or high- n-3 PUFA diet in combination or not with probiotics L. helveticus R0052 and B. longum R0175 (mentioned later). Six rats from each group (a total of twenty-four) were killed 72 h post-MI for biochemical analyses and ten rats from each group (a total of forty) were killed 18 d post-MI after behavioural tests.
Diets
Chow pellets rich in lipid (22 % protein, 42·9 % carbohydrate, 20·3 % fat, by weight) were supplied by Harlan Teklad. The respective composition in fatty acids is presented in Table 1.
Composition of PUFA in the different diets (g/kg)

LA, linoleic acid; AA, arachidonic acid; ALA, α-linolenic acid; DPA, docosapentaenoic acid.
Probiotics
The probiotics that were given were a commercially available combination of two genera: L. helveticus R0052 and B. longum R0175 (Probio'Stick™ provided by Institut Rosell, Inc.). The probiotics were administered by dissolving the freeze-dried culture or the vehicle only (maltodextrin) in 200 ml of drinking tap water. Each rat in the probiotics group received a daily dose of 109 colony-forming units. The drinking solution was newly prepared every 2nd day for the duration of experiments. Water intake was monitored throughout the entire investigation to ensure that sufficient bacteria were administered. The body weight of each rat was also monitored every day.
Surgical procedure
Animals were anaesthetised following a ketamine/xylazine (50 and 5 mg/kg, respectively) intramuscular injection. Subsequently, the rats were intubated and anaesthesia was maintained using isoflurane (1·2 %) ventilation. Electrocardiogram and heart rate of the rats were monitored throughout the procedure using electrodes placed on their paws. A left thoracotomy was carried out at the fifth intercostal space, permitting the occlusion of the left anterior descending coronary artery using a 4–0 silk suture (Syneture; Covidien) and plastic snare. Ischaemia was confirmed by alterations of the ST segment and the presence of the ventricular subepicardial cyanosis. After 40 min of ischaemia, the thread was removed, permitting reperfusion of the myocardial tissue. Then, the thorax was sutured by means of a 2–0 silk suture (Syneture; Covidien), and the animals were given an antibiotic intramuscular injection (15 000 IU penicillin G; Duplocillin LA, Intervet Canada Limited) as well as an analgesic subcutaneous injection (2 mg/kg buprenorphine) before being returned to their respective cages. The animals received a second analgesic injection (0·05 mg/kg buprenorphine) the day after surgery.
Decapitation measurements, the area at risk of the heart, myocardial infarct size and brain dissection
After the reperfusion period (3 or 18 d), the animals were restrained in a cone bag and rapidly killed by decapitation, a method that avoids alterations of biochemical pathways that could arise ensuing anaesthesia or CO2 exposure. Blood samples were taken from the arteries after the decapitation. The brains and hearts were rapidly removed and placed in a dish kept on crushed ice. The dentate gyrus (DG), CA1 and CA3 areas of the hippocampus as well as the lateral amygdala (LA) and medial amygdala (MA) were excised from the brains, snap-frozen in liquid N2 and stored at − 80°C until needed. The hearts were removed and washed with saline by retrograde perfusion into aorta. The left anterior descending coronary artery was occluded at the same site as for inducing MI (as mentioned earlier) to map the area at risk (AR) using an infusion of Evans blue (0·5 %). The hearts were frozen ( − 80°C for 5 min), sliced into four transverse sections of 2 mm and placed in 2,3,5-triphenyltetrazolium (1 %, pH 7·4) at 37°C for 10 min to better distinguish the area of necrosis (I) from AR. The MI was expressed as a percentage of necrosis (I) of the AR ((I/AR) × 100). Additionally, AR was expressed as a percentage of left ventricle area (LV) ((AR/LV) × 100).
Biochemical analysis
Caspase-3 activity
Caspase-3 activity was measured according to the protocol described previously(Reference Boucher, Wann and Kaloustian19). Tissues were homogenised by sonification in lysis buffer and incubated for 30 min on ice. The tissue homogenates were centrifuged at 4°C for 10 min. Enzymatic reactions were undertaken in reaction buffer with 25 mg of protein (attested by the Bradford method) and fluorescent substrate (Ac-DEVD-AMC; CEDARLANE; 40 μm). Reactions were studied after incubation in the dark for 3 h at 37°C, and stopped with the addition of 0·4 m-NaOH and 0·4 m-glycine buffer. Fluorescence was quantified by spectrofluorometry (Photon Technology International) at an excitation wavelength of 365 nm and emission wavelength of 465 nm.
Terminal dUTP nick-end labelling-positive cells
TUNEL analysis was undertaken according to the protocol provided by the manufacturer (Oncogene Science, Inc.) and according to the TUNEL protocol described previously(Reference Kaloustian, Bah and Rondeau8). In summary, cryostat sections were fixed in paraformaldehyde (4 %) and rinsed, then permeabilised and, after washing, the labelling reaction was performed for 1 h at 37°C. The reaction was stopped, and all nuclei were stained with propidium iodide (1 μm). The sample was viewed in a Leica epi-illumination microscope with a filter for 4′,6-diamidino-2-phenylindole (DAPI) (330–380 nm). All sections were photographed at the same magnification (400 × ) with a Nikon Coolpix 995 camera (Nikon Canada). A total of 20–25 pictures were taken of each sample, with quantification of positive cells on total number.
Rat cytokines/chemokines assay
A cytokine/chemokine assay was performed according to the protocol provided by the manufacturer (Rat Cytokine/Chemokine Magnetic Bead 96-Well Plate, Millipore Canada). In brief, the plasma was diluted by 5-fold and 200 μl of assay buffer was added into each well of the plate, mixed for 10 min at room temperature and decanted. The diluted samples were incubated overnight at 4°C in the reaction mix in the presence of beads, and the next morning, the plates were washed and incubated for 2 h at room temperature with detection antibodies. After that, streptavidin–phycoerythrin solution was added to the wells for 30 min followed by the addition of sheath fluid. Plates were run on a Bio-Plex 200 system with high-throughout fluidics (Bio-Rad). The median fluorescent intensity was analysed to determine the plasma concentrations of MCP-1 and IL-4.
Behavioural measures
The tests employed were selected on the basis of their validity regarding behavioural depression syndrome. All tests were conducted individually, in the morning, starting 12 d after surgery. Social interaction was evaluated on day 12, the forced swimming test was performed on days 15 and 16 and the passive avoidance step-down test on day 17. All animals were killed on day 18.
Social interaction test
Pairs of rats were each placed in a clean shoebox for 10 min. During this period, two observers without knowledge of the experimental condition observed one animal each; the duration and number of interactions with the other rat was measured. Rats were tested between 09.00 and 11.00 hours.
Forced swim test
Rats were placed individually in a transparent 25 cm diameter pool filled to a depth of 30 cm with 22–25°C water, with no possible escape. Two observers without knowledge of the experimental condition used identical chronometers to time the immobile, swim and escape trial periods of the animals. The test was conducted for 2 d: day 1 comprised 15 min of habituation and day 2 entailed the actual 5 min test. On the 2nd day, immobility time was translated into depressive symptoms by comparison to the controls. Rats were tested between 09.00 and 11.00 hours.
Passive avoidance step-down test
Rats were placed individually in a test chamber (14 cm × 23 cm) on a Plexiglas platform (14 cm × 19 cm). An electrifiable grid (14 × 14 cm) is placed alongside and 2·5 cm lower than the Plexiglas platform (14 cm × 14 cm). When the animal places all four feet on the electrifiable grid, it receives a mild, brief shock (5 mA for 1 s) and is removed from the test chamber. After 30 s, it is placed anew on the platform. If the rat remains on the platform without going onto the grid for 1 min, it is removed from the test box for 30 s. Criterion is reached when the rat avoids going onto the grid for three consecutive trials. The number of trials needed to reach the test criterion and the time needed to learn the test were noted. Rats were tested 1 d before they were killed.
Statistical analysis
Data are reported as means with their standard errors. Groups were compared with a two-way factorial ANOVA, using diet and probiotics as factors. If an interaction between diet and probiotics was significant, simple effects were analysed according to Field(Reference Field20), otherwise if an interaction was not significant, main effects were reported. The MI size and AR were compared using Student's t tests. Number of trials in the passive avoidance test were analysed with the Kruskal–Wallis test (P < 0·05) followed by a Mann–Whitney test using Bonferroni correction to adjust for the number of comparisons. The TUNEL staining data were evaluated with χ2 tests followed by portioning according to Siegel & Castellan(Reference Siegel and Castellan21). P < 0·05 was considered significant.
Results
Food, water consumption and weight gain were similar between groups throughout the protocol (data not shown), indicating that diet had no influence on these measures.
Infarct size
After 72 h and 18 d post-MI reperfusion, MI size was similar between groups and represents about 35 % of the AR (data not shown). This indicates that diets had no protective effect on the ischaemic myocardium when started during the reperfusion period.
Apoptosis
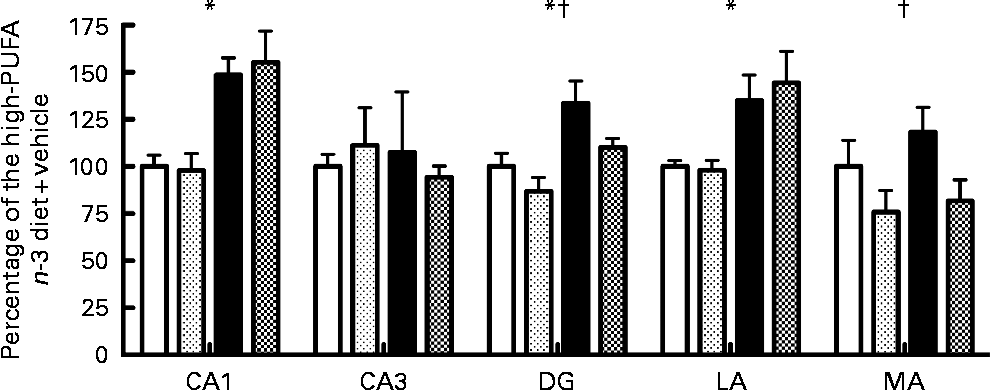
No significant interaction was observed for caspase-3 activity among the five regions tested after 72 h of reperfusion. Main effect analysis indicated that caspase-3 activity was significantly higher in the low- n-3 PUFA diet compared to the high- n-3 PUFA diet (diet factor) in the CA1 (F(1,16) = 24·04; P < 0·05), DG (F(1,19) = 11·27; P < 0·05) and in the LA (F(1,15) = 11·77; P < 0·05) (Fig. 1). Caspase-3 activity was similar in the CA3 and MA for the diet factor (Fig. 1). Analyses of the probiotic factor indicated a significant reduction in caspase-3 activity in the DG (F(1,19) = 4·68; P < 0·05) and MA (F(1,15) = 5·63; P < 0·05) areas. No significant difference was observed in the CA1, CA3 and in the LA for the probiotic factor (P>0·05; Fig. 1).
Caspase-3 activity, expressed as a percentage of the high- n-3 PUFA diet+vehicle, in different limbic regions assessed by in vitro spectrofluorescence after 72 h of reperfusion. CA1, hippocampal CA1; CA3, hippocampal CA3, DG, dentate gyrus; LA, lateral amygdala; MA, medial amygdala. Values are means, with their standard errors represented by vertical bars (n 4–6 per group). * Mean values were significantly different for the diet factor (P < 0·05). † Mean values were significantly different for the probiotic factor (P < 0·05). ![]() , High-PUFA n-3+vehicle;
, High-PUFA n-3+vehicle; ![]() , high-PUFA n-3+probiotics; ■, low-PUFA n-3+vehicle;
, high-PUFA n-3+probiotics; ■, low-PUFA n-3+vehicle; ![]() , low-PUFA n-3+probiotics.
, low-PUFA n-3+probiotics.

The TUNEL-positive cells were significantly increased in the low- n-3 PUFA diet compared to the high- n-3 PUFA diet in the CA1, DG, LA and MA regions. The probiotics group showed a decrease in the TUNEL-positive cells in the DG and MA regions v. the placebo group (P < 0·05; Table 2). No other difference was observed.
Percentage of terminal dUTP nick-end labelling-positive cells on total cell count in different limbic regions analysed at 72 h after reperfusion

CA1, hippocampal CA1; CA3, hippocampal CA3; DG, dentate gyrus; LA, lateral amygdala; MA, medial amygdala.
Behavioural tests
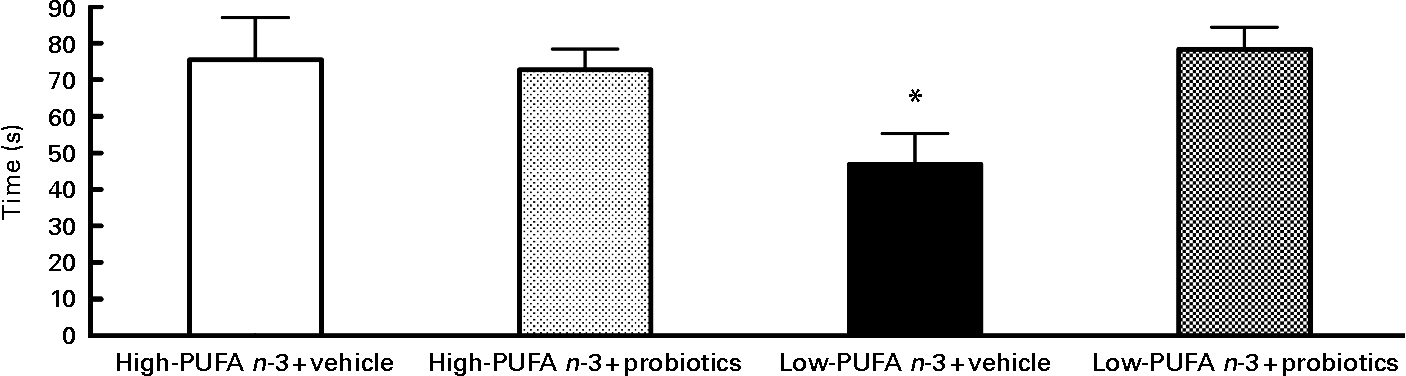
Analyses of social interaction duration disclosed a significant interaction between diet and probiotics (F(1,28) = 5·34; P < 0·05). Analysis of simple effects revealed lower values in the low- n-3 PUFA diet without probiotics compared to the low- n-3 PUFA with probiotics (F(1,29) = 7·40; P < 0·05), indicating the beneficial effect of probiotics in the presence of the low- n-3 PUFA diet (Fig. 2).
Social interaction – results of social interaction test proceed on the 12th day of reperfusion in seconds. Values are means, with their standard errors represented by vertical bars (n 8–10 per group). * Indicates a significant interaction (P < 0·05).
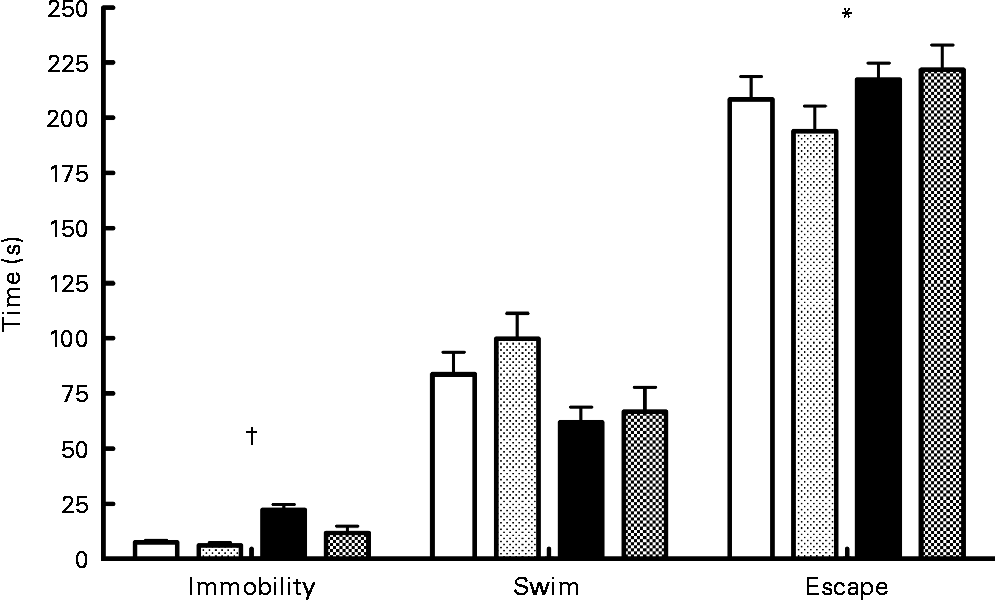
Results of the forced swim test (Fig. 3) indicated a significant interaction between diet and probiotics for the immobility variable (F(1,33) = 4·55; P < 0·05). Analysis of simple effects showed that probiotics reduced immobility time in the low- n-3 PUFA diet (F(1,34) = 7·36; P < 0·05) compared to the low-n-3 PUFA diet without probiotics. A significant diet main effect was also found for the escape variable (F(1,33) = 6·44; P < 0·05), indicating a lower escape time in the low- n-3 PUFA diet rats. No difference was observed for the swimming time parameter.
Forced swim test – results of the forced swim test proceed on the 16th day of reperfusion. Values are means, with their standard errors represented by vertical bars (n 9–10 per group). * Mean values were significantly different for the diet factor (P < 0·05). †Significant interaction for immobility time (P < 0·05). ![]() , High-PUFA n-3+vehicle;
, High-PUFA n-3+vehicle; ![]() , high-PUFA n-3+probiotics; ■ , low-PUFA n-3+vehicle;
, high-PUFA n-3+probiotics; ■ , low-PUFA n-3+vehicle; ![]() , low-PUFA n-3+probiotics.
, low-PUFA n-3+probiotics.
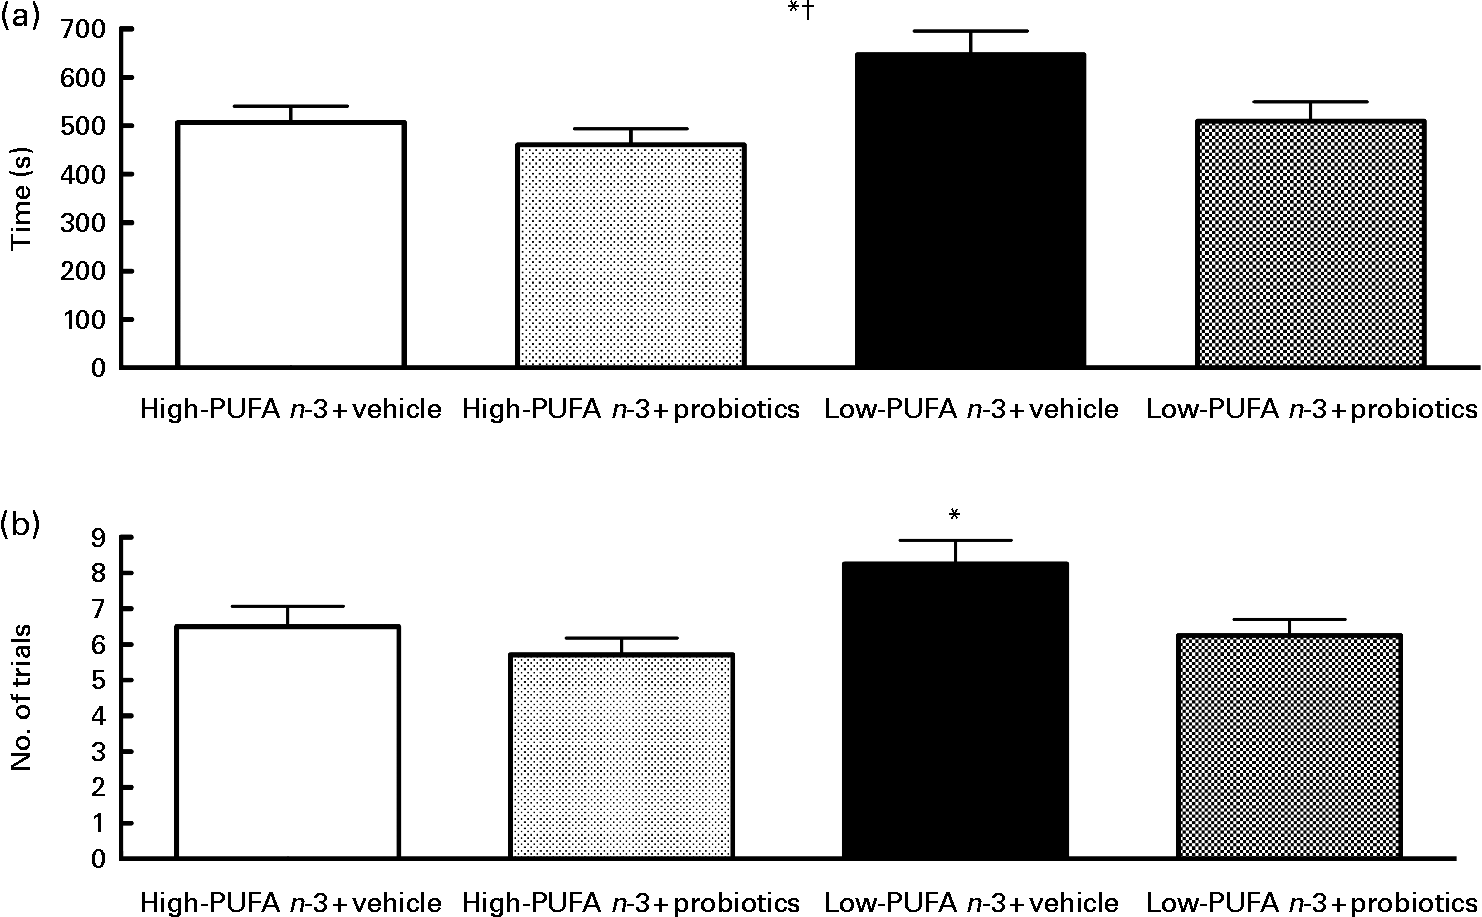
The passive avoidance step-down test did not disclose a significant interaction, but the main effect of diet (F(1,27) = 5·65; P < 0·05) and probiotics (F(1,25) = 5·33; P < 0·05) was found, indicating that the rats in the high- n-3 PUFA diet and the probiotics groups succeeded more rapidly (Fig. 4). Number of trials indicated a significant difference between groups (χ2 = 7·89, df = 3, P < 0·05). The results indicate that the low- n-3 PUFA diet without probiotics group took more attempts to succeed the test, as compared to the low- n-3 PUFA diet with probiotics group (P = 0·029).
Passive avoidance test – results of the passive avoidance test proceed on the 17th day of reperfusion. (a) Time to succeed in seconds. Values are means, with their standard errors represented by vertical bars (n 8–10 per group). * Mean value was significantly different for the diet factor (P < 0·05). † Mean value was significantly different for the probiotic factor (P < 0·05). (b) Number of trials. * Value was significantly different between low- n-3 PUFA diet+vehicle, as compared to the other groups (P < 0·05).
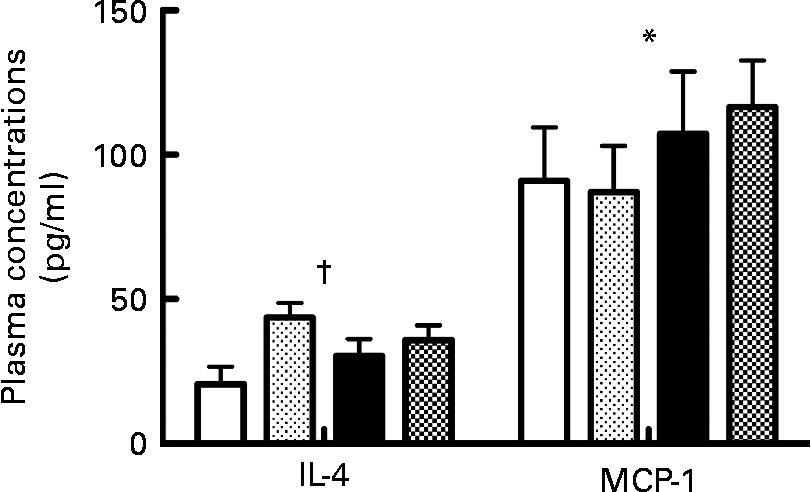
Cytokine/chemokine assay
The probiotic diet was associated with significantly higher IL-4 plasma concentrations compared to vehicle (F(1,24) = 6·65; P < 0·05). The low- PUFA n-3 diet was associated with significantly higher MCP-1 plasma concentrations compared to the high-PUFA n-3 diet (F(1,30) = 4·74; P < 0·05; Fig. 5).
Plasma concentrations of IL-4 and monocyte chemotactic protein-1 (MCP-1). Values are means, with their standard errors represented by vertical bars (n 8–10 per group). * Mean value was significantly different for the diet factor (P < 0·05). † Mean value was significantly different for the probiotic factor (P < 0·05). ![]() , High-PUFA n-3+vehicle;
, High-PUFA n-3+vehicle; ![]() , high-PUFA n-3+probiotics; ■ , low-PUFA n-3+vehicle;
, high-PUFA n-3+probiotics; ■ , low-PUFA n-3+vehicle; ![]() , low-PUFA n-3+probiotics.
, low-PUFA n-3+probiotics.
Discussion
The data obtained in the present study show that a high- n-3 PUFA diet implemented for 2 weeks after a MI reduces depression-like behaviour, as documented by three different behavioural tests. Similarly, the combined intake of probiotics L. helveticus R0052 and B. longum R0175 had a positive effect on depression-like behaviour in presence of a low- n-3 PUFA diet. The addition of probiotics to the high- n-3 PUFA diet has no additional effect on behaviour after MI, suggesting a common pathway of action between n-3 and probiotics, or alternatively, a plateau effect on behaviour is reached with the high- n-3 PUFA diet without any possibility of improvement in the presence of probiotics.
Both nutritional interventions (n-3 and probiotics) were started after the onset of reperfusion and did not have a significant effect on infarct size, as expected. Indeed, cardioprotective interventions need to be started at the onset of reperfusion or soon after to be beneficial for the myocardium(Reference Boucher, Pesant and Falcao22). We have shown, for example, that the administration of an A2A adenosine receptor agonist, CGS21680, 5 min before the reperfusion period reduced infarct size, whereas its administration 5 min after the onset of reperfusion did not(Reference Boucher, Pesant and Falcao22). In the present study, n-3 or probiotics were started after the animals recovered from anaesthesia, i.e. a few hours after the onset of reperfusion.
In previous studies, we documented the presence of apoptosis in the amygdala and hippocampus following MI, with a peak at about the 3rd day of reperfusion(Reference Kaloustian, Wann and Bah23, Reference Wann, Bah and Kaloustian24). Interestingly, pharmacological interventions with antidepressants (sertraline(Reference Wann, Bah and Kaloustian24)) or others (probiotics(Reference Girard, Bah and Kaloustian18)) have been shown to reduce apoptosis and also to attenuate the depression-like behaviour. The increase in cell death perturbs the homeostasis of the limbic system and can be responsible for the depression-like behaviour. Indeed, it has been shown that neurons that have neither electrical activity nor trophic support die by apoptosis(Reference Jacobson, Weil and Raff25) and could explain the development of depression.
We observed that the inhibition of apoptosis by the n-3 diet or the probiotics is common for the DG and MA, whereas reduction of apoptosis has been observed in the CA1 and LA only in the n-3 diet. These results suggest that the DG and MA play a pivotal role in post-MI depression, and their integrity are important to attenuate post-MI depression behaviour.
According to our previous work, proinflammatory cytokines could be partly responsible for apoptosis in the limbic system. In the presence of pentoxifylline(Reference Wann, Boucher and Kaloustian9) or polyethylene glycol-linked TNF receptor 1 (PEG-TNFR)(Reference Kaloustian, Bah and Rondeau8), apoptosis in the limbic system is attenuated after MI, as compared to untreated animals, suggesting a role of proinflammatory cytokines in apoptosis. The binding of these cytokines, such as TNFα, with their receptors activates caspase-8 and ultimately caspase-3.
In the present study, rats treated with probiotics maintain higher concentrations of IL-4, which has been also reported with other probiotics(Reference Bahrami, Macfarlane and Macfarlane26, Reference Hoppu, Isolauri and Laakso27). IL-4 is known to modulate microglial activity and can be correlated with a decrease in inflammation(Reference Lyons, Downer and Crotty28) and protects host tissues from complement activation(Reference Andoh, Fujiyama and Sumiyoshi29). Also, it has been reported that probiotics, such as the combination used in the present study, reduce the concentration of proinflammatory cytokines (IL-1β and TNFα)(Reference Cazzola, Tompkins and Matera16, Reference Wagar, Champagne and Buckley17). The shift of the pro/anti-inflammatory cytokine balance may contribute to a reduction of apoptosis as well as an improvement of the depression-like behaviour symptoms.
Similarly, we have observed that in presence of the high- PUFA n-3 diet, the plasma concentrations of MCP-1 were reduced compared to the low- n-3 diet. This reduction could be explained by the documented reduction of TNFα which we have previously observed in presence of the same high- PUFA n-3 diet(Reference Rondeau, Picard and Bah13). According to the results obtained by Diaz Encarnacion et al. (Reference Diaz Encarnacion, Warner and Cheng14), a high- PUFA n-3 diet can reduce the TNFα-stimulated transcription of the MCP-1 gene through interaction of signalling pathways involving extracellular signal-regulated kinases and NF-κB. A decrease in MCP-1 could be part of the anti-inflammatory and antidepressive action of n-3.
The rapidity of the effect of n-3 on apoptosis observed in the limbic system may suggest mechanisms other than the incorporation in the membrane. It has been observed that n-3 metabolites, such as resolvins, may interact with G-protein-coupled receptors such as chemerin receptor 23(Reference Arita, Ohira and Sun30) or G protein-coupled receptor 32(Reference Krishnamoorthy, Recchiuti and Chiang31) to induce an intracellular signal that could interrupt inflammation by down-regulating NF-κB factor, leading to a diminution on inflammatory gene expression such as TNFα(Reference Adkins and Kelley32). The mechanism of this down-regulation is not well understood, but it could be due to a decrease of the phosphorylation of inhibitor of NF-κB factor, which inhibits NF-κB(Reference Ross, Maingay and Fearon33). Another potential explanation for the anti-apoptotic properties of n-3 PUFA is that DHA is a precursor of neuroprotectin D, a substance that induces pro-survival signals down-regulating apoptosis(Reference Mukherjee, Marcheselli and Barreiro34). Systemic DHA administration, after middle cerebral artery occlusion, helps in neuroprotectin D production(Reference Belayev, Khoutorova and Atkins35) and may, thus, reduce apoptosis by altering the intrinsic pathway.
The difference between the n-3 diets can be explained by the presence of EPA and DHA (long-chain PUFA) in the high-n-3 diets and their absence in the low-n-3 diet. EPA and DHA are beneficial for the heart and the brain(Reference Zhu, Sievers and Sun36) and it has been observed that elongation of α-linolenic acid, although limited(Reference Heller, Stehr and Koch37, Reference Lands38), can occur in rats and produce DHA and EPA. In the low-n-3 diet, however, α-linolenic acid levels may be insufficient or the delay to produce DHA and EPA may be too long to have a positive effect.
Conclusion
In conclusion, the present data indicate that a high-n-3 PUFA diet or addition of L. helveticus R0052 and B. longum R0175 to a low-n-3 PUFA diet is beneficial after MI to reduce apoptosis in the limbic system and to attenuate depression-like behaviour.
Acknowledgements
The present work was supported by La Fondation des Maladies du Coeur du Québec. The authors declare no conflict of interest. The authors want to thank Institut Rosell Lallemand for providing the probiotics (L. helveticus R0052 and B. longum R0175) and the vehicle. K. G., J. A.-B., F. F. M., A. B. and T. A. T. contributed to the experiments, data analysis and writing, and R. G. and G. R. contributed to the conception of the experiments, data analysis and writing.