

The Supplemental Nutrition Assistance Program (SNAP, formerly called the Food Stamp Program) is the largest US food assistance programme, serving over 40 million persons monthly in 2010 with an average benefit of $US 134 per person per month(1). Households qualify for the programme based on income and assets. Benefits are determined by the number of qualifying individuals in the household and monthly income net of allowable deductions. Benefits are accessed with an electronic benefit card and can be used only to purchase food at authorized retailers, which include most grocery stores and supermarkets and many smaller stores. Because of the programme's size and importance, there is substantial policy interest in assessing its effectiveness.
Previous research on SNAP and food security
Research to estimate the effect of SNAP on food security is hampered by the self-selection of more food-needy households into the programme. Participation is voluntary, and about one in three eligible households do not participate. In cross-sectional survey data, SNAP recipients are consistently found to be less food secure than non-participants who are otherwise similar on measured characteristics. This is attributed to self-selection of more food-insecure households into the programme more than offsetting improvement in food security due to programme participation.
Without explicitly modelling the endogeneity due to selection, multivariate regression in cross-sectional data can control only for observable differences between households. Such analyses generally show a positive association between programme participation and higher food insecurity, presumed to be due to selection bias(Reference Fox, Hamilton and Lin2, Reference Jensen3).
Unobserved time-invariant differences between households can be controlled by applying fixed-effect models to longitudinal data. Some of the unobserved heterogeneity appears to be time variant, however, and some fixed-effect models have been found to reduce, but not remove, the positive association between programme participation and food insecurity(Reference Wilde and Nord4, Reference Ribar and Hamrick5). On the other hand, DePolt et al.(Reference DePolt, Moffitt and Ribar6) found relatively strong negative associations of food hardship with SNAP participation in both fixed-effect and random-effect models using panel data for households with children from the Three-City Study. Their findings were strengthened by a richer set of covariates than has been available in most similar studies and by participation information based on administrative data. Probabilities of food hardship (based on measures similar to food security) were 30–50 % lower for participants than for non-participants. An alternative approach using panel data with more month-by-month SNAP participation information found that the prevalence of food insecurity worsened beginning about 8 months prior to initial receipt of SNAP benefits and improved by about a third shortly after households began to receive benefits(Reference Nord and Golla7).
Approaches that explicitly account for selection using simultaneous equation models have obtained mixed results(Reference Gundersen and Oliveira8, Reference Huffman and Jensen9). Instrumental variable methods, obtaining identification from State-level policy differences, have returned more positive results(Reference Yen, Andrews and Chen10, Reference Ratcliffe and McKernan11), suggesting that SNAP participation reduced the probability food insecurity by one-third and the probability of very low food security by 20–33 %. Analysis of a ‘natural experiment’ in the form of State differences in welfare policy before and after the 1996 changes in the US welfare system found that food security worsened among immigrant populations whose access to public assistance (including, but not limited to, food assistance) had been impeded(Reference Borjas12). Identification in any single one of these models is uncertain because it depends on unverifiable assumptions about the functional forms of associations, distributions of errors and the independence of identifying variables. However, the concurrence of findings of the two strongest of these research designs(Reference Yen, Andrews and Chen10, Reference Ratcliffe and McKernan11), and the similarity of their findings with those of the strongest longitudinal studies(Reference DePolt, Moffitt and Ribar6, Reference Nord and Golla7), suggests that SNAP alleviates food insecurity, perhaps reducing very low food security by around one-third or somewhat more.
The present study complements these studies by examining associations of food security with programme exit rather than programme entry or participation. This approach avoids many of the self-selection effects that have plagued previous analyses and thus avoids the methodological complexities of dealing with them. The consistency of the findings from this very different approach with those from the selection-effect and longitudinal models that appear to be the strongest methodologically increases confidence that those approaches have adequately modelled the selection effects and thus increases confidence in their findings.
Overview of the present study
The present study compares the food security of households that exited SNAP during a survey year with that of households still on the programme at the end of the year. A measure of households’ food security during the 30-d period prior to the December food security surveys is used in order to reflect conditions of exiting households after they left the programme and of continuing SNAP recipients during the same time period.
Several studies have found that food insecurity and very low food security are more prevalent in households that have recently left SNAP than among households still receiving SNAP benefits(Reference Nord13–Reference Nord, Coleman-Jensen and Andrews16). This suggests that the ameliorative effect of the programme on food insecurity may be stronger than the self-selection effect of remaining on the programme v. exiting among households that received SNAP at some time during a year.
Multivariate regression methods are used to adjust for potentially confounding factors such as income, employment, and household demographics and structure. This ‘pseudo longitudinal’ analysis, based on retrospective reporting of when SNAP benefits were received, is combined with analysis of 2-year panels to provide control for the severity of food insecurity in the previous year. This controls to some extent for remaining self-selection on unobserved variables.
Several potential sources of self-selection on unobserved characteristics that bias analyses based on programme entry may be avoided in analyses based on programme exit. This approach avoids, for example, self-selection due to a general unwillingness to accept assistance from a government programme, unawareness of the programme, and ineligibility due to immigration status or asset holdings. Some unobserved self-selection effect probably remains, even in the present analysis, so the results may be considered lower-bound estimates of the ameliorative effect of the programme.
Data and methods
Data were from the Current Population Survey Food Security Supplements (CPS-FSS) conducted by the US Census Bureau in December of each year from 2001 to 2009. The CPS-FSS is an annual supplement to the monthly Current Population Survey. It is nationally representative of the civilian, non-institutionalized population of the United States. The CPS-FSS collects information on how much households spend for food, their use of Federal and community food and nutrition assistance programmes, such as SNAP, and their food security during the 12 months and 30 d prior to the survey. The CPS core labour force data include information on household composition, demographics and income, and the employment and labour force status of persons aged 15 years and older. The CPS-FSS is the data source for the US Department of Agriculture's annual report on household food security in the United States(Reference Nord, Coleman-Jensen and Andrews16). The combined analysis sample comprised 23 082 households that received SNAP at some time during a survey year and had valid data on 30 d food security and SNAP receipt.
Two sets of analyses were conducted. One used the pooled single-year (cross-section) samples. The second used pooled 2-year longitudinal panel samples. Each household in the CPS-FSS is interviewed in two consecutive years. Two-year panel samples were constructed for each pair of consecutive years 2001–2002 to 2008–2009 by matching data for the same household in the two consecutive years. These eight samples were then pooled and data elements were identified as from Year 1 or Year 2. Households were omitted from the panel sample if they moved between years or were not interviewed in either year. The 2-year panel sample was further limited to households that received SNAP benefits in Year 1, including in the final 30 d prior to the Year 1 food security survey, and received SNAP benefits in one or more months in Year 2.
Low-income households are more likely to move or to miss an interview, so are typically under-represented in 2-year panel samples. Among households that received SNAP in Year 2, 24 % were not interviewed in Year 1 and an additional 18 % had moved into the residence since the Year 1 survey and so could not be included. To assess whether non-random sample loss biased results in the 2-year models, the main single-year model was replicated using the second-year data in the 2-year panel sample.
Measuring food security
Household food security – access by all household members at all times to enough food for active healthy living – is measured in the CPS-FSS by responses to a series of questions about food-related behaviours, experiences and conditions that characterize households having difficulty meeting their food needs(Reference Nord, Coleman-Jensen and Andrews16–Reference Bickel, Nord and Price19). Based on the number of food-insecure conditions reported, households are classified as either food secure or food insecure. Food-insecure households are further classified as having low food security or very low food security. Very low food security, the condition analysed in the present study, is a severe range of food insecurity in which households have reported multiple indications of reduced food intake and disrupted eating patterns due to inadequate resources for food.
Food security is assessed in the CPS-FSS both over the 12-month and 30-d periods prior to the survey. This study used the 30-d measure, in order to assess food insecurity with greater temporal precision relative to receipt of SNAP benefits(Reference Nord20). To minimize measurement effects associated with the presence of infants and young children in some households(Reference Nord and Bickel21), food security was assessed using only the seven adult-referenced items in the 30-d scale – the same scale normally applied to households without children.
Measuring SNAP participation and household characteristics used as covariates
Households that reported receipt of SNAP benefits within 30 d of the first date of the CPS-FSS survey week (in early to mid December) were coded as having received SNAP benefits within the 30 d prior to the survey. Households that reported receiving SNAP benefits at some time during the year prior to the survey but not during the previous 30 d were classified as recent SNAP leavers. The dollar amount of each household's most recent SNAP benefit was compared with the cost of the Thrifty Food Plan (TFP) for that household(22) as an approximation for the maximum SNAP benefit. The benefit size was classified as small (up to one-third of the cost of the TFP, medium (one-third to two-thirds of the cost of the TFP) or large (more than two-thirds of the cost of the TFP). The TFP is a low-cost ‘market basket’ of food, specified by age and gender, that meets current dietary standards and is approximately equal to the maximum SNAP benefit for the household.
The annual income for each household was assigned at the midpoint of the reported range and compared with the Federal poverty line for that household and survey year to adjust for household size and price inflation. The employment/labour force status of the primary earner in each household during the week prior to the survey was assigned in a two-step process. First the status of each adult in the household during the week prior to the survey was assigned in one of the following seven categories:
1. employed full time;
2. not in the labour force – retired;
3. employed part time for non-economic reasons (i.e. do not want to work more hours);
4. employed part time for economic reasons (i.e. want to work more hours, unable to find a job with more hours);
5. unemployed, looking for work;
6. not in the labour force due to disability; and
7. not in the labour force for reasons other than retirement or disability.
Then, the lowest-numbered status reported was assigned to the household.
Analytic methods
Bivariate associations were assessed by cross-tabulating households by food security status and SNAP status in the 30-d period prior to the food security survey. Statistical significance of the difference between groups was assessed using χ 2 statistics with an assumed design effect of 1·6 based on previous research(Reference Cohen, Nord and Lerner23).
Logistic regression models were estimated with very low food security during the 30 d prior to the survey as the dependent variable. The coefficient of interest was that of continued participation in SNAP during the 30 d prior to the survey. The models included controls for survey year, income relative to the poverty line (eight categories), household employment/labour force status (seven categories), educational attainment of the most highly educated adult in the household (four categories), household composition (six categories), presence of elderly, race and Hispanic ethnicity of the household reference person (three categories), and Census region (four categories). Models that were not restricted to households with large SNAP benefits also included controls for the size of the SNAP benefit relative to maximum benefit (three categories).
In the models using the 2-year panel data, the dependent variable was very low food security in Year 2. The coefficient of interest was that of continued participation in SNAP during the 30-d period prior to the Year 2 survey. The main purpose of the panel-data models was to control for severity of food insecurity in Year 1. (That is, these were not fixed-effect panel models. Each household contributed a single observation with the dependent variable and most covariates from Year 2 data and the lagged dependent variable from Year 1 data, and selected ‘change’ covariates based on data from Year 1 and Year 2.) In addition to the covariates in the single-year models (based on conditions in Year 2), the panel-data models included controls for changes from Year 1 to Year 2 in full-time employment and household composition. Changes in income were included in exploratory models, but were not statistically significant and were omitted from the final models.
Two additional logistic regression models were estimated using the 2-year panel data to determine to what extent differences between the single-year and 2-year results reflected sample differences v. more adequate controls for selection. The sample for the 2-year panel differed in two key respects from that in the single-year sample: (i) households that moved or missed one of the two interviews were omitted; and (ii) households that did not receive SNAP in the year prior to the analysed year were omitted. The two ‘intermediate’ models were estimated using the same covariates as in the main single-year model (measured in Year 2). One model included households that did not receive SNAP in Year 1, the second omitted them.
All calculations were conducted in the SAS statistical software package version 9·2 (2008; SAS Institute, Inc., Cary, NC, USA) and used household supplement sampling weights. Variance estimates in the logistic regression analyses were calculated with weights normalized to the sample size, but no adjustment was made for the complex sample design.
Findings
On average 82·5 % of households that received SNAP at some time during a year remained on the programme in the 30-d period prior to that year's food security survey. Consistent with results reported in earlier studies(Reference Nord13–Reference Nord, Coleman-Jensen and Andrews16), very low food security was less prevalent among households that remained on SNAP (14·90 %, Table 1) than among recent SNAP leavers (17·81 %). The difference corresponds to an odds ratio of 0·808 and was statistically significant (P = 0·04). The difference was greater for households that received relatively large SNAP benefits (exceeding about two-thirds of the maximum benefit for the household size), 12·45 % for those remaining on SNAP compared with 17·15 % among recent SNAP leavers (OR = 0·687, P < 0·001).
Prevalence rates of very low food security among households that received SNAP benefits at some time during the year, by SNAP receipt in the 30-d period prior to the food security survey
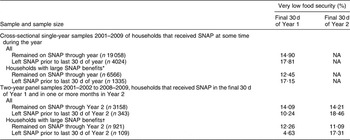
SNAP, Supplemental Nutrition Assistance Program; NA, not applicable.
Data source: Current Population Survey Food Security Supplement, 2001–2009.
*SNAP benefit last received exceeded about two-thirds of the maximum benefit for the household size.
†Sample of households with large SNAP benefits that left SNAP prior to last 30 d in Year 2 was small (n 109).
The negative associations between very low food security and continuing SNAP participation were stronger and highly statistically significant with controls for household economic and demographic characteristics (Table 2, models 1 and 2). (Tables of descriptive statistics for the analysis samples and complete tables of all regression models are available in the Appendix published separately online.) Households that continued on SNAP through the end of the year had about 28 % lower odds of very low food security in the last 30 d of the year than households that left SNAP prior to that period. Among households that received large SNAP benefits, the odds of very low food security were 37 % lower for those that continued to receive SNAP than for those that left the programme. The stronger associations in the multivariate models are consistent with the generally more favourable income and employment of SNAP leavers documented by Nord and Coleman-Jensen(Reference Nord and Coleman-Jensen15).
Logistic regression models of very low food security during the 30 d prior to the food security survey on continued receipt of SNAP benefits during the same period, among households that received benefits at some time during the year, with controls for household economic, demographic and geographic characteristics
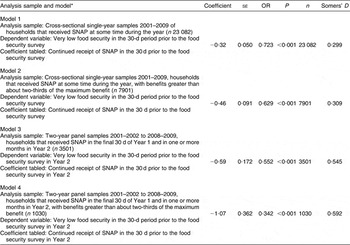
SNAP, Supplemental Nutrition Assistance Program.
Data source: Current Population Survey Food Security Supplement, 2001–2009.
*All models included controls for survey year, income relative to the poverty line, employment or labour force status of household primary earner, educational attainment of the most highly educated adult in the household, household composition, presence of elderly, race and Hispanic ethnicity of the household reference person, and Census region. Models 1 and 3 included, in addition, controls for the size of the SNAP benefit relative to maximum benefit. Panel-data models included the same variables (indicating conditions in Year 2) and, in addition, raw score in Year 1 on the 30-d adult food security scale (eight categories), changes in full-time employment, and changes in household composition from Year 1 to Year 2. Changes from Year 1 to Year 2 in income were included in exploratory models, but were not statistically significant and were omitted from the final models.
The bivariate associations were similar and the multivariate associations stronger in the 2-year panel sample. All households in this sample received SNAP in Year 1, including in the final 30 d prior to the Year 1 food security survey, and also received SNAP in one or more month in Year 2. (SNAP receipt was not necessarily continuous in every month until leaving the programme in Year 2, although that pattern characterized a large majority of households.) The analyses compared households that received SNAP in the 30-d period prior to the Year 2 food security survey with those that left the programme during Year 2 prior to that final 30-d period. The prevalence of very low food security late in Year 2 was lower among current recipients (14·21 %, Table 1) than among those who had left the programme (18·46 %, OR = 0·732), but the difference was not statistically significant (P = 0·14). However, the prevalence of very low food security of households that remained on the programme in Year 2 was essentially the same as it had been late in Year 1 (14·09 %), while that of households that left SNAP in Year 2 was nearly twice as high in Year 2 (18·46 %) as it had been in Year 1 (10·24 %). The year-to-year difference among SNAP leavers corresponds to an odds ratio of 1·984 and was highly statistically significant.
The multivariate results were consistent with the bivariate results (Table 2, model 3). With controls for household characteristics in Year 2, changes in relevant characteristics from Year 1 to Year 2, and severity of food insecurity in Year 1, the odds of very low food security late in Year 2 were 45 % lower among households that remained on SNAP than among SNAP leavers (OR = 0·552, P < 0·001). The two intermediate models (analysis not shown) indicated that just over half of the difference between the single-year and 2-year panel results was due to the additional controls for food security status in Year 1 and changes in employment and household structure from Year 1 to Year 2. The remaining difference was due to the restriction of the sample to households that received SNAP in Year 1. That is, the association of better food security with remaining on SNAP was greater for longer-term SNAP recipients. None of the difference was due to non-random sample loss in the matched 2-year panel data.
As in the single-year sample, the associations were stronger for those that received large SNAP benefits (Table 2, model 4). The odds of very low food security late in Year 2 were 66 % lower among households that remained on SNAP than among SNAP leavers (OR = 0·342, P < 0·001). In spite of the statistical significance of this result, however, it should be interpreted cautiously because the number of SNAP leavers in the sample was small (n 109). The results are consistent with the expectation that effects of SNAP on food security should be greater among those who receive a relatively large benefit than among those receiving smaller benefits, but do not provide a very precise estimate of the extent of the difference.
Discussion and conclusions
The associations between very low food security and continued SNAP participation among households that participated in SNAP at some time during the year provide suggestive evidence of a sizeable positive effect of SNAP in improving food security. Interpreting as causal the lower odds of very low food security associated with continued SNAP participation – 28 % in the single-year sample and 45 % in the 2-year panel sample – is reasonable because it is likely that some offsetting self-selection bias remains, with the result that the associations actually understate the ameliorative effect. That is, more food-needy households are less likely to exit the programme, and this tendency is not fully accounted for by characteristics included in the multivariate models. Based on characteristics for which data are available in the CPS-FSS, households that remain on SNAP have considerably lower income and less favourable employment conditions than those that leave(Reference Nord and Coleman-Jensen15). Given this strong self-selection of more needy households into the programme based on observables, it is likely that self-selection on factors not observed are in the same direction.
For those receiving large SNAP benefits, the associations were stronger, consistent with expectations. Receipt of relatively small SNAP benefits may not increase households’ total food spending much, because they may shift some spending from their non-SNAP resources away from food. Households that receive large SNAP benefits, on the other hand, generally have few other resources, and their food spending may depend heavily on the SNAP benefits.
The stronger results in the 2-year panel analysis, which controlled for the severity of food insecurity in Year 1, provide further evidence for self-selection on unobserved variables in the single-year sample. Controlling for food insecurity in Year 1 accounts for some of the factors that may be related both to continued programme participation and food security in Year 2, thus reducing the effect of self-selection on the results. Thus, the 45 % lower odds of very low food security associated with remaining on SNAP v. leaving SNAP in the 2-year panel analysis may be considered the best estimate from the present study of the extent to which the programme alleviates this severe level of food insecurity for SNAP participants. The panel results may still understate the ameliorative effect of SNAP, but to a lesser extent than the single-year results.
A 45 % reduction in odds, given the observed prevalence of very low food security among SNAP recipients of about 15 %, corresponds to a reduction in the prevalence rate of 38 %. This is consistent with the estimate of 30–50 % from the strongest of the longitudinal models(Reference DePolt, Moffitt and Ribar6), and consistent with, or somewhat larger than, the estimate of 20 % from the strongest simultaneous equation and instrumental variable models(Reference Ratcliffe and McKernan11), and the estimate of ‘one-third’ by Nord and Golla(Reference Nord and Golla7) based on month-by-month rates of very low food security around the time of beginning a SNAP spell. The convergence of results from these various methodologies increases confidence that the ameliorative effect of SNAP is in the range of 20–50 %, and likely toward the high end of that range since there is little reason to expect the results from the current study to overstate the effect and some reason to expect the opposite.
The main limitation of the study is that it assumes the direction of net uncontrolled selection effects – i.e. that more food-needy households are less likely to leave the programme net of observed differences. Further light on the extent to which that key assumption is justified could be shed by replicating these ‘SNAP leaver’ models using instrumental variable models similar to those used in earlier ‘SNAP participation’ models(Reference Yen, Andrews and Chen10, Reference Ratcliffe and McKernan11).
The decade-long effort by researchers to estimate the effect of the US SNAP/Food Stamp Program on food security illustrates the difficulties of evaluating an entitlement programme in which participation is voluntary. The self-selection bias creates formidable, nearly intractable problems. Yet, triangulation across results from multiple methods may finally provide a consensus estimate of the size of the programme effect.
Acknowledgements
The views expressed are those of the author and may not be attributed to the United States Department of Agriculture or the Economic Research Service. The author conducted the research as part of his official duties as an employee of the Economic Research Service, an agency of the United States Department of Agriculture. No outside funding was received, and the author has no conflicts of interest.


