


Non-technical Summary
Over the past half century, paleobiologists have made strides in understanding how fossil organisms are evolutionarily related to one another, which in turn allows us to ask more complex questions about evolution in geologic time. We focus on three groups of fossil echinoderms, the phylum that includes sea stars and sea urchins, to test hypotheses of evolutionary relationships, timings of different groups’ first appearances, and rates of evolution of different parts of the body in these three groups (Diploporita, Eublastoidea, and Paracrinoidea). We use statistical models to test these hypotheses and to test the effect that different models within these two larger categories have on the resulting data. Overall, the evolutionary trees inferred in this study largely agree with previously published trees. We also found that rates of evolution of the body were largely similar across the three groups, with some exceptions. Our work also revealed that the estimated time of group origins was strongly affected by the type of model we used; thus, it is important to use care when selecting models for these types of analyses.
Introduction
Over the past half century, paleobiologists have endeavored to mathematically estimate the evolutionary relationships of extinct life. Phylogenetic frameworks enable researchers to explore and evaluate complex ecological and evolutionary patterns in deep time. The increased, targeted effort to produce species-level tree topologies has promoted the use of new technologies and methodologies for examining and evaluating new and outstanding questions in paleobiology. This work builds upon previous studies by employing robust phylogenetic estimations, estimating divergence times, and evaluating character evolution within three clades of blastozoan echinoderms.
In recent decades, blastozoan echinoderms, a group of extinct stemmed echinoderms that spanned the Paleozoic Era (541–251 Ma) have received a significant amount of work surrounding homology (e.g., David and Mooi Reference David, Mooi, Mooi and Telford1998; Sumrall and Waters Reference Sumrall and Waters2012; Kammer et al. Reference Kammer, Sumrall, Zamora, Ausich and Deline2013; Sumrall et al. Reference Sumrall, Sheffield, Bauer, Thompson and Waters2023), phylogeny (Paul Reference Paul, Paul and Smith1988; Nardin and Bohatý Reference Nardin and Bohatý2012; O’Malley et al. Reference O’Malley, Ausich and Chin2016; Paul and Rozhnov Reference Paul and Rozhnov2016; Zamora et al. Reference Zamora, Sumrall, Zhu and Lefebvre2017; Bauer et al. Reference Bauer, Sumrall and Waters2018, Reference Bauer, Waters and Sumrall2020; Nohejlová et al. Reference Nohejlová, Nardin, Fatka, Kašička and Szabad2019; Sheffield and Sumrall Reference Sheffield and Sumrall2019a,Reference Sheffield and Sumrallb; Limbeck et al. Reference Limbeck, Bauer, Deline and Sumrall2024), biogeography (Nardin and Lefebvre Reference Nardin and Lefebvre2010; Bauer Reference Bauer2021; Lam et al. Reference Lam, Sheffield and Matzke2021; Sheffield et al. Reference Sheffield, Lam, Phillips and Deline2022a), and biological function (e.g., respiration and motion; Sheffield et al. Reference Sheffield, Limbeck, Bauer, Hill and Nohejlová2022b; Desatnik et al. Reference Desatnik, Patterson, Gorzelak, Zamora, LeDuc and Majidi2023), although many questions still remain about their evolutionary history, as their phylogenetic histories have not yet been resolved. Conflicts in estimated phylogenies in the studies listed suggest that character development is variable and that our understanding of homologous elements within and across groups still requires further study. There are particular issues concerning echinoderms that represent one aspect of a more general issue with both methodological and theoretical implications: do different functional systems in organisms evolve at the same general rates? The ability to test for and accommodate rate variation among different suites of characters associated with different biological functions can provide means of testing more particular hypotheses about both driving and limiting factors in the evolution of complex organisms. In this work, we explore how the rate of evolution differs among functional character suites in terms of both the relative rates among different types (partitions) of characters and the clock rates (in expected changes per unit time) of those characters.
Numerous prior studies have examined evolutionary rates of change in extinct echinoderm clades. Novack-Gotshall et al. (Reference Novack-Gottshall, Sultan, Smith, Purcell, Hanson, Lively and Ranjha2022) found that different traits evolve at varying rates (e.g., feeding characters may evolve at faster rates); the idea that functional traits, such as those involved in feeding, might evolve more quickly than others is something that has been documented in Echinodermata (Foote Reference Foote1995; Ciampaglio Reference Ciampaglio2002; Hopkins and Smith Reference Hopkins and Smith2015; Wright Reference Wright2017) and broader Animalia as well (Wagner Reference Wagner1995; Sánchez-Villagra and Williams Reference Sánchez-Villagra and Williams1998). Deline et al. (Reference Deline, Thompson, Smith, Zamora, Rahman, Sheffield, Ausich, Kammer and Sumrall2020) found that some body plan characters showed higher flexibility with regard to evolutionary change than others. Little work has been done to comprehensively evaluate suites of characters that may be influencing the rates of others. Here, we explicitly test whether evolutionary rate differences can be detected from a background rate of evolution in the character model using among-character rate variation (ACRV) or whether this is the domain of the clock model.
Herein, we utilize three blastozoan echinoderm groups—Diploporita, Eublastoidea, and Paracrinoidea—to explore rates of evolution within and across each group. Characters from across the organisms were grouped into specific character suites (e.g., oral plates) to explore different models of evolution via these character parameters. To accomplish this, we employed a reversible jump Markov chain Monte Carlo (rjMCMC) approach, which has been suggested to be less biased for model selection in the case of complex models (May and Rothfels Reference May and Rothfels2023). This adaptation of the MCMC algorithm allows for the number of parameters to change throughout an analysis, and as such, the model itself is a random variable, allowing the data to drive the model choice during the phylogenetic estimation. The three blastozoan groups used herein span a broad range of temporal and geographic distributions and also have distinct morphological body plans (short-lived to long-lived and geographically restricted to widespread) as well as ranges in taxonomic stability (e.g., many aberrant morphologies are seen in Paracrinoidea, while Eublastoidea are morphologically conserved; Fig. 1). These differences in their timing, geographic shifts, and morphological patterns allow for a comprehensive comparison of changes in evolutionary rates across each of the three groups during its temporal distribution in the Paleozoic. Additionally, we explore the effects that these model choices have on resulting tree topologies for each of the three blastozoan groups.
Representative taxa within Diploporita, Eublastoidea, and Paracrinoidea. A, Oral view of Haplosphaeronis sp. (GIT 540-3; modified from Sheffield and Sumrall Reference Sheffield and Sumrall2019a), a sphaeronitid diploporan. B, Lateral view of Haplosphaeronis sp. (GIT 540-3; modified from Sheffield and Sumrall Reference Sheffield and Sumrall2019a). C, Oral view of Nucleocrinius obovatus (UMMP 1262). D, Lateral view of N. obovatus (UMMP 1262). E, Oral view of Canadocystis tennesseensis (USNM 241272; modified from Limbeck et al. Reference Limbeck, Bauer, Deline and Sumrall2024). F, Lateral view of C. tennesseensis (USNM 241272; modified from Sheffield et al. Reference Sheffield, Limbeck, Bauer, Hill and Nohejlová2022b). Anatomical features shared across the three groups are annotated as follows: A, ambulacra; P, peristome; G, gonopore; H, hydropore; PP, periproct; OS, oral surface; RS, respiratory structures; AS, attachment surface. Scale bars, 10 mm. Specimens whitened with ammonium chloride sublimated. Alternative text is provided for all figures in this paper in Supplementary File 1.

Blastozoa as a Model System
Blastozoan echinoderms represent a morphologically diverse and disparate group of extinct echinoderms, ranging from the early Cambrian through the late Permian (Sprinkle Reference Sprinkle1973; Sheffield et al. Reference Sheffield, Limbeck, Bauer, Hill and Nohejlová2022b). Within Blastozoa are several taxonomic classes, each of which exhibits distinct geographic and temporal patterns, as well as speciation patterns. There has been a long history of compiling evolutionary histories of subclades within Blastozoa using hypotheses of homology (e.g., Mooi et al. Reference Mooi, David, Marchand, David, Guille, Feral and Roux1994; Sumrall and Waters Reference Sumrall and Waters2012). Recently, the long history of blastozoan respiratory structures has been reviewed (Sheffield et al. Reference Sheffield, Limbeck, Bauer, Hill and Nohejlová2022b), along with a detailed study on homology across clades within Echinodermata (Sumrall et al. Reference Sumrall, Sheffield, Bauer, Thompson and Waters2023). Homology among blastozoan groups has long been challenging due to a lack of modern relatives and high levels of diversity among and between clades; however, the designation of major plate types and function has been determined for decades (Beaver Reference Beaver, Ubaghs and Moore1968; Sprinkle Reference Sprinkle1973).
Recent phylogenetic studies indicate that echinoderm evolution has been heavily influenced by convergence (e.g., Deline et al. Reference Deline, Thompson, Smith, Zamora, Rahman, Sheffield, Ausich, Kammer and Sumrall2020), and phylogenetic studies of blastozoans have indicated that these group-defining respiratory types are likely convergent as well, masking the group’s true evolutionary patterns (Paul Reference Paul1968, Reference Paul, Paul and Smith1988; Sumrall and Sprinkle Reference Sumrall and Sprinkle1995; Sumrall and Gahn Reference Sumrall and Gahn2006; Sumrall Reference Sumrall, Harris, Böttger, Walker and Lesser2010; Sumrall and Waters Reference Sumrall and Waters2012; Sheffield and Sumrall Reference Sheffield and Sumrall2019a,Reference Sheffield and Sumrallb). Beyond that, early Paleozoic mass extinctions (end-Ordovician and end-Devonian) removed intermediate forms, which in turn elevated the disparity among blastozoan taxa by increasing average pairwise dissimilarities (see Foote Reference Foote, Jablonski, Erwin and Lipps1996; Deline et al. Reference Deline, Greenwood, Clark, Puttick, Peterson and Donoghue2018, Reference Deline, Thompson, Smith, Zamora, Rahman, Sheffield, Ausich, Kammer and Sumrall2020; Sheffield et al. Reference Sheffield, Limbeck, Bauer, Hill and Nohejlová2022b), and it has been challenging to clearly pinpoint exactly where and how this convergence occurred, although some parts of the echinoderm body plan seem to show higher convergence than others (e.g., respiratory structures, as discussed earlier; ambulacral grooves). For example, the plesiomorphic condition for ambulacral arrangement within blastozoans exhibits 2-1-2 symmetry (Sprinkle Reference Sprinkle1973; Fig. 1A). Ambulacral arrangement can be used to identify adult body axes and body symmetry in echinoderms, so changes to these arrangements can be informative to how novel body plans evolve through time (Sumrall and Wray Reference Sumrall and Wray2007). Modifications to this plan include paedomorphic ambulacral reduction (PAR), in which specific ambulacra are lost in varying stages of heterochronic paedomorphosis (McKinney and Sumrall Reference McKinney and Sumrall2011), seen in many groups of blastozoans, pseudo-fivefold symmetry, such as is often seen in Eublastoidea, and true fivefold symmetry associated with modern eleutherozoans (e.g., echinoids) today. Each of the three groups studied here shows distinct ambulacral symmetry arrangements—with diploporans most often having 2-1-2 symmetry and five developed rays, paracrinoids showing clear PAR and often bearing two rays, and eublastoids having pseudo fivefold symmetry, although there are exceptions in each of these clades.
In addition to the convergence seen in echinoderm morphologies that diminishes the ability to use these features to define groups, a separate problem arises from the possibility that different suites of blastozoan characters have different associations with functional biology and/or are tied to different modules with different degrees of integration (e.g., see Goswami et al. Reference Goswami, Smaers, Soligo and Polly2014). Therefore, characters might not evolve at the same rates due to different levels of intrinsic constraints and extrinsic selective pressures (Ciampaglio Reference Ciampaglio2002; Novack-Gottshall et al. Reference Novack-Gottshall, Sultan, Smith, Purcell, Hanson, Lively and Ranjha2022).
Materials and Methods
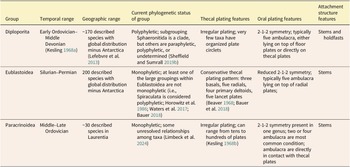
Recent work supports variation in rates of evolution of echinoderm traits (Novack-Gottshall et al. Reference Novack-Gottshall, Sultan, Smith, Purcell, Hanson, Lively and Ranjha2022). In prior work, it has been hypothesized that “functional” traits like feeding characters may evolve at faster rates than other traits, a hypothesis not limited to echinoderms (e.g., Foote Reference Foote1995; Ciampaglio Reference Ciampaglio2002; Hopkins and Smith Reference Hopkins and Smith2015; Wright Reference Wright2017), but seen in animals in general (Wagner Reference Wagner1995; Sánchez-Villagra and Williams Reference Sánchez-Villagra and Williams1998). The morphological diversity seen in blastozoan echinoderms has frequently hindered our abilities to establish homology among characters, let alone examine rates of evolution. However, with the development of echinoderm-specific homology schemes that can be applied to blastozoan groups, the extraxial-axial theory (EAT) and the universal elemental homology hypothesis (UEH) (Mooi and David Reference Mooi, David, Waters and Maples1997; Sumrall Reference Sumrall, Harris, Böttger, Walker and Lesser2010), these rates of evolution questions can be addressed. Both homology schemes have strengths and weaknesses (Sumrall et al. Reference Sumrall, Sheffield, Bauer, Thompson and Waters2023), but because this particular study is focused on Paleozoic blastozoans and the modeling of morphological shifts of the oral and ambulacral systems, the morphological character datasets utilized in this particular study (i.e., Sheffield and Sumrall Reference Sheffield and Sumrall2018; Bauer Reference Bauer2020; Limbeck et al. Reference Limbeck, Bauer, Deline and Sumrall2024) were developed predominantly using UEH with some influence from EAT. We explored anatomical subunit partitioning in this study using three groups of blastozoans, each of which is variable in its temporal and geographic patterns and in its body plans (Table 1). Each of these groups—Eublastoidea (Bauer Reference Bauer2021), Diploporita (Sheffield and Sumrall Reference Sheffield and Sumrall2019a), and Paracrinoidea (Limbeck et al. Reference Limbeck, Bauer, Deline and Sumrall2024)—was the subject of recently published phylogenetic analyses from which we have pulled character data to build the models tested herein. These datasets range from 25 to 30 taxa and around 40 to 50 characters, with the paracrinoids being slightly smaller with 38 characters. This is fairly typical for paleontological datasets (Barido-Sottani et al. Reference Barido-Sottani, Van Tiel, Hopkins, Wright, Stadler and Warnock2019).
Blastozoan groups included in this study with details regarding their temporal and geographic ranges, phylogenetic status, and the defining features of the body for Diploporita, Eublastoidea, and Paracrinoidea.

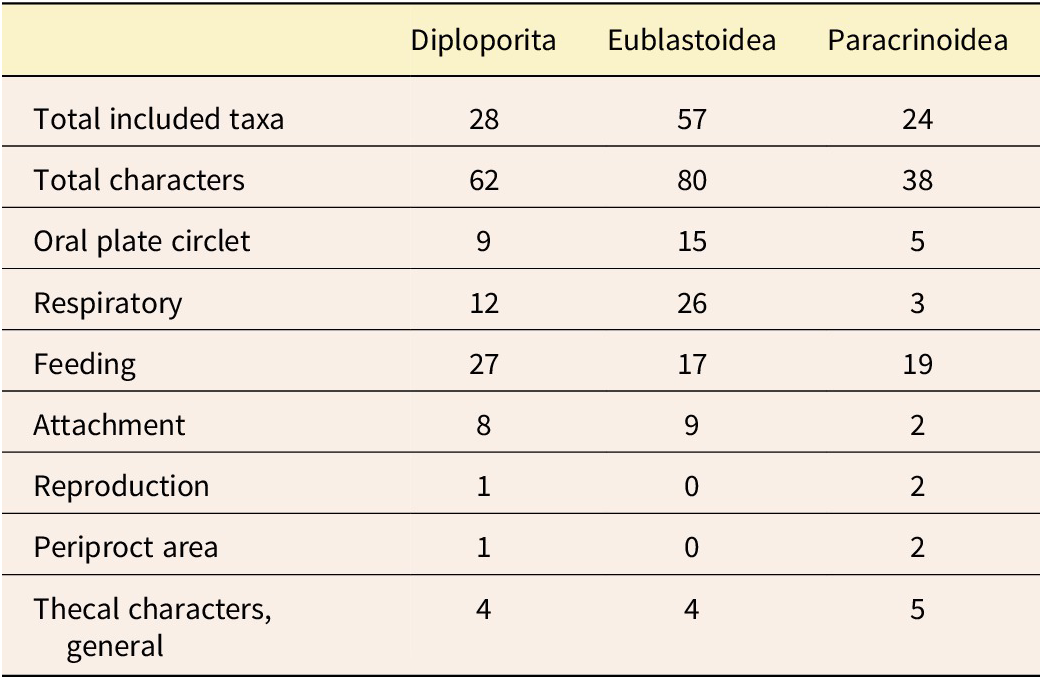
Character groups representing specific character suites were used to partition the data in downstream analyses. The three character matrixes (Table S1) were compiled separately for different studies, so for this work, the types of characters were considered and grouped based on current understanding of Paleozoic echinoderm biological function and current understanding of homology. The seven anatomical character groups are: (1) respiratory: characters that are describing part of the respiratory structures; (2) oral plate circlet: characters that include the plates from the oral plate circlet series as defined in Sumrall and Waters (Reference Sumrall and Waters2012); (3) feeding: characters related to the ambulacral and brachiolar structures; (4) periproct area: characters related to the anus opening and plates of the anal area; (5) reproduction: characters related to the gonopore (i.e., the genital pore); (6) theca: characters that broadly represent the thecal body and do not fall into the other assigned character groups; and (7) attachment structure: characters related to the stem or holdfast (Table 2; refer to Fig. 1 for examples of these characters for each set). These seven groups reflect the biological function of these echinoderms and were carefully considered to reflect the homology schemes described earlier.
Summary of the included taxa, characters, and character groups. For full details of the characters for each of the three groups, see Supplementary Table S1.
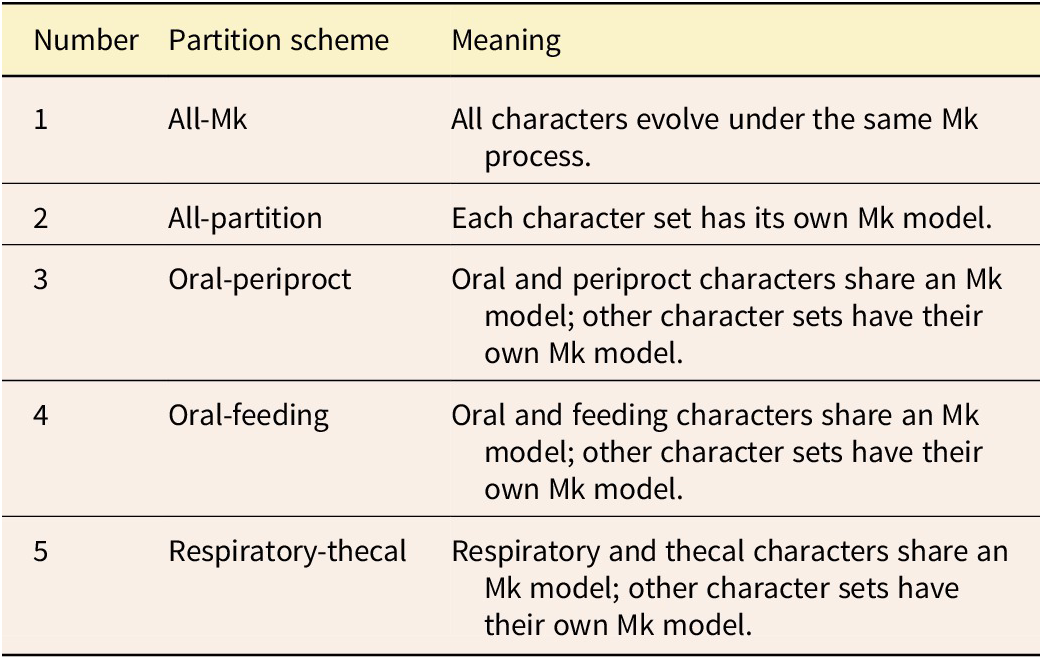
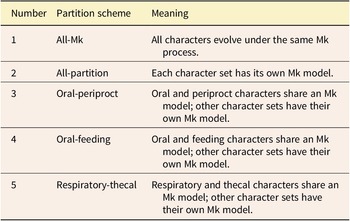
Partition models differ in the number of transition rate models applied to the data. Here, we use the Mk model (Lewis Reference Lewis2001) for those transition rates. In our partitioned models, the most complex model was every character set having its own Mk model. Under the least complex model, one Mk model applied to all characters. We also examined models of intermediate complexity in which some character sets were grouped, while others were allowed to be independent (see Table 3 for a full accounting of models). It should be noted that in the grouped character models, such as oral-periproct (Table 3, row 3), the assumption is that shared evolutionary forces are shaping those characters in a different way than other character sets. Likewise, the all-partition model models the hypothesis that each character set has its own evolutionary model. Note that the single Mk model would represent the “null hypothesis” under classical hypothesis testing scenarios, because it is the simplest possible model here.
Character partitioning schemes tested in this study. All-Mk is included as a null model; it implies all characters evolve under the same evolutionary process. All-partition is the most complex model, implying each anatomical subpartition has its own model of evolution.
Models of Character Evolution
A core goal in this study is to examine whether the rjMCMC algorithm can be used to efficiently compare different hypotheses about character evolution. As noted earlier, the rjMCMC is an adaptation of the MCMC algorithm that allows for the number of parameters to change throughout an analysis. In this type of analysis, the model itself is a random variable. For example, in Supplementary Table S2, you will note that some skyline models have more categories than others. In the case of adding a category, this means (minimally) adding three additional parameters—new speciation, extinction, and fossil sampling rates. In a traditional MCMC, the number of parameters cannot be varied in an analysis. Thus, in an MCMC, a model must be chosen before running a phylogenetic estimation. In the case of rjMCMC, the model can be evaluated alongside the model parameters, effectively performing model selection at the same time as tree estimation.
Following the completion of each run, R was used (v. 4.1.2; R Core Team 2022) to summarize the rjMCMC. The proportion of time that the MCMC chain spent with a given model is a proxy for its posterior probability. Traditional model selection tools, such as the Bayes factor, evaluated against the Kass and Raftery (Reference Kass and Raftery1995) significance scale, can be used to establish whether any one model is significantly better than another. A standard MCMC analysis is run until the analysis reaches what is termed “convergence.” For example, a time when the MCMC analysis reaches a target distribution, which can be thought of as an optimal solution, and is simply sampling small variations around it. In an rjMCMC estimation, convergence for both the model and the model parameters is needed. Based on our preliminary explorations, this takes longer than simple convergence for model parameters. As such, each estimation was run for approximately 1 million generations in RevBayes, with some estimations finishing earlier. Convergence (defined as ESS [evolutional stable strategy] > 200) was checked in Tracer (Rambaut et al. Reference Rambaut, Drummond, Xie, Baele and Suchard2018). We summarized each phylogenetic tree using a maximum clade credibility tree and summarized parameter distributions in R (Tribble et al. Reference Tribble, Freyman, Landis, Lim, Barido‐Sottani, Kopperud, Hӧhna and May2022).
Partitioning by anatomical subregion is a becoming more common in morphological phylogenetics (Clarke and Middleton Reference Clarke and Middleton2008; Close et al. Reference Close, Friedman, Lloyd and Benson2015; Simões and Pierce Reference Simões and Pierce2021; Casali et al. Reference Casali, Freitas and Perini2023), as is applying different models of character evolution to different characters (e.g., Hooker Reference Hooker2014). This allows us to test relevant preexisting hypotheses generated by functional biological theory and evolutionary–developmental theory about evolutionary flexibility among different parts of organisms (Wright et al. Reference Wright, Wagner and Wright2021). We use the novel rjMCMC approach to evaluate support between five different character models. These models include a basic Mk model (Lewis Reference Lewis2001), in which all characters are evolving under the same set of assumptions. The other four models all involve some anatomical subunit partitioning, as described earlier.
Aside from the character partitions outlined in Table 3, all phylogenetic models also used ACRV (Yang Reference Yang1994) to allow for individual characters having different rates of evolution without assuming a particular “high” or “low” rate for each character a priori. In one set of analyses, rates of evolution via the clock model were linked across partitions. In a second set of estimations, the rates of morphological evolution were unlinked between partitions, thus allowing each module of characters to have its own evolutionary rate.
Phylogenetic Analyses
Fossilized birth–death (FBD) analyses require upper and lower bounds on the possible first appearances of analyzed taxa in order to calculate the prior probabilities and likelihoods on phylogenies. For example, a blastozoan taxon first appearing within the Belodina compressa conodont zone of North America might have a first appearance ranging from 455.2 to 454.2 Ma (Gradstein et al. Reference Gradstein, Ogg, Schmitz and Ogg2020). However, we almost never know exactly how old that first occurrence is within that 1 Myr range; assuming the youngest date allows 1 million more years to accumulate change but also requires an additional million years without generating any sampled specimens or subsequently sampled sister-clades; assuming the youngest date does the opposite. Thus, the dates used can have important effects on the posterior probabilities of phylogenies and character evolution models (Barido-Sottani et al. Reference Barido-Sottani, Van Tiel, Hopkins, Wright, Stadler and Warnock2019). Therefore, these first appearance ages are one of the parameters varied in our analyses. (Note that the “true” age of a species’ oldest find(s) is a separate issue from the true origination time of that species, which the first appearance will always underestimate.) We set the upper and lower bounds of possible first appearance ages using data from the Paleobiology Database (PBDB) to identify the possible oldest occurrences for each analyzed taxon and the range of plausible dates for those occurrences. None of the ages used are based on single fossil specimens; they are based on all published documentation of a particular taxon (in this case, species). Because the ages provided by the PBDB are fairly general, we use a separate dataset (see Congreve et al. Reference Congreve, Patzkowsky and Wagner2021) to provide more restricted ranges based on conodont, graptolite, and ammonoid biozonations and the Gradstein et al. (Reference Gradstein, Ogg, Schmitz and Ogg2020) timescale. The relevant data reflect 312 blastozoan occurrences from the PBDB, which come from 241 localities and 117 rock units combined with currently accepted opinions given 274 entered opinions. Note that the latter include the opinions of the relevant authors of this paper. A total of 178 published works contributed to the data used by this study; the works contributing the 10 most occurrences and taxonomic opinions include: Frest et al. (Reference Frest, Brett, Witzke, Boucot and Lawson1999), Regnéll (Reference Regnéll1945), Parsley and Mintz (Reference Parsley and Mintz1975), Fay (Reference Fay1961), Bassler and Moodey (Reference Bassler and Moodey1943), Macurda (Reference Macurda1983), Fay et al. (Reference Fay, Graffham, Sprinkle and Sprinkle1982), Wilson (Reference Wilson1946), Krivicich et al. (Reference Krivicich, Ausich and Meyer2014), Paul (Reference Paul1971), and Bauer (Reference Bauer2018).
We performed our phylogenetic analyses in RevBayes (v. 1.2.1; Höhna et al. Reference Höhna, Landis, Heath, Boussau, Lartillot, Moore, Huelsenbeck and Ronquist2016). We estimated dated phylogenetic trees using the FBD model (Heath et al. Reference Heath, Huelsenbeck and Stadler2014). Under the FBD, it is assumed that the tree can be then described by five core parameters: origin time, speciation, extinction, fossil sampling rate, and extant sampling probability. We identified reasonable priors on these parameters using values from Wright et al. (Reference Wright, Wagner and Wright2021). We also tested whether a time-homogeneous FBD process was a good descriptor of our data, or whether a skyline model would be appropriate. In a skyline model, the rates of speciation, extinction, and sampling may change between time intervals. This may be expected if different geologic periods present different selective pressures.
We additionally ran the analyses under the prior. This refers to running the analysis without the data, such as the age information. This can help researchers spot whether the prior is behaving as expected, and to what degree the choice of priors influences an analysis.
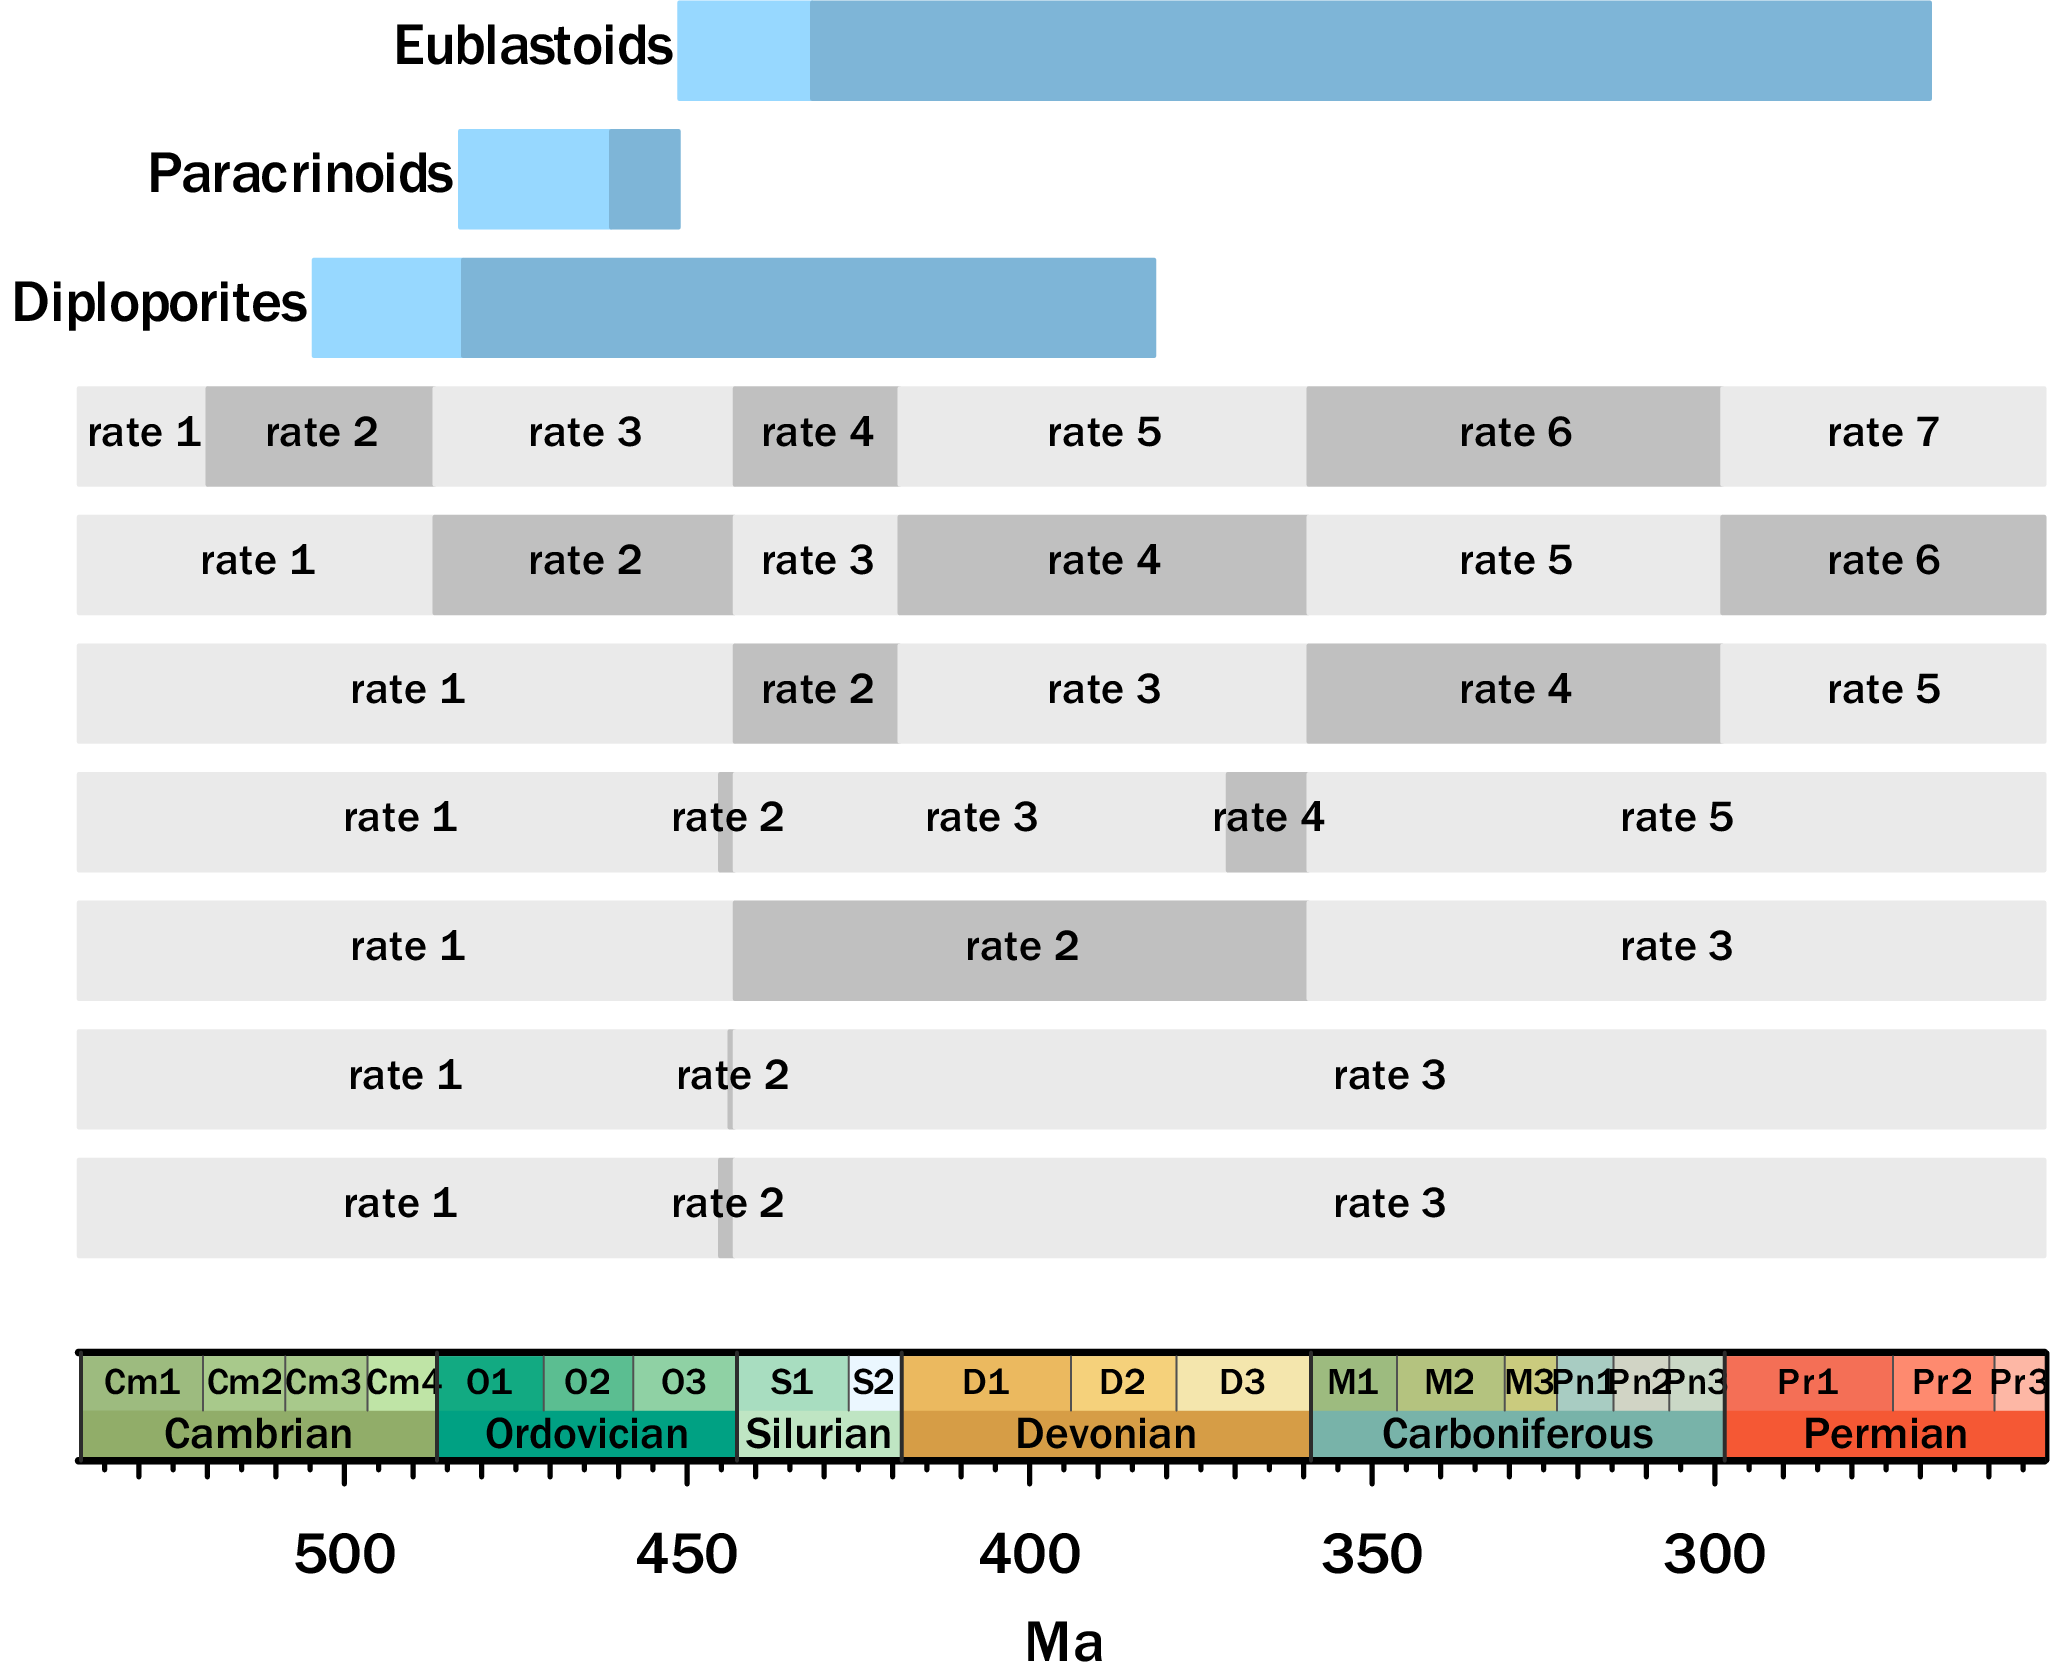
For the skyline models, we tested several hypotheses about rates over time. For example, in some models, we tested whether there might be shifts in the core FBD parameters after the major mass extinctions during the duration of these organisms’ stratigraphic ranges. A description of all the FBD skyline models tested can be seen in Figure 2 and Supplementary Table S2. Note that because the paracrinoids have strongly limited sampling (restricted to the Ordovician), we only tested the time-homogeneous and the skyline models. The “null” model posits no rate shifts over the clades’ histories. For the longer-ranging clades of diploporans and eublastoids, the following alternative models include: (1) rate shifts at the end-Ordovician and end-Devonian (i.e., two of the “big five” mass extinctions sensu Raup and Sepkoski [Reference Raup and Sepkoski1982]); (2) a two-phase shifting of rates at the onset and then end of the Hirnantian (latest Ordovician, during the multiphased Late Ordovician Mass Extinction [LOME]), a global glaciation and subsequent rapid warming (see Brenchley et al. Reference Brenchley, Carden, Hints, Kaljo, Marshall, Martma, Meidla and Nõlvak2003); (3) a two-phase shifting of rates for both the end-Ordovician and end-Devonian, with rates at the onset and end of both the Hirnantian and Famennian (capturing the multiphase LOME and the two-stage biodiversity crisis across the latest Devonian, the Frasnian/Famennian boundary; see e.g., Stigall Reference Stigall2010); (4) unique rates to each period (Ordovician, Silurian, Devonian, and Carboniferous), capturing the distinct biodiversity patterns that occurred during each of these periods, all of which were preceded by an extinction event; (5) as in point 4, but also with a unique rate for the Cambrian (i.e., the Cambrian Explosion and subsequent biodiversity increases; see Briggs Reference Briggs2015); and (6) an “all-inclusive” model including shifts at all of the above points.
Skyline models with their associated date ranges according to the Gradstein et al. (Reference Gradstein, Ogg, Schmitz and Ogg2020) geologic timescale. The lighter blue represents the composite range of all the analyzed taxa, and the darker blue is the composite range of all of the in-group taxa. Different rates are elaborated on in Supplementary Table S2.

For our clock model (which describes variation in evolutionary rates over time and across the tree), we used an uncorrelated lognormal clock. Prior work in similar groups (Wright et al. Reference Wright, Wagner and Wright2021) has supported the use of this clock. We ran two types of estimations: linked clocks, in which each partition uses the same clock, and an unlinked clock, in which the character partitions all have their own morphological clocks. We also employed analyses assuming a time-homogeneous FBD model and an uncorrelated lognormal clock model. In these estimations, we treated all the anatomical partitions as separate, with their own clock rates, so that we could estimate precise morphological evolutionary rates per partition. Fossil age information was included as described earlier.
Results
General Model Selection Results
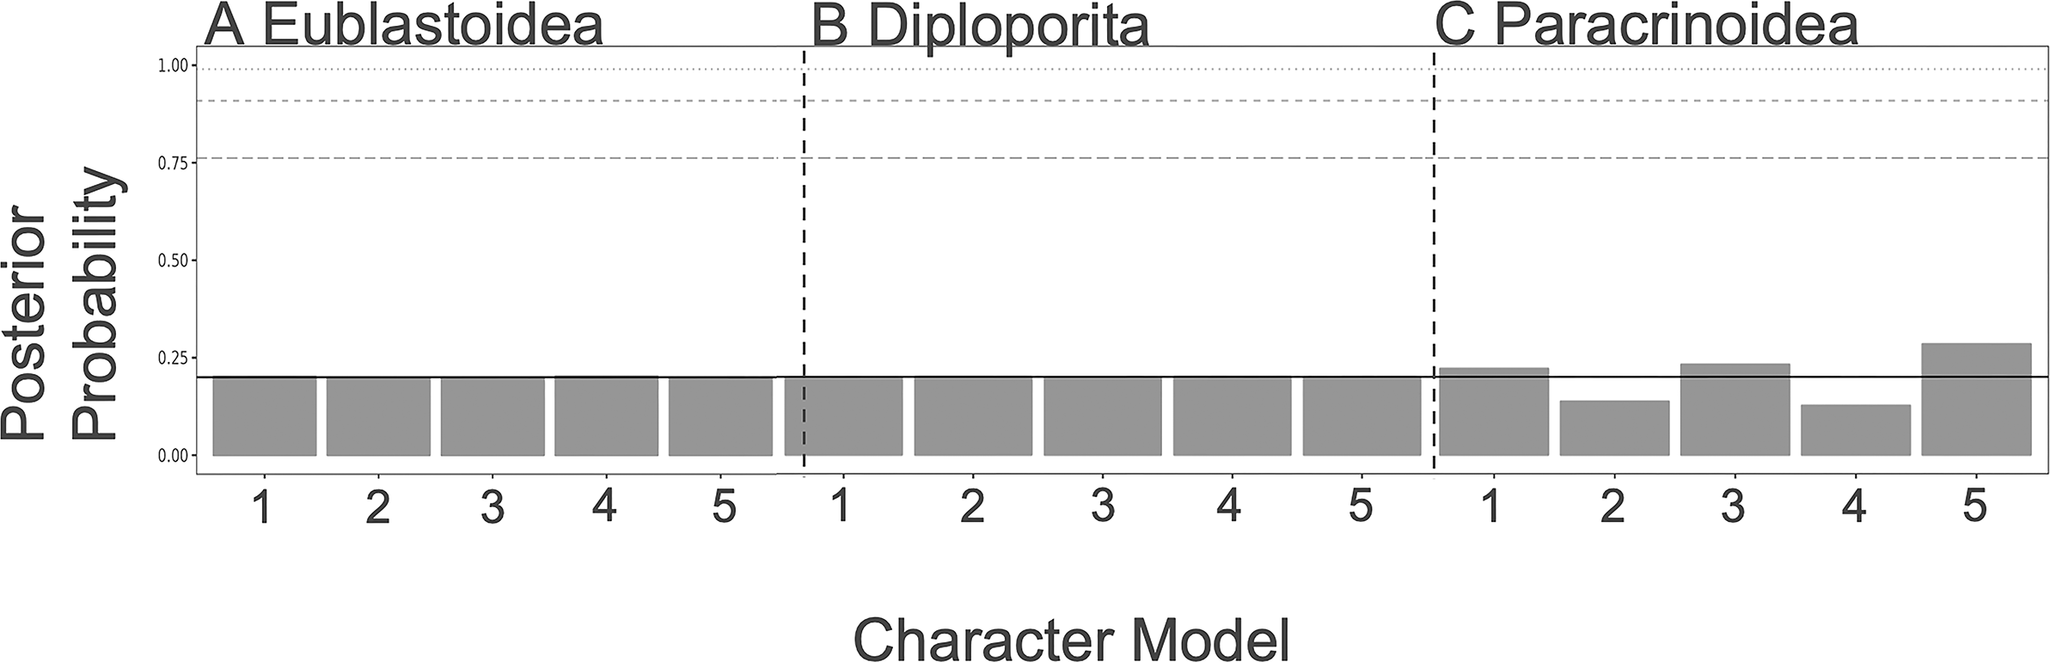
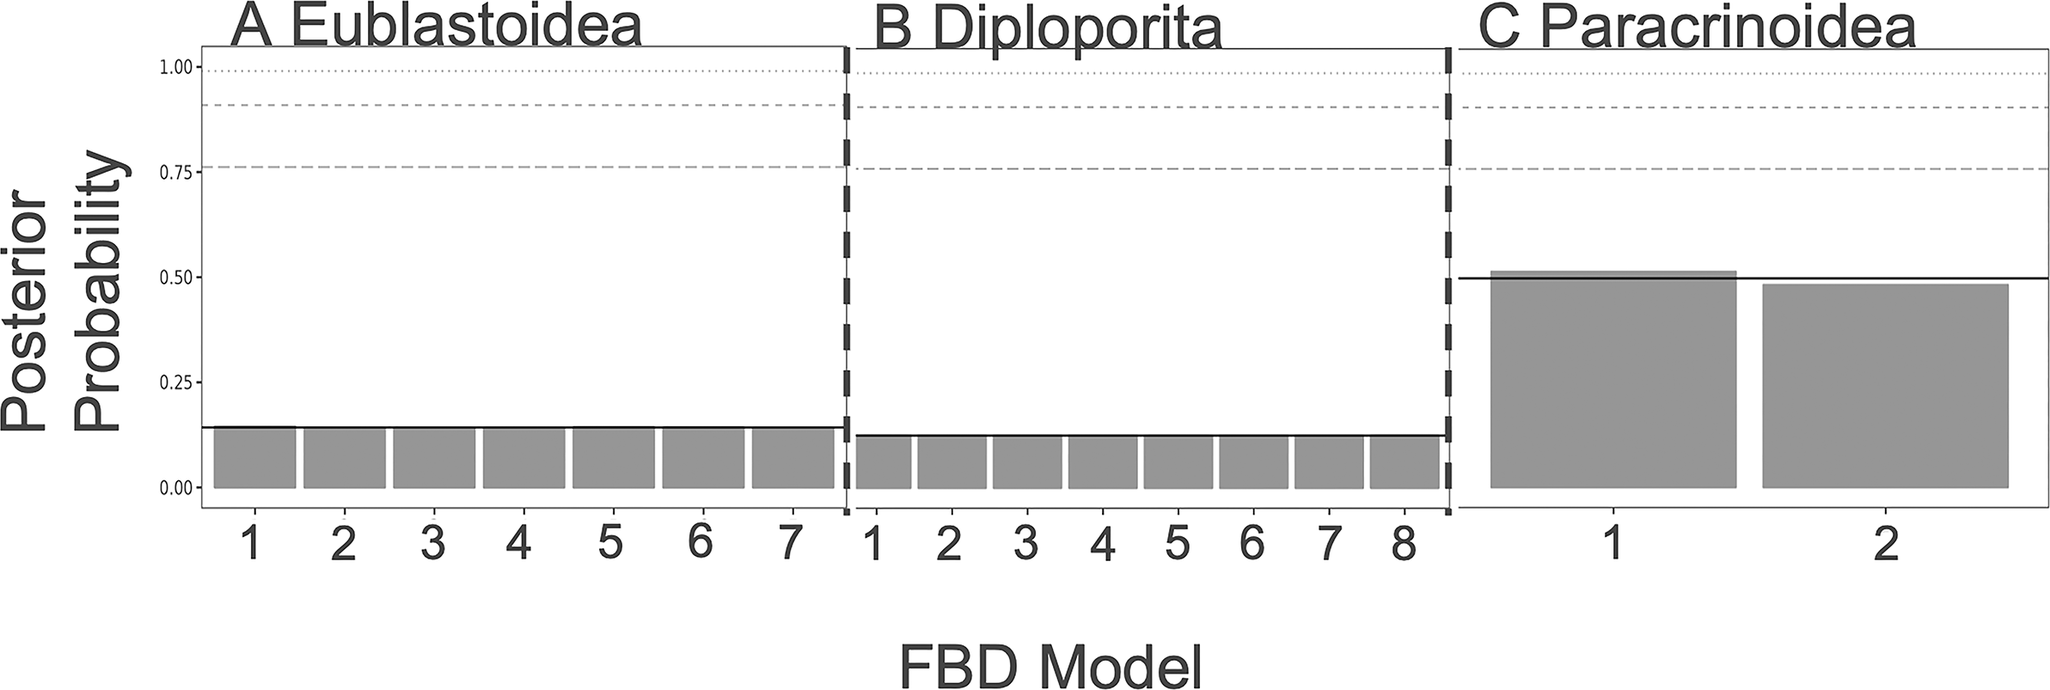
As shown in Figures 3 and 4, there is little resolution on the model choice for the FBD or character models. While the paracrinoids indicate some differential support for different character models (although none rise to the level of statistical significance), neither the eublastoids nor the diploporans do. Looking at the distributions of ACRV among partitions, there are no clear differences in character substitution rates among different modules of characters in any of the three taxa (Supplementary Fig. S1). All rates cluster around a value of 1, which corresponds to roughly one expected change per character (i.e., parsimony informativity). However, in the clock model, there is evidence for slightly elevated rates of evolution in attachment, respiratory, reproductive, and thecal characters of the Paracrinoidea (Supplementary Fig. S2). Additionally, posterior distributions on model type differed little from the prior (Supplementary Fig. S3).
Character model selection results from each group. For a summary of what each model represents, see Table 1. A, The models for diploporans show equivocal levels of support. B, The models for eublastoids show equivocal levels of support. C, Some of the models for the paracrinoids (i.e., respiratory, reproductive, and thecal characters) show slightly higher preferences.

Fossilized birth–death (FBD) model selection results from each group. For a summary of what each model represents, see Table 2. A, Diploporans show equivocal levels of support for all of the models. B, Eublastoids show equivocal levels of support for all of the models. C, Paracrinoids show slight preference for model 1 over model 2.

Diploplorita Phylogeny
The inferred tree topology that used an unlinked clock model (Fig. 5A) suggests an origin of the clade in the Furongian Epoch of the late Cambrian. The topology indicates that Sphaeronitida is not monophyletic, with Tristomiocystis, currently named a glyptosphaeritid, being rooted within the sphaeronitids. The holocystitids are supported as a clade in this topology. Rhombiferans and coronoids are supported as sister taxa within this topology. Diploporan Eumorphocystis has strong posterior support (poster probability = 0.77) as a sister taxon to crinoid Hybocrinus. Glyptosphaeritida is polyphyletic, with taxa named within it being scattered throughout the tree.
Inferred phylogenetic trees of Diploporita. Higher-level groupings are outlined at the operational taxonomic unit (OTU) nodes. A, The unlinked tree has an origination date in the Furongian (Cambrian), which is consistent with the fossil record. Most of the subgroups named in Diploporita represent monophyletic groups (asteroblastids are represented by one species, so this cannot be evaluated); this tree broadly matches the relationships that have been inferred in other phylogenetic analyses of this group. B, The unlinked tree has an origination date that is far older than the earliest known stereom, a synapomorphic trait of echinoderms, which is not in congruence with the fossil record. The relationships that are inferred here do not match relationships inferred in other groupings.

The inferred tree topology that used a linked clock model (Fig. 5B) returned a tree with a strong posterior probability (>0.99) of origins of the clade in the early Cambrian, within the Terreneuvian Epoch (= Cm1 in Fig. 5). This estimated phylogeny does not return most of the named groups within Diploporita as clades (asteroblastids are the exception, but they are represented by one species; thus, their relationships cannot be evaluated). A number of glyptosphaeritid taxa are nested within Sphaeronitida taxa This estimated phylogeny breaks up the genus Holocystites into a paraphyletic grouping. Rhombiferans and coronoids do not share a sister relationship, nor do Eumorphocystis and Hybocrinus. Parablastoid Eurekablastus, instead, is sister to crinoid Hybocrinus, and coronoid Stephanocrinus is sister to the parablastoid and crinoid.
Eublastoidea Phylogeny
The inferred tree topology (Fig. 6A) that used linked clock models for the character partitions in Eublastoidea suggested that with the proposed outgroup, the clade of Eublastoidea has a strong posterior probability of clade origins in the Ordovician. The topology presented does not support either Spiraculata or Fissiculata as functional clades and suggests many taxonomic groupings require additional consideration and redescription. The backbone of the tree topology is largely established by the beginning of the Devonian, with major groups being established, and subsequent diversification is at the lower taxonomic levels. The base of the tree topology is populated with Silurian fissiculate eublastoids as the sister group to the remaining operational taxonomic units (OTUs). Moving crownward, Nucleocrinida appears as a well-supported clade and as the sister group to the remaining OTUs. Next, Troosticrinus is separated out as the sister group to the remainder of the tree, which has several groupings of taxa from a variety of taxonomic groups. Other troosticrinids are grouping with pentremitid and granatocrinids with varying levels of posterior support. Cryptoschisma is positioned as the sister group to the remaining crown taxa. There is a large grouping of OTUs, mainly granatocrinids and pentremitids, and the crown-most group comprises the unusual Permian fissiculate specimens. There were several unusual instances noted regarding taxa placement within the tree. Specifically, the separation of two Deltoblastus species. One, D. permicus, was placed with the pentremitids, and the other (D. batheri) nested within other Permian taxa. Deltoblastus batheri was recovered as the direct ancestor to Pterotoblastus gracilis. These taxa are notably distinct and temporally and geographically restricted, whereas the two Deltoblastus species share many similarities within the coded character matrix, both of which brought into question the underlying structure of the tree. As such, we reassessed the tree using unlinked clock models for the character partitions (Fig. 6B). Generally, there is increased posterior support of the backbone of the tree compared with the previously described linked clock model tree. Unsurprisingly, the two Deltoblastus species were resolved as a sister group with high posterior support. There are several major differences in the backbone of the inferred topology using the unlinked clock model. Eublastoidea is still resolved as a well-supported clade, but there is a major separation of groups early on in the evolution of the clade, with one primarily being fissiculate species with Polydeltoideus at the base of the clade and then Troosticrinus at the base of the other clade. Pentremitids are now largely collated in one portion of the tree, whereas they were separated in the linked models. There is a large clade of granatocrinids and other very spherical eublastoid forms at the crown-most portion of the Troosticrinus clade. The Polydeltoideus clade represents mostly a grade of taxa until the crown-most group of taxa that is largely from Timor.
Inferred phylogenetic trees of Eublastoidea. Ordinal-level groupings following Waters and Horowitz (Reference Waters and Horowitz1993) and Macurda (Reference Macurda1983) are outlined at the operational taxonomic unit (OTU) nodes. A, The unlinked tree has an origination date in the Early Ordovician, congruent with the fossil record. Clades that have consistently been documented as monophyletic are also found here, specifically Nucleocrinida. Nearly all other ordinal groupings are not found to be monophyletic, but patterns are generally interesting, with high posterior probability on many groupings. B, The unlinked tree has an earlier origination date for the clade in the late Cambrian. The relationships inferred here generally follow previous work with several unusual exceptions that prompted further testing. Two Deltoblastus species were not found to be sister taxa, and one was estimated to be an ancestor to a very different taxon that essentially co-occurred.

Paracrinoidea Phylogeny
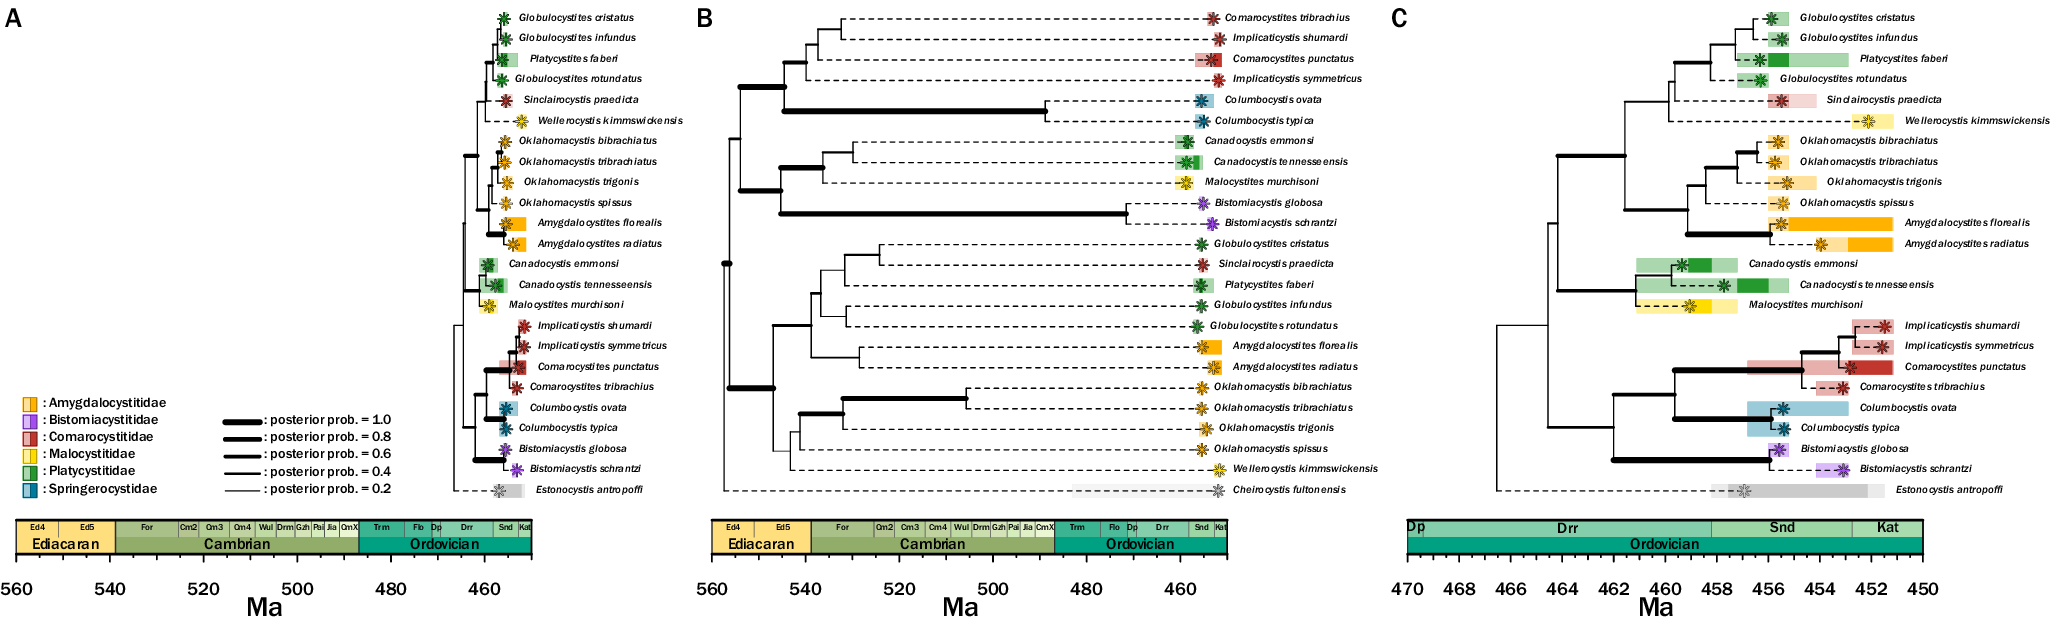
The inferred tree topology that used linked clock models for the character partitions (Fig. 7B) with the outgroup Cheirocystis fultonensis suggests a clade origination in the Precambrian. This topology does not support previously hypothesized subgroups Platycystitida and Comarocystitida, suggesting that taxonomy within paracrinoids requires revision. Two major groups are present in this tree hypothesis—one containing Amygdalocystites, Oklahomacystis, Platycystites, and Globulocystites, and the second containing Bistomiacystis, Comarocystites, Implicaticystis, and Columbocystis.
Inferred phylogenetic trees of Paracrinoidea. A, The unlinked clock model shows an origination date in the Ordovician. The groups within Paracrinoidea—comarocystitids and platycystitids—are not uncovered as monophyletic grouping. B, The linked clock model has an origination date in the pre-Cambrian, far earlier than the unlinked clock model. Similar to A, the two groups are not uncovered as monophyletic. C, The unlinked clock model is redrawn for clarity with a zoomed-in view of the Ordovician timescale.

Given the origination time estimated by the linked clock model, we also estimated a tree topology using an unlinked clock model (Fig. 7A,C) with the outgroup Estonocystis antropoffi. Seven branches with posterior probabilities of 0.5 or greater extend into the Darriwilian (Fig. 7C). Similar to the topology inferred by the linked clock model, this tree does not support previously hypothesized subgroups Platycystitida and Comarocystitida, and the same two major groups are present. However, the two main groups have experienced a nodal rotation, leading to an opposite tree arrangement. Beyond the change in origination time, the most notable difference in this topology compared with others is the inclusion of Canadocystis and Malocystites as sister taxa to the major subgroup that includes Amygdalocystites and Oklahomacystis.
Discussion
The phylogenetic relationships of Blastozoa have been long debated. Due to high levels of convergent evolution, a lack of agreement on homologous structures, heightened disparity across mass extinctions, taphonomic biases, and temporal biases, these relationships have been challenging to uncover (Zamora et al. Reference Zamora, Lefebvre, Àlvaro, Clausen, Elicki, Fatka and Jell2013; Sumrall and Waters Reference Sumrall and Waters2012; Deline et al. Reference Deline, Thompson, Smith, Zamora, Rahman, Sheffield, Ausich, Kammer and Sumrall2020; Sheffield et al. Reference Sheffield, Lam, Phillips and Deline2022a; Sumrall et al. Reference Sumrall, Sheffield, Bauer, Thompson and Waters2023). The results of the phylogenetic trees presented in this study indicate that much work still needs to be done. Within each of the three studied groups (i.e., paracrinoids, diploporans, and eublastoids), the taxonomic subgroups that have been defined in earlier literature (i.e., the glyptosphaeritids, sphaeronitids, and asteroblastids of Diploporita, the fissiculates and spiraculates of Eublastoidea, and the platycystitids and comarocystitids of Paracrinoidea) often are not inferred as monophyletic either, further indicating a need to reexamine their evolutionary history.
Diploporita
The estimated phylogeny that used unlinked clock models of diploporans and other related blastozoans shows an origination timing in the later Cambrian and similar phylogenetic relationships to trees that have been previously published (Sheffield and Sumrall Reference Sheffield and Sumrall2019b; Lam et al. Reference Lam, Sheffield and Matzke2021).
An origination time of diploporans in the later Cambrian (the Furongian) is consistent with data from the fossil record. The earliest diploporan fossils currently known are from Early Ordovician rocks of the Prague Basin (Sheffield et al. Reference Sheffield, Lam, Phillips and Deline2022a), and even in these earliest known occurrences, morphological disparity is quite high, indicating that a deeper divergence time is likely (Sheffield and Sumrall Reference Sheffield and Sumrall2019a), making a Furongian origination date a reasonable estimate.
Overall, Diploporita does not represent a monophyletic grouping, with non-diploporitan taxa nesting within the diploporitans. The tree inferred herein largely agrees with other phylogenetic studies performed using maximum parsimony and Bayesian methods (Sheffield and Sumrall Reference Sheffield and Sumrall2019b; Lam et al. Reference Lam, Sheffield and Matzke2021). One difference in our analysis versus that in Sheffield and Sumrall (Reference Sheffield and Sumrall2019b), but in agreement with Lam et al. (Reference Lam, Sheffield and Matzke2021), is that Tristomiocystis, a Devonian- age taxon from Kentucky, USA, is nested within Sphaeronitida and sister to Eucystis. Originally, Sumrall et al. (Reference Sumrall, Brett, Dexter and Bartholomew2009) described it as a glyptosphaeritid taxon, which would have made it the only non-sphaeronitid to survive the LOME and one of the few non-sphaeronitids that existed in Laurentia, the paleocontinent the majority of the United States was a part of during the Paleozoic Era. Sphaeronitida has been uncovered as a clade in other analyses (Paul Reference Paul, Paul and Smith1988; Sheffield and Sumrall Reference Sheffield and Sumrall2019b), so this warrants further investigation into the relationships between members of this group and Tristomiocystis.
Glyptosphaeritids, as they present in this topology, are paraphyletic, which agrees with a number of other phylogenetic studies (Paul Reference Paul, Paul and Smith1988; Sheffield and Sumrall Reference Sheffield and Sumrall2019b; Lam et al. Reference Lam, Sheffield and Matzke2021). There is strong support for Eumorphocystis sharing a sister relationship with crinoid Hybocrinus, supporting a growing body of work that indicates crinoids may root within Blastozoa (Sumrall Reference Sumrall1997; O’Malley et al. Reference O’Malley, Ausich and Chin2016; Cole Reference Cole2017; Sheffield and Sumrall Reference Sheffield and Sumrall2019a,Reference Sheffield and Sumrallb).
The diploporan tree that was inferred using linked clocks indicated origination timings and relationships that differ vastly from other published analyses. First, the inferred trees suggest an origination date that is in the early Cambrian (Terreneuvian Epoch), long before either the earliest echinoderm body fossils are known, in Cambrian Stage 3 (Zamora et al. Reference Zamora, Lefebvre, Àlvaro, Clausen, Elicki, Fatka and Jell2013), or the earliest known stereom, a synapomorphic trait of Echinodermata that is easily identifiable from individual plates even if articulated skeletons are absent. The oldest known plates with stereom structure appear worldwide in the Delgadella anabara trilobite zone (~519.4–517.7 Ma; Gradstein et al. Reference Gradstein, Ogg, Schmitz and Ogg2020), shortly before the first articulated echinoderm fossils are preserved (Smith et al. Reference Smith, Zamora and Álvaro2013). There is an extensive record of “small shelly” fossils before these oldest that serve as a taphonomic control (Bottjer and Jablonski Reference Bottjer and Jablonski1988), in that the environments preserving small shelly fossils (e.g., early mollusks, lophophorates, arthropods, and sponges) should have been able to preserve individual stereom plates, had echinoderms been present. The PBDB currently records more than 700 pre–Delgadella anabara zone Cambrian localities preserving appropriate taphonomic control taxa that encompass 105 distinct rock units and span the biogeographic distribution of the earliest known echinoderms. Thus, even if the preservation potential of even just isolated plates is low for any one locality or even a rock unit, it is still very unlikely that we would have failed to sample any echinoderm plates regardless of whether or not taphonomic conditions were inappropriate for preserving whole skeletons.
The inferred relationships resulting from the use of the linked clock models show a number of relationships that have not been uncovered in other analyses, both for higher-level and lower-level taxonomy. Many well-established relationships, such as Eumorphocystis being most closely related to crinoids, are not uncovered in this analysis, and Eumorphocystis is instead linked with a diploporan, Asteroblastus. Taxa linked by multiple synapomorphies in other analyses (e.g., Frest et al. Reference Frest, Strimple and Paul2011; Sheffield and Sumrall (Reference Sheffield and Sumrall2019a) are separated in this analysis (e.g., species within Holocystites). See Sheffield and Sumrall (Reference Sheffield and Sumrall2019a) for discussions about the synapomorphic traits. A number of disparate taxa are grouped within the sphaeronitids (e.g., Fungocystites, Gomphocystites), which is unlikely. These relationships, if true, would indicate extremely high levels of convergence in the feeding ambulacral systems that were not uncovered in the character rate evolution analyses (Fig. 3B).
Eublastoidea
The inferred topology of the Eublastoidea phylogeny supports much of the previous work examining evolutionary patterns within the clade. The previously assigned orders of Fissiculata and Spiraculata are not natural evolutionary groupings. This has been well supported over the past decades, and the tree presented herein uses the ordinal groupings as proposed by Waters and Horowitz (Reference Waters and Horowitz1993). The unlinked clock models do suggest a more comprehensive grouping of fissiculate taxa, but it is not inclusive (Fig. 6B).
The clade’s higher-order taxonomy/tree backbone is solidified in the Devonian, which was noted as a result from Bauer (Reference Bauer2021) when considering phylogenetic diversity, which peaks in the Devonian. The lower taxonomic groups or the branches of the tree expand into and through the Carboniferous.
In this inference, Troosticrinus is in an ancestral position to many of the North American eublastoids and is not positioned in a direct sister relationship with the other known troosticrinids (=Metablastus, Tricoelocrinus). There is a well-known and documented gap from the first documented troosticrinid in the Silurian (Troosticrinus) and the subsequent included taxa in the Mississippian (Metablastus, Tricoelocrinus). Troosticrinus has been described as having both spiraculate and fissiculate morphologies (Sumrall and Waters Reference Sumrall and Waters2012), and this ancestral position of the taxon supports its importance in eublastoid clade dynamics.
Ordinal assignments for spiraculate genera were redescribed by Waters and Horowitz (Reference Waters and Horowitz1993). The estimated phylogeny utilizing the unlinked clock models (Fig. 6B) suggests that there is still work to be done on examining the taxonomic linkages between genera, focusing on the groupings that have significant posterior support would be the suggested starting point. Additionally, this updated tree structure will fundamentally change the biogeographic patterns previously assessed by Bauer (Reference Bauer2020) and will likely recover new and important speciation patterns within the clade.
Paracrinoidea
In the model that uses unlinked clocks, the timing of origin of this group is in the Ordovician Period, within the Darriwilian Age. The relationships largely follow what was inferred in the only other published paracrinoid phylogenetic analysis (Limbeck et al. Reference Limbeck, Bauer, Deline and Sumrall2024). The two major subgroups within Paracrinoidea (i.e., Comarocystitida and Platycystitida) do not appear as monophyletic groupings.
Paracrinoids have a limited temporal range, appearing only in the Middle to Late Ordovician, and exhibit high levels of morphological disparity among included genera. This has been hypothesized to reflect an early burst model (Novack-Gottshall et al. Reference Novack-Gottshall, Sultan, Smith, Purcell, Hanson, Lively and Ranjha2022; Limbeck et al. Reference Limbeck, Bauer, Deline and Sumrall2024). The divergence time suggested by this unlinked clock model is reasonable given the fossil record.
Overall, generic relationships are preserved in this model compared with those previously published. The major difference that is documented in published phylogenies is the rotation of nodes giving the appearance of different generic relationships (Limbeck et al. Reference Limbeck, Bauer, Deline and Sumrall2024). There are two major differences in this tree compared with previous phylogenetic hypotheses—the placement of Columbocystis and the placement of Canadocystis and Malocystites. In previous studies, Columbocystis is found at the base of the tree as its own group, whereas in this unlinked tree, Columbocystis is nested within a group containing Bistomiacystis, Comarocystites, and Implicaticystis.
The linked clock indicates a divergence time of approximately 560 Ma in the Proterozoic. Given current fossil evidence, this divergence time for Paracrinoidea is unrealistic, as there is no evidence of echinoderms (articulated or disarticulated) from before the Cambrian. Unlike what was seen in Diploporita and Eublastoidea, the linked tree does not return unexpected relationships; rather, generic relationships supported by prior phylogenetic analyses are returned. The biggest difference between the linked and unlinked models, outside time of origination, is the placement of Canadocystis and Malocystites. In the linked tree, this group is paired with Bistomiacystis and has a sister-taxon relationship with the group including Comarocystites and Implicaticystis. In the unlinked tree, the group Canadocystis and Malocystites are a sister taxon to the group including Amygdalocystites, Oklahomacystis, Platycystites, and Globulocystites. While this difference is apparent, both relationships are unsurprising, as previous Bayesian and parsimony analyses resulted in polytomies among generic relationships (Limbeck et al. Reference Limbeck, Bauer, Deline and Sumrall2024), resulting in a lack of resolution to fully ascertain these relationships.
Both the linked and unlinked tree topologies are not unexpected, as other phylogenetic methods return similar genus-level relationships joined by polytomies. The combination of this topology in conjunction with other phylogenetic hypotheses further highlights the complexities in capturing paracrinoid morphologies and homologies that have been suggested in other works (Sheffield et al. Reference Sheffield, Lam, Phillips and Deline2022a; Limbeck et al. Reference Limbeck, Bauer, Deline and Sumrall2024).
Implications for Ideas about Modularity and Functional Suites of Characters
In this study, we demonstrated that most characters in each character suite share a common evolutionary rate (Supplementary Fig. S1). This is likely due to how the characters were defined and collected. Parsimony informativity typically corresponds to roughly one change in the character across the tree. In a likelihood framework, character rates are normalized such that one among-character rate category always corresponds to these assumptions, and the others may vary from it. Thus, if the characters were collected for use with parsimony, significant deviations from 1.0 are not expected. Indeed, in a meta-analysis of character rates, Wright and Wynd (Reference Wright and Wynd2024) found that in about 35% of datasets, very little ACRV is present.
However, we find evidence of elevated rates of character evolution (= increases in clock rates) in several character types in the paracrinoids. The paracrinoids show elevated rates of evolution in the attachment, thecal, reproductive, and respiratory characters. When these differences are not accounted for, our estimates of phylogenetic trees are severely impacted. When we constrain estimations to use the same morphological clock per character partition (also called a linked clock model), we obtain clade ages and relationships that are unreasonable with respect to the rock record, as was the case in diploporans and paracrinoids, whose originations would be millions of years before any fossil evidence of Echinodermata. We also noted that there was an unusual separation of two Deltoblastus species, and we thought it was due to the addition of several internal characters that were artificially linking one species (D. permicus; see Fig. 6A) to pentremitids. The other species (D. batheri) was recovered to be an ancestor to a very different taxon (Pterotoblastus gracilis). After experimentation with removing characters and tree constraints, we determined this was not the case. Undermodeling mild differences in rates of character partitions led to inflated clade ages, and well-established monophyletic groups, such as Deltoblastus, were incorrectly separated, causing other disruption across the estimated tree topology. While the overall amount of rate variation is relatively small (Supplementary Figs. S1, S2), it appears that appropriately modeling that variation is extremely important to the final results. While outside the scope of this particular study, recent research (Khakurel et al. Reference Khakurel, Grigsby, Tran, Zariwala, Höhna and Wright2024) also suggests that it is critical to consider how the number of states assumed in morphological phylogenetic per character influences character likelihoods.
In organismal biology, the morphological clock model often receives less attention than the character model or how fossil data are incorporated into a phylogenetic analysis (but see excellent work with the clock: Simões et al. Reference Simões, Caldwell and Pierce2020, Reference Simões, Greifer, Barido‐Sottani and Pierce2023; Simões and Pierce Reference Simões and Pierce2021). However, these results demonstrate that appropriately modeling evolutionary rates both of the data as a whole and among partitions is crucial to the integrity of the phylogenetic results. Thus, it is our recommendation for researchers to consider rates of evolution carefully when examining which suites of traits to model together.
Models, Uncertainty, and Small Sample Sizes
The rjMCMC treats the actual model under which the phylogenetic tree is estimated as a random variable to be sampled during the analysis. At the end of the analysis, the proportion of time the MCMC chain spent with any one model is the posterior probability of that model, and these probabilities can be compared to determine which is the best-fit model according to standard Bayes factor comparison charts (i.e., Kass and Raftery Reference Kass and Raftery1995). The goal of this type of estimation is to get model-averaged estimates of parameters (including the phylogenetic tree) in which the result is not dependent on any one model or set of assumptions but incorporates the uncertainty in the underlying generating process. Prior work has stated this possibility as freeing the phylogenetic estimation from the assumptions of any one model (Huelsenbeck et al. Reference Huelsenbeck, Larget and Alfaro2004).
In the case of our results, averaging over the uncertainty is very important. Prior work using rjMCMC models for model selection in phylogenetics (Wright and Wynd Reference Wright and Wynd2024) found a very strong signal of clear model preference. However, in the Wright and Wynd study, they were examining a very simple parameter, ACRV, that has many observations (in the form of characters, each with its own evolutionary rate) from which to estimate it. In that sense, their phylogenetic problem is relatively simple and should show a clear signal of model preference. In the case of those results, rjMCMC provided a computationally efficient way to perform model selection, although incorporating the underlying uncertainty in the model was unimportant, as there was little uncertainty.
Our models, on the other hand, are very complex. For example, estimates of the parameters of the FBD are predominantly driven by fossil data, meaning our datasets have a small number of observations per model parameter. In this case, we expect there to be higher uncertainty to our model selection naturally due to simple data limitations. In this case, the rjMCMC mechanism is very important, as it allows us to examine model parameters, including the tree, averaged across the different candidate models. In this way, the resultant tree is not dependent on any one set of assumptions. This is appealing in the situation where the generating process is uncertain (as it is in our estimations; Figs. 3, 4). In our particular case, the prior and the posterior are very close together (Supplementary Fig. S3). This indicates that little signal is coming from the data about the model. Thus, we should not assume any one model without error, as we lack the certainty to do so.
One of the interesting things about model-based phylogenetics is the ability to understand pattern and process. If one model fits the data better than another, that is informative about the process that generated the data. In our case, there is little differentiation between models. Thus, we are unable to say very much about changes in the speciation rates, extinction rates, and other model parameters over time or across characters. This is unfortunate, but better than projecting unearned confidence in a particular model result. At the present time, the tools for estimating rjMCMC only show the model averaged values; if users want to look at the values for any one model, that should be run as a separate MCMC.
Comparatively, in stepping-stone model selection, a marginal likelihood is calculated per model, then compared on a standard scale. This is a computationally expensive process. Using rjMCMC enabled us to explore many models with reasonable runtimes per estimation. Wright and Wynd (Reference Wright and Wynd2024) demonstrated runtimes per MCMC of about half that of a stepping-stone estimation. In cases such as ours, we can take into account the uncertainty in the underlying model. Thus, we have untangled our phylogenetic estimation from dependency on any one set of assumptions.
Implications for Divergence Times within Early Paleozoic Clades
Our results, given the linked models, raise a general issue of concern: unrealistically early divergence times. As noted earlier, we often obtained divergence times within fairly derived echinoderm clades that predate the earliest fossil evidence for any echinoderms. Analyses such as the skyline FBD model explicitly allow for variation in origination, extinction, and sampling over time, and the prior probabilities of topologies given any particular combination of these rates reflect the observed data, but only the observed data. That is, the posterior probabilities of origination, extinction, and sampling rates for Late Ordovician diploporans reflect (in large part) Late Ordovician diploporan occurrences; however, the posterior probabilities of those same rates for the middle Cambrian reflect only much later occurrences. Congreve et al. (Reference Congreve, Patzkowsky and Wagner2021) address this problem in an analysis of Middle to Late Ordovician strophomenoid brachiopods by using the larger brachiopod clade to provide rates for pre–Middle Ordovician divergences. However, that study differed from this by using a single “model” tree and rates derived from taxonomic occurrence studies to assess only divergence times and rates of change on a tree. Here, phylogeny, origination, extinction, and sampling are among the varying parameters; to do something comparable, we would need to include a wide range of Cambrian non-blastozoan echinoderms to constrain those rates. Moreover, we would need to rely on more general deuterostomes for earlier Cambrian divergences and simply (or contentiously) “bilaterians” for Ediacaran divergences. Given the heterogeneity in diversification rates among bilaterian groups and even just deuterostome groups, it would be very questionable to apply them to a derived echinoderm group. The sampling rates certainly would be inapplicable: blastozoans possess relatively easy-to-preserve skeletal elements as a plesiomorphic feature, and those necessarily preserve at much higher rates than do unskeletonized early deuterostomes and more basal bilaterians. This raises the issue of how we can realistically employ taphonomic controls in models aiming to incorporate both biological and geologic parameters of early Paleozoic groups. We could use these controls to inform the analyses that, for example, late Ediacaran divergences within derived echinoderm, brachiopod, and other clades are both highly likely and highly unlikely, even if data such as we provide in these analyses offer no obvious means to recognize this.
Acknowledgments
We thank J. Thompson and C. Sumrall for discussions on character groupings. S.L.S. and J.E.B. were funded by NSF EAR 2429013. A.M.W. was funded by NSF DEB 2045842 and NSF CIBR 2113425. P.J.W. was funded by NSF EAR 2129628. We thank the many people who entered records into the PBDB, particularly P. Novack-Gottshall, B. Kroger, M. Foote, and M. Clapham. We are grateful to anonymous reviewers and associate editor L. Liow for feedback that improved this work. This is PBDB Publication No. 541.
Competing Interests
The authors declare no conflicts of interest.
Data Availability Statement
R-code for illustrating phylogenies and summarizing chronostratigraphic data from the Paleobiology Database can be found at https://github.com/PeterJWagner3/Supplementary/tree/main/Blastozoans, as well as in Data Dryad at https://doi.org/10.5061/dryad.s7h44j1hg.


 Open access