Understanding the social and economic conditions that have resulted in the increased prevalence of overweight/obesity and associated non-communicable diseases in rapidly modernizing populations of the Southwest Pacific has been a long-term interest of human biologists( Reference Baker, Hanna and Baker 1 , Reference Friedlaender 2 ). A number of different strategies have been used to identify the causes of overweight/obesity and its health consequences among modernizing South Pacific populations. A common approach has been to compare subgroups of a larger population living in recognizably different economic or social circumstances. This includes comparisons of rural v. urban residence( Reference Hodge, Dowse and Toelupe 3 ), comparing different social groups living under modern v. traditional conditions( Reference Friedlaender 4 ), individuals living on islands that differ in their economic development( Reference Ezeamama, Viali and Tuitele 5 – Reference Hanna and Fitzgerald 7 ) or evaluating the consequences of migration to a more modernized society( 8 , Reference Hawley and McGarvey 9 ). Even though these studies have generally supported the hypothesis that behavioural changes in response to economic development are associated with increases in the prevalence of overweight/obesity, they often do not control for within-group variability. Thus, presumptions made about different groups (e.g. urban groups are more modern than rural groups) may not necessarily apply to all members. Furthermore, the choice of markers such as income, household composition and occupation may have different sociocultural meanings or be associated with different health-related concerns among individuals (or subgroups) at different points in the traditional-to-modern transition( Reference Mavoa and McCabe 10 , Reference McLennan and Ulijaszek 11 ). Since practices associated with modernity vary widely among different island, sex and age groups in developing Pacific nations( Reference Widmer 12 ), traditionally used indices of modernization do not always follow an expected gradient( Reference Dancause, Dehuff and Soloway 13 ).
Recent population studies have used a variety of sophisticated regression and risk factor models to identify within-group, individual behavioural characteristics that are most likely to be associated with overweight/obesity or non-communicable diseases( Reference Ezeamama, Viali and Tuitele 5 , Reference Dancause, Vilar and Wilson 14 , Reference Lordan, Soto and Brown 15 ). In addition, a pattern of dietary items that cluster together to explain the variance in obesity and other metabolic syndrome characteristics has been identified using principal component analysis( Reference Wang, Hawley and Thompson 16 ). An analogous approach is to use multiple correspondence analysis (MCA). MCA identifies composite dimensions in large categorical data sets in a manner analogous to the way principal component analysis is used to identify latent variables in continuous data( Reference Abdi and Valentin 17 ). Each dimension generated by MCA has a greater potential explanatory capacity than any single variable in the data set and can be represented as a continuous numerical scale that permits direct linear comparisons with any biometric characteristic. This scale can be the foundation of regression analysis or can be sub-divided to produce status categories for the analysis of overweight/obesity( Reference Alaba and Chola 18 , Reference da Silva, Souza and Silva 19 ) and other health concerns( Reference Ayele, Zewotir and Mwambi 20 – Reference Higuera-Mendieta, Cortés-Corrales and Quintero 23 ).
As in many developing Southwest Pacific island nations, the prevalence of obesity has increased substantially among men and women in Vanuatu over the past 50 years( 24 , 25 ). However, understanding the reasons behind this increase is complicated by differences in the level of development among Vanuatu’s sixty-five inhabited islands( Reference Olszowy, Pomer and Dancause 26 ) and by individual differences in participation in the cash economy within each island. This situation offers an excellent opportunity to apply MCA to identify a set of specific behaviours that collectively are associated with significant differences in individual anthropometric measures of overweight/obesity across all islands. Using MCA in this way takes into consideration both within- and between-island diversity, and makes it possible to develop a more nuanced understanding of the relationship between modernization/development status and overweight/obesity.
Methods
Samples
In 2011, the residents of fourteen villages on five Vanuatu islands (Efate, Nguna, Aneityum, Ambae and Futuna) participated in a comprehensive malarial survey, the goal of which was to contact and assess the malarial status of all inhabitants. These islands were selected based on an appraisal of their level of development, determined primarily by their electricity infrastructure, the education and occupation of their inhabitants( Reference Olszowy, Pomer and Dancause 26 ), and on the basis of previous research that showed island differences in morphology( Reference Dancause, Vilar and Wilson 14 ). Efate clearly represents the most developed island in the survey, since it is the site of the capital city, Port Vila. The level of development is lower in Nguna, and declines progressively on Aneityum, Ambae and Futuna( Reference Olszowy, Pomer and Dancause 26 ).
Most of those who participated in the larger survey also agreed to participate in the current study. Unfortunately, direct comparisons of our sample sizes with village-level population figures cannot be made, because data from the census conducted two years before our study are available only for islands as a whole( 27 ). Nevertheless, three of the study islands (Aneityum, Futuna and Nguna) are small enough so that it is possible to approximate the degree of coverage reasonably accurately. On Aneityum, about 80 % of the 430 adults (20 years or older) enumerated in 2009 lived in the three villages we surveyed. Thus, our sample of 214 adults consisted of about 60 % of the total adult residents of those villages. On Futuna Island, about two-thirds of the total adult population (201 enumerated in 2009) lived in the three study villages. Our sample of 114 therefore constitutes approximately 80 % of the adult residents of those villages. We also sampled four of the ten villages on Nguna Island (approximately 40 % of the island’s inhabitants). Since the total adult population of Nguna was 669 in 2009, our sample of 188 constituted approximately two-thirds of the resident adult population of the study villages. Supplemental Table 1 (see online supplementary material) shows that the proportions of males and females and the distribution of ages in our samples from Aneityum, Futuna and Nguna did not differ significantly from the age and sex distributions enumerated in 2009 on the islands as a whole.
Both Ambae and Efate are much larger islands, with much larger populations. Local population figures for the Area Council regions on Ambae and Efate within which our study took place are available from a 1999 village enumeration( Reference Dancause, Vilar and Chan 28 ) and from a mini-census conducted in 2016( 29 ). On Ambae, using figures from the 2016 mini-census to estimate the 2011 population is reasonable, since the total island population grew by only 2 % between 2009 and 2016. The population of the Ambae villages from which our sample was drawn constituted 37·6 % of the total (i.e. including all ages) South Ambae Area Council population in 1999 (364/967). In 2016, 683 adults were enumerated in the Area Council region. Presuming the proportion of the population in the study villages relative to the Area Council region as a whole remained the same (i.e. 37·6 %), there would have been roughly 257 adults living in the study villages in 2016. In that case, our sample of 110 men and women would have constituted about 43 % of the resident adults. The proportions of men and women in our sample of Ambae villages and the age distribution among males did not differ from those of the total South Ambae Area Council population in 2016; but our sample was skewed towards younger aged women. On Efate Island, the study was conducted in a peri-urban area located about 16 km (10 miles) from Port Vila, the nation’s capital. In 2016, 4935 adults were enumerated in the area where the study village was located. However, using the 2016 mini-census to estimate the coverage in this area is problematic both because the island’s population increased significantly (+30 %) between 2009 and 2016, and because a large number of retirees lived in the study village. Our best estimate is based on the presumption that the proportion of the total Area Council region population living in the study village in 1999 (25 % from village-level data) remained the same. In this case, the adult population would have been about 1235 in 2016 (or about 865 in 2011, presuming that the population was 30 % less). Thus, our sample of 184 adult men and women would have constituted between about 15 and 21 % of the total adult inhabitants. Supplemental Table 1 shows that our sample includes a larger proportion of men and a larger proportion of older adults compared with the Area Council region as a whole in 2016.
In sum, our sampling was sufficiently large and appropriately stratified on Aneityum, Futuna, Nguna and likely South Ambae to accurately represent the populations of the villages in which the study took place. Using a 95 % CI, the confidence level for the survey was ±4 % on Aneityum, ±6 % on Futuna and Nguna, and ±7 % on Ambae. Our sample of the study village on Efate may have been less representative (producing a confidence level of ±8 %). However, there is no way of knowing whether our subjective assessment of the large number of retirees in the village may have made our sampling more accurate than might be indicated by comparisons with the larger Area Council region. At the very least, a larger sample of individuals aged 50 years or older on Efate likely increased our total sample of older adults who might have participated in the cash economy.
Permission to conduct this research was received from the Temple University Institutional Review Board (protocol number 13827) and from the Binghamton University Institutional Review Board (protocol number 1578–10) before the commencement of the study, and permission to conduct research in-country was granted by the Vanuatu Ministry of Health. In each village where the study took place, the research protocol and aims were explained to local chiefs and, at a general meeting, to the community at large. Informed consent was obtained from each adult participant. Institutional Review Boards and the Vanuatu Ministry of Health approved this consent procedure.
Measurements
An extensive behavioural survey was administered to 810 individuals aged 20 years or older (398 men and 412 women) by trained interviewers. This survey provided information on demographics, family and personal history of illness, food purchasing behaviours, activities, and electronics ownership and technology use. Interviews were conducted in ‘Bislama’, the lingua franca of Vanuatu. The analysis presented here focuses on seventy-three questions that were answered by ‘yes/no’ (see online supplementary material, Supplemental Table 2). The focus on questions with a simple response (rather than questions that asked individuals for a subjective determination of the extent/degree to which they were involved in various behaviours) was done purposefully to determine if MCA could effectively be used to characterize behaviours associated with differences in overweight/obesity.
Anthropometric measurements were collected following standard guidelines( Reference Lohman, Roche and Martorell 30 ). Standing height without shoes was measured using a Seca 214 stadiometer (Seca, Hamburg, Germany). Weight was measured using a Tanita TBF-521 digital scale (Tanita, Arlington Heights, IL, USA) and percentage body fat (%BF) was calculated using Tanita proprietary formulas. Weight and height were used to calculate BMI (kg/m2). Lange skinfold callipers (Beta Technologies, Cambridge, MD, USA) were used to determine skinfold thicknesses at the triceps, subscapular and supraliliac sites, and the mean of three measures at each site was used for analyses.
Analytical strategy
MCA was used to analyse individual responses to yes/no questions about easily recognizable behaviours associated with daily life and to identify behavioural categories that were linked to variation in measures of overweight/obesity. MCA is a type of exploratory factor analysis designed to reduce the dimensionality of large categorical data sets that include more than two variables distributed among a large number of individual responses( Reference Greenacre and Blasius 31 ). Thus, MCA can suggest unexpected dimensions and relationships in the tradition of exploratory data analysis. As in related methods of factor analysis like principal component analysis, MCA assumes that the variables comprising a data matrix represent a high-dimensional Euclidean space and collapses this n-dimensional space by creating new, synthetic dimensions. These dimensions are derived from an indicator matrix of the data set, in which all possible responses to the questions are coded as 0/1 binary variables. Each dimension is a vector that is characterized by a correlated set of related variables. The χ 2 distance calculated between each of the variables and between each of the individuals is the basis for determination of explained variance. As in principal component analysis, the first dimension accounts for the greatest variance in the participant-plus-variable profile that makes up the data set. Each subsequent dimension describes the greatest proportion of the remaining variance. Further, MCA is used to determine the coordinates of individuals on each synthetic dimension, which are analogous to factor scores for individual cases in a principal component analysis. Thus, MCA permits individuals to be positioned linearly, based on the pattern of shared responses.
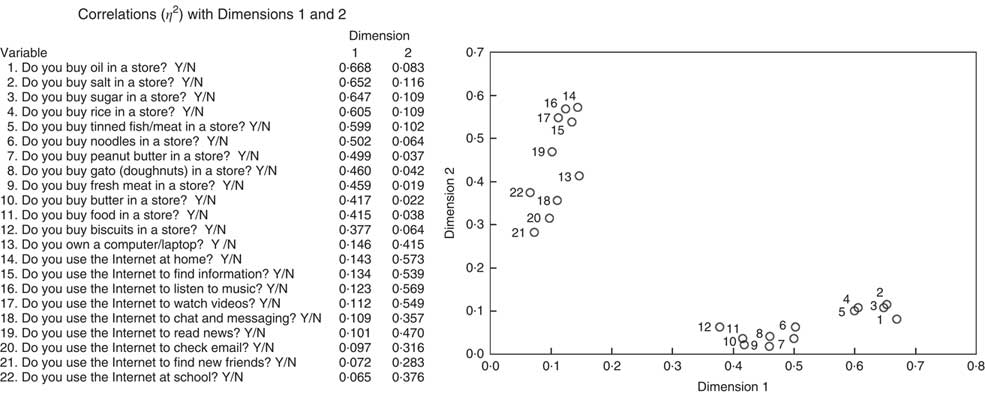
For the analysis of the Vanuatu data, we used two successive MCA to generate the indices for further morphological analyses. Our first MCA was exploratory and included a pool of seventy-three ‘yes/no’ questions converted to Boolean format (true/false) that adult participants answered. MCA was performed on the indicator matrix using the FactoMineR package in R with default parameters( Reference Lê, Josse and Husson 32 ). There were no missing data, and no supplementary continuous variables were included. A scree plot of eigenvalues (a measure of inertia, or variance, accounted for by a dimension) identified two primary dimensions (Dimension 1 eigenvalue=10·965; Dimension 2 eigenvalue=6·715; Fig. 1(a)). We identified twenty-two questions that were strongly correlated with either the first or the second dimension using η 2 (the squared correlation of the variable to the dimension). A second MCA was performed on these twenty-two questions in order to focus on variables that individually and collectively contributed most significantly to the inertia (explained variance) determined by the initial MCA of all seventy-three variables (Fig. 1(b)). Figure 2 shows the correlations (η 2) between the twenty-two input variables and the two dimensions with the highest eigenvalues identified by the second MCA. The twelve variables showing high η 2 correlations with Dimension 1 explained the greatest amount of the variance (33·6 %) in this second analysis. These twelve variables (listed in Fig. 2) consisted of responses to questions about foods purchased at stores. Thus, this dimension has been labelled ‘food purchasing behaviour’. Factor scores generated by MCA represent the position of each individual on the numerical scale derived from this dimension. These factor scores ranged from those who answered ‘yes’ to all twelve questions to those who answered ‘no’ to all twelve questions. Based on their position on this scale, individuals were divided into three tertiles. Individuals whose factors scores were at the upper one-third of the distribution were characterized by answering ‘true’ to most of or all the questions about food purchases at stores. Individuals whose factor scores were at the lower one-third of the distribution were characterized by answering ‘false’ to most of or all the questions about food purchases at stores. Those in the middle third answered a mix of ‘true’ or ‘false’ to the questions. A number of individuals at the boundary between the middle and upper tertile clustered at the same factor score. These individuals were arbitrarily assigned to the upper tertile. This produces a distribution that has a slightly higher percentage of upper-tertile individuals (n upper tertile 276, 34 %) compared with the percentage of lower- and middle-tertile individuals (n lower tertile 267, 33 %; n middle tertile 267, 33 %). To determine the effect that the abstracted dimension (i.e. ‘food purchasing behaviour’) had on morphological variables, the tertiles were stratified by both sex and 10-year age groups (20–29 years, 30–39 years, 40–49 years, 50–59 years, 60 years or older). Two analyses were conducted to evaluate the use of MCA-determined tertiles in assessing obesity. First, ANOVA was used to determine if morphological indicators of overweight/obesity differed significantly between tertiles and/or age groups for each sex. Statistical significance was determined at P<0·05 or greater. Second, OR and their 95 % CI were computed to evaluate whether individuals in the upper tertile identified by MCA were more likely to exhibit obesity than those in the lower two tertiles. For this purpose, individuals were classified as obese if their subscapular skinfold, triceps skinfold or BMI measurements fell above the 75th percentile, using US National Health Statistics standards for adults( Reference McDowell, Fryar and Ogden 33 ); or if their %BF fell above the obesity level predicted by equations based on BMI( Reference Gallagher, Heymsfield and Heo 34 ). Since obesity classification was based on age- and sex-specific parameters (i.e. whether an individual fell above the 75th percentile for the US National Health Statistics standards for their age and sex group), there was no need to adjust for age and sex differences; and all individuals in the sample were combined for this analysis. All statistical analyses were performed using the statistical software package IBM SPSS Statistics for Windows version 21.0.

Fig. 1 Scree plots of eigenvalues for (a) dimensions established by the first multiple correspondence analysis (MCA) with seventy-three variables and (b) dimensions established by the second MCA with twenty-two variables, identified from an extensive behavioural survey administered to Vanuatu adults (n 810) aged 20–85 years. A dimension’s eigenvalue is a measure of the amount of variance for which it accounts

Fig. 2 The η 2 values related to two dimensions determined by the second multiple correspondence analysis for twenty-two variables, identified from an extensive behavioural survey administered to Vanuatu adults (n 810) aged 20–85 years. Dimension 1 accounts for 33·6 % of the variance in this analysis, while Dimension 2 accounts for 22·8 %
Results
Figure 3 shows the distribution of tertiles by island (males and females combined). The overwhelming majority of individuals on Futuna (76·3 %) fell into the lower tertile (i.e. were least likely to purchase food items at a store), while on Efate the overwhelming majority of individuals (66·5 %) fell into the upper tertile (i.e. were most likely to purchase food items at a store). On other islands, there was a more uniform distribution of individuals in the three tertiles. As is obvious from Fig. 3, the difference between observed and expected values for the distribution of tertiles among the islands is highly significant (χ 2=198·369, df=8, P<0·001). Over all ages, the proportion of males in the upper tertile was greater than the proportion of females, while the proportion of females in the lower and middle tertiles was greater than the proportion of males (χ 2 over all ages=16·778, P<0·001); see the online supplementary material, Supplemental Fig. 1. Differences in proportions of males and females in the three tertiles were statistically significant in the age categories 20–29 years (χ 2=10·581, P=0·005) and 30–39 years (χ 2=7·047, P=0·030); but not in the three older age categories.

Fig. 3 Distribution of food purchasing tertiles (
![]() , lower tertile;
, lower tertile;
![]() , middle tertile;
, middle tertile;
![]() , upper tertile) by island (males and females combined) among Vanuatu adults (n 810) aged 20–85 years. For differences in distribution of men and women in the three tertiles among the six study islands, χ
2=198·369 (P<0·001)
, upper tertile) by island (males and females combined) among Vanuatu adults (n 810) aged 20–85 years. For differences in distribution of men and women in the three tertiles among the six study islands, χ
2=198·369 (P<0·001)
Tables 1 and 2 show means and sd of three general measures of adiposity (weight, BMI, %BF) for men and women, arranged by 10-year age groups. Over all ages, weight, BMI and %BF were significantly greater among both men and women who were most likely to purchase food items at a store compared with those who purchased few or no food items at stores. In each case, post hoc analysis indicated that the differences between the tertile that was most likely to purchase food at a store and the tertile that was least likely to purchase food at a store were highly significant. Nevertheless, the pattern of tertile differences in BMI and %BF was not uniform in all age groups. Among men and women in their 20s and 30s, food purchasing behaviour was not associated with major differences in BMI or %BF. Among women, the most significant differences between tertiles occurred among those in the age category 40–49 years. Differences between tertiles diminished among older women, particularly those aged 60 years or older. Among men, the greatest differences between tertiles occurred among those in the oldest age group.
Table 1 Means and sd of weight and body fat measures among Vanuatu men aged 20–85 years by food purchasing tertile and age group

*P<0·05, ***P<0·001.
Table 2 Means and sd of weight and body fat measures among Vanuatu women aged 20–85 years by food purchasing tertile and age group
*P<0·05, **P<0·01, ***P<0·001.
This pattern is dramatically illustrated when skinfolds are compared between tertiles. Tables 3 and 4 show marginal means across the age groups for triceps skinfolds, subscapular skinfolds and suprailliac skinfolds for men and women, adjusted for differences in height and weight (both significant covariates of skinfolds). Among men, mean adjusted triceps skinfolds did not differ significantly between food purchasing tertiles; but differences in measures of trunk fat (adjusted subscapular and suprailliac skinfolds) were highly significant. Both measures increased much more substantially with age among men who were most likely to purchase food at stores compared with men in the middle and lower tertiles. Among women, adjusted mean triceps skinfolds differed significantly among the tertiles, but differences among tertiles did not vary significantly with age. Thus, women in the upper tertile have higher triceps skinfolds than women in the other two tertiles, regardless of age. On the other hand, there were no significant differences in either subscapular or suprailliac skinfolds associated with food purchasing behaviour. However, this was mostly due to the similarity in adjusted skinfold measures, regardless of food purchasing behaviour, among women aged 60 years or older. Among women under the age of 60 years, adjusted subscapular and suprailliac skinfolds were significantly greater among those who were most likely to buy food at stores.
Table 3 Means and se of skinfold measurements, adjusted for differences in height and weight, among Vanuatu men aged 20–85 years by food purchasing tertile and age group

*P<0·05, ***P<0·001.
Table 4 Means and se of skinfold measurements, adjusted for differences in height and weight, among Vanuatu women aged 20–85 years by food purchasing tertile and age group

** P<0·01.
The OR presented in Table 5 show that, for each measure of body fat, but particularly for skinfolds and BMI, Vanuatu individuals in the highest food purchasing tertile were significantly more likely to be above the 75th percentile compared with individuals in the lower two tertiles. Thus, the identification of these tertiles by MCA is useful for identifying individuals who are likely to be obese.
Table 5 OR indicating the increased probability that individuals in the upper food purchasing tertile are above the 75th percentile in measures of body fat, compared with those in the middle and lower tertiles (males and females combined), among Vanuatu adults (n 810) aged 20–85 years

Discussion
In the present study, MCA was used to explore the responses to a set of questions designed to assess modernization status. The goal was to identify behavioural characteristics associated with modernization that were relevant to variation in overweight/obesity among Vanuatu adults, based on the responses to seventy-three yes/no questions. In this case, the most significant ‘explanatory’ vector identified by MCA (i.e. the vector associated with the greatest proportion of variance defined by the survey questions) included individual responses to twelve questions related to buying food at a store. The position of each individual on the numerical scale derived from this vector ranged from those who answered ‘yes’ to all twelve questions to those who answered ‘no’ to all twelve questions. Based on their position on this scale, individuals were divided into three tertiles that differed in food purchasing behaviour. Subsequent analysis indicated that individuals in the tertile most likely to purchase food at stores were significantly heavier and fatter than individuals in the tertile least likely to purchase food at stores. Furthermore, the odds of exhibiting BMI and skinfold values above the 75th US percentile were doubled among individuals in the highest tertile relative to those in other two tertiles. Thus, as an exploratory quantitative method, MCA has the ability to position individuals on an axis that is related to ‘modernization’ status and correlate that position with individual differences in morphology and health.
It is noteworthy that modernization status in Vanuatu is most strongly reflected in food purchasing behaviour, rather than in any of the other activities included in the seventy-three questions analysed by MCA. This may be related to the inclusion of questions concerning what cash was spent on (e.g. travel, recreational activities, ownership of appliances, ownership and use of electronic devices, etc., in addition to food purchases at stores), rather than how much cash was earned. Consequently, the modernization status elicited by our survey is likely associated with differences in the use of cash. Since individual variation in food purchases is greater than variation in the other uses of cash, it was identified as the most significant explanatory component in our modernization profile.
That being said, it is not surprising that food purchases at stores are associated with the risk of obesity and overweight. The food purchases covered by questions in the survey consisted of high-energy dietary supplements (sugar, oil), energy-dense processed foods (peanut butter, tinned meat, tinned fish) and refined grains (rice, noodles). The apparently greater access to these types of foods among individuals in the upper tertile in the present study corresponds to a worldwide shift in the food system caused by economic growth and fuelled by international organizations that promote trade between developed and developing nations( Reference Thow 35 ). In the Pacific, trade agreements and international investments have promoted an increasing availability of energy-dense, nutritionally poor processed foods( Reference Hughes and Lawrence 36 – Reference Snowdon, Raj and Reeve 39 ). Vanuatu is a signatory of the Pacific Island Countries Trade Agreement, which requires member countries to reduce tariffs and other barriers to imports( Reference Sahal Estimé, Lutz and Strobel 37 ), and the World Trade Organization, which similarly limits trade barriers( Reference Hughes and Lawrence 36 ). Thus, it is not surprising that imported foods more than tripled between 2005 and 2015( 40 ) – although perhaps to a somewhat lesser extent than in other Pacific Island nations( Reference Sahal Estimé, Lutz and Strobel 37 ). However, food imports into Vanuatu are currently growing at a faster pace than the world average( 41 ).
Pacific Island studies have generally shown that increases in overweight/obesity are linked to economic development( Reference Hodge, Dowse and Toelupe 3 , Reference Gelanis, McGarvey and Quested 6 , Reference Hanna and Fitzgerald 7 , Reference Dancause, Vilar and Wilson 14 , Reference Wang, Hawley and Thompson 16 , Reference DiBello, McGarvey and Kraft 42 ), economic status( Reference Ezeamama, Viali and Tuitele 5 , Reference Lordan, Soto and Brown 15 ) and/or sociocultural factors( Reference Mavoa and McCabe 10 , Reference McLennan and Ulijaszek 11 ). However, the relatively few studies that have assessed the effect of specific dietary components on overweight/obesity in Pacific Island countries do not consistently demonstrate an association between Westernized diets and obesity. An initial study in Samoa( Reference DiBello, McGarvey and Kraft 42 ) and a study in Vanuatu( Reference Dancause, Vilar and Wilson 14 ) indicate that even modest incorporation of Western foods in the diet can contribute to increased risk of obesity. On the other hand, a more recent study in Samoa( Reference Wang, Hawley and Thompson 16 ) has reported that a diet that contains a mix of modern and traditional dietary elements is associated with a greater risk of obesity than diets that are totally modern. Among migrants from Bougainville to Port Moresby, there was no association between obesity and the inclusion of Western food items in the diet; but variation in measures of obesity were significantly associated with differences in activity( Reference Vengiau, Umezaki and Phuanukoonnon 43 ).
These studies indicate that the relationship between economic development, dietary choice and obesity in the developing nations of the South Pacific may be complicated by a number of confounding factors. Among them is the uneven penetration of the cash economy( Reference Sahal Estimé, Lutz and Strobel 37 ). In Vanuatu, large-scale enterprises involved in the distribution of imported foods (supermarkets, cafés/bars, fast-food restaurants and convenience stores) exist only on Efate. However, even on Efate, many people live in rural settlements without consistent access to mass distribution outlets. On less developed Vanuatu islands, biscuits, chips, candy, gato, tinned meat or tinned fish, and sodas or sometimes beer are available in small stores, run (often on an irregular basis) by local entrepreneurs. Thus, the non-uniform availability of food to purchase likely contributes to differences in the prevalence of obesity between and within islands( Reference Dancause, Dehuff and Soloway 13 , Reference Dancause, Vilar and Wilson 14 ).
Nevertheless, it is important to note that, despite island differences in food distribution infrastructure, our MCA links the purchase of processed foods at stores to overweight/obesity. This finding is potentially significant in evaluating various initiatives undertaken to combat obesity in Vanuatu. At present, national government strategies seem to focus on regulating the energy-dense content of dietary staples, on taxing soft drinks, on mandating nutrition content labelling and on a variety of public education programmes( Reference Snowdon and Thow 38 , 44 ). There also have been initiatives at the local level, aimed at banning all junk foods( Reference Ives 45 ). Our results indicate that the most effective approaches in the short term are likely those that affect availability of junk foods at local stores and shops. In this regard, labelling or taxation strategies are less likely to have an impact as long as junk foods are available. On the other hand, government proposals to elevate awareness of good dietary practices by initiating nutrition education programmes may have greater success over the long run.
In addition to island differences in mercantile infrastructure, there appear to exist age and gender differences in the way people use cash to purchase food items in stores on all islands. Our study indicates that buying food at stores is less likely to be associated with obesity among younger individuals than among older individuals. Among younger Ni Vanuatu, an active lifestyle regardless of differences in the degree to which individuals purchase store-bought foods may limit the effect of dietary differences, similar to the pattern noted among young migrants to Port Moresby( Reference Vengiau, Umezaki and Phuanukoonnon 43 ). The increased risk of overweight/obesity among older adults who purchase food at stores suggests that attitudes about food purchases (possibly including cultural factors influencing the type of dietary items on which cash is spent( Reference Widmer 12 )) may differ according to age and also contribute to the risk of overweight/obesity. Gender appears to introduce a further complication. Among women, tertile differences in measures of body fat – particularly adjusted skinfold measurements – peak in the 40–49 years age group, and then diminish with age. This could be related to a more uniform activity pattern among older women regardless of the extent to which they purchase food at stores. Among similarly modernizing groups in the Solomon Islands, older women purchased food at stores for others in their families while still maintaining strenuous traditional work patterns( Reference Weitz 46 ). Among older men in Vanuatu, on the other hand, tertile differences in measures of body fat increase with age. Perhaps, like older men in the Solomon Islands( Reference Weitz 46 ), exercise capacity was inversely proportional to modernization status – thereby causing differences in obesity risk to be associated with both increased purchases of food in stores and reduced activity.
An important limitation of the present study is that the questions included in the survey do not indicate how much food is purchased at stores, or how frequently it is purchased and consumed. Since both eating pattern and the frequency of processed food purchases may vary by age and sex groups, there is a clear need for follow-up research to clarify dietary consumption patterns. While we did not directly measure activity pattern, several questions about activity types were included in the survey. Differences in the responses to these questions did not map to tertiles associated with food purchasing behaviour and were not identified by MCA as contributing significantly to overall behavioural variability. An additional limitation is the cross-sectional nature of the survey. The age differences in the pattern of food purchases and overweight/obesity suggest a cohort effect. However, while average weight and measures of adiposity among individuals who are most likely to purchase food at stores increase with age, and therefore might be connected with the long-term consumption of imported foods, this cannot be confirmed without further longitudinal studies.
Our estimates of population sizes, while admittedly crude, indicate that we obtained samples that accurately reflected the age and sex structure of the larger of populations on three islands and the local region on a fourth. Our sampling strategy on the fifth island, Efate, was admittedly not large enough to represent the island with the greatest engagement in the cash economy. Thus, our results are probably best applied to the rural Vanuatu population – 75 % of the total( 27 ). Nevertheless, our sampling strategy, aimed at including as many individuals from the target populations as possible, is probably the best method of obtaining representative samples in areas of the world where local demographic data are not easily obtainable.
Even though the survey upon which the analysis was based was not designed with the expectation that MCA would be performed, MCA proved to be effective in identifying behaviours linked to modernization that were significantly related to obesity risk. This suggests that MCA could be applied to existing Vanuatu databases such as those generated by the Vanuatu National Statistics Office. These data include nationwide responses to questionnaires about a variety of individual behavioural characteristics, broken down by region, sex and age( 29 , Reference Martyn, Yi and Fiti 47 ), and cover Efate and other urban areas, as well more remote locations. MCA of these data could potentially identify aggregate behaviours that might be related to obesity in different segments of the population and could be used to design specifically targeted initiatives to improve nutrition and reduce obesity.
Conclusion
The present study indicates that MCA represents an important addition to the list of techniques that can be used to identify behaviours that are associated with the impact of modernization on overweight/obesity. Using categorical variables, MCA is able to identify individual-level patterns of behavioural variability within and among diverse social and geographic groups. Out of seventy-three questions concerning a wide range of behaviours associated with modernization, MCA identified twelve questions related to food purchases at stores that explained the greatest individual variance. The simple ‘yes/no’ responses to these twelve questions about food purchasing were sufficiently robust to identify individuals at risk for overweight/obesity regardless of island of residence, rural or urban location, or the presence/absence of major food distribution infrastructure. Therefore, MCA may be particularly useful in identifying categorical variables associated with obesity risk in research among modernizing populations when the conditions of study groups are either unknown or potentially diverse, or when funds, manpower and/or time are limited.
Acknowledgements
Acknowledgements: The authors wish to thank all the participants. Financial support: This work was supported by the Wenner-Gren Foundation for Anthropological Research (R.M.G., grant number 8301), by a Grant-in-Aid and a Summer Research Fellowship from Temple University (C.A.W.), and by the Harpur College Grants in Support of Research, Scholarship and Creative Work at Binghamton University (J.K.L.). The Wenner-Gren Foundation, Binghamton University and Temple University had no role in the design, analysis or writing of this article. Conflict of interest: None. Authorship: R.M.G. and J.K.L. designed the research; C.A.W., K.M.O., K.N.D., C.S., A.P., H.S., G.L., C.W.C., A.K., J.K.L. and R.M.G. conducted the research and collected the data; A.V.H. and C.A.W. analysed the data and performed statistical analyses; C.A.W. and A.V.H. wrote paper; C.A.W. and A.V.H. had primary responsibility for final content; all authors edited and reviewed and approved the final manuscript. Ethics of human subject participation: This study was conducted according to the guidelines laid down in the Declaration of Helsinki and all procedures involving human subjects were approved by the Ethics Committee of Temple University (Temple University Institutional Review Board, protocol number 13827) and by the Ethics Committee of Binghamton University (Binghamton University Institutional Review Board, protocol number 1578–10) before the commencement of the study. Permission to conduct research in-country was granted by the Vanuatu Ministry of Health. In each village where the study took place, the research protocol and aims were explained to local chiefs and, at a general meeting, to the community at large. Informed consent was verbally obtained from each adult participant and witnessed by a member of the research team, following a protocol approved by the Institutional Review Boards of Binghamton University and Temple University, and by the Vanuatu Ministry of Health.
Supplementary material
To view supplementary material for this article, please visit https://doi.org/10.1017/S1368980019000302