

Although childhood obesity is levelling off in some populations, worldwide prevalence remains high( 1 , Reference Wang and Lobstein 2 ), even at very young ages. The number of infants, toddlers and children (ages 0–5 years) who were overweight increased from 32 million globally in 1990 to 42 million in 2013. This figure is predicted to rise to 70 million by 2025( 3 ).
In the UK, the most recent data provided by the National Child Measurement Programme including over 1 million children showed that 9·3 % of Year R (reception) children (ages 4–5 years) were obese and another 12·8 % were overweight( 4 ). Prevalence then increases further in the first few years of school; among Year 6 children (ages 10–11 years), 14·3 % were overweight and a further 19·8 % were obese( 4 ). It is estimated by 2020 that 20 % of all boys and 33 % of all girls will be obese( 5 ). Infant weight gain has a positive association with subsequent obesity risk( 6 , Reference Druet, Stettler and Sharp 7 ), highlighting the importance of research describing the aetiology of childhood obesity to support the development and implementation of effective policies and interventions.
Obesity prevalence assessed using BMI in the UK is significantly higher in children of South Asian origin compared with White British children( 8 , Reference Saxena, Ambler and Cole 9 ) although this may in part be due to differences in body composition. Adults of South Asian origin are at greater risk of obesity-related conditions such as type 2 diabetes( Reference Razak, Anand and Shannon 10 ), even at lower levels of obesity (measured using BMI), compared with White British populations. Children with obesity are more likely to become obese in adulthood and develop a variety of health problems, including CVD, insulin resistance, musculoskeletal disorders, some cancers and disabilities( 3 ); and obesity in later childhood (ages 7 to <18 years) and early adulthood (ages 18–30 years) is positively associated with risk of CHD( Reference Owen, Whincup and Orfei 11 ). In addition, overweight and obesity in childhood and adolescence have adverse consequences on premature mortality and physical morbidity in adulthood( Reference Reilly and Kelly 12 ). Overweight or obese adults who were obese as children have an increased risk of type 2 diabetes, hypertension, dyslipidaemia and carotid-artery atherosclerosis( Reference Juonala, Magnussen and Berenson 13 ). Importantly, risk of adverse outcomes does not persist if children are no longer obese in adulthood( Reference Juonala, Magnussen and Berenson 13 ), highlighting the importance of early population-based interventions.
Optimizing a child’s diet before the age of 2 years may be critical in preventing obesity and obesity-related diseases( Reference Barker 14 ) as inappropriate early eating behaviours established during the complementary feeding period (weaning) and the first few years of life may persist( Reference Birch, Savage and Ventura 15 , Reference Moorcroft, Marshall and McCormick 16 ). It is important to understand the early risk factors for obesity and develop effective interventions for parents and their offspring supporting healthy weight behaviours( Reference Lobstein, Baur and Uauy 17 ). With this in mind, we aimed to explore associations between dietary intake at age 12, 18 and 36 months with BMI Z-score at age 36 months in a bi-ethnic sample of White British- and Pakistani-origin infants and children, alongside examining ethnic differences in dietary intake and BMI Z-score at age 36 months.
Methods
Participants and study design
The Born in Bradford (BiB) study is a longitudinal, multi-ethnic birth cohort study designed to examine the impact of environmental, psychological and genetic factors on maternal and child health and well-being( Reference Wright, Small and Raynor 18 ). Bradford is the sixth largest city in the UK, with a population of about 500 000 and high rates of childhood morbidity and mortality( Reference Wright, Small and Raynor 18 ). Compared with the national average infant mortality rate in 2003 of 5·5 deaths/1000 live births, in Bradford it peaked at 9·4 deaths/1000 live births( Reference Wright, Small and Raynor 18 ). BiB was created in response to rising concerns about the high rates of childhood morbidity and mortality in Bradford. Between March 2007 and December 2010, 12 453 women comprising 13 776 pregnancies were recruited to the BiB cohort. Mothers were recruited at 26–28 weeks’ gestation within Bradford Royal Infirmary while waiting for their routine glucose tolerance test.
The Born in Bradford 1000 cohort (BiB1000) is a sub-sample of the full BiB cohort specifically examining the determinants of childhood obesity( Reference Bryant, Santorelli and Fairley 19 ). From August 2008 to March 2009, all mothers recruited to the full BiB cohort were eligible for participation in BiB1000. This study involved further assessments at 6, 12, 18, 24 and 36 months of age, including detailed measurements of anthropometry and social, behavioural and environmental factors that were hypothesized to relate to obesity development( Reference Bryant, Santorelli and Fairley 19 ). Dietary data were collected when children were aged 12, 18 and 36 months.
Measurements
Dietary intake at 12 and 18 months
Dietary data were collected when children were aged 12 and 18 months using a validated parent-reported FFQ from the Southampton Women’s Survey cohort study( Reference Marriott, Inskip and Borland 20 ). The questionnaire was adapted for BiB1000 to reflect dietary intake within the multi-ethnic population of Bradford, based on findings from 24 h dietary recalls in the area, and resulted in eight additional items (chapattis (white flour), chapattis (wholemeal flour), boiled rice, fried rice, semolina pudding, milk-based puddings, sponge puddings and other vegetables (e.g. okra, aubergine)). The resulting FFQ therefore included a list of ninety-eight food items, allowing the frequency of consumption and amounts consumed over the preceding month to be recorded( Reference Sahota, Gatenby and Greenwood 21 ). The response categories for each food were ‘never’ (recorded as 0), ‘less than once a week’ (recorded as 0·5), ‘food eaten weekly’ (recorded as the number of times per week) and ‘food eaten more than once a day’ (recorded as the number of times per day). An open response section in the same format was included to allow frequencies of consumption and amounts of any foods that are not listed in the ninety-eight foods. Flash cards were used to show the foods included in each food group, to promote standardized responses to the FFQ. Household utensils (tablespoons, teaspoons, bowls and feeding beakers) were used to estimate portion sizes and quantities of foods and drinks consumed. The FFQ was administered by a team of multilingual community research administrators, who were trained by dietitians.
For the purposes of analysis at 12 and 18 months, thirteen key indicator food categories were formed from the ninety-eight foods. The key indicator foods were defined as those consumed by this age group as identified through dietary surveys( Reference Sahota, Gatenby and Greenwood 22 ) and associated with high energy density (high fat, high sugar) and low energy density (high fibre, low fat, low sugar), and therefore assumed to have a plausible role in obesity development(23). The key indicator foods (Table 1) were selected on the basis of their contribution to dietary patterns associated with the development of obesity( Reference Sahota, Gatenby and Greenwood 21 ).
List of key indicator foods and categorizations of consumption at 12, 18 and 36 months

Dietary intake at 36 months
The 36-month validated FFQ was a modified version of the Survey of Sugar Intake among Children in Scotland study( Reference Sheehy, McNeill and Masson 24 ). This FFQ included questions on 140 types of food and drink within sixteen categories. Parents were asked to describe their child’s diet over the previous two to three months, including all main meals, snacks and drinks. It also included any foods and drinks their child consumed outside their home (e.g. at school or nursery, out-of-school clubs, restaurants, cafés or with family and friends). Descriptions of portion sizes were provided to help parents estimate the quantities of their child’s food intake (e.g. small bowl, slice, teaspoon, small slice, medium glass and small glass). The response categories were ‘rarely or never’, ‘1–2 per month’, ‘1 per week’, ‘2–3 per week’, ‘4–6 per week’, ‘1 per day’, ‘2–3 per day’, ‘4–6 per day’ and ‘7 or more per day’ and these were recorded as 1–9, respectively. For the purposes of analysis, the responses were converted to daily totals. As with the 12- and 18-month analysis, key indicator food categories were created; defined as those consumed by this age group as identified through dietary surveys( 25 ) and associated with high energy density (high fat, high sugar) and low energy density (high fibre, low fat, low sugar), and therefore assumed to have a plausible role in obesity development( Reference Sharma, Kolahdooz and Butler 23 ) (Table 1). Of the 140 foods captured in the FFQ, ninety-five were used for the analysis; in some cases the food groupings were those used in the FFQ (e.g. fruit) and in other cases foods from different categories were combined for consistency with the 12- and 18-month groupings (e.g. ‘cakes’ was a combination of ‘biscuits and cakes’, ‘desserts’ and ‘sweets, chocolates and ice cream’). Some foods were also split within their own categories; meat and fish for example were split into non-processed and processed foods. The list of key indicator foods was not identical to those used at 12 and 18 months due to the necessity of using a validated age-appropriate FFQ.
Ethnicity
Maternal and child ethnicity was self-assigned by the mother at the baseline assessment (26–28 weeks’ gestation) using the same ethnic group classification as the 2001 UK census( 26 ) and categorized into White British, Pakistani, Other South Asian (Indian, Bangladeshi) and Other ethnicities (White other, Black, mixed race, other unspecified). Due to the smaller numbers within the other ethnic groups in the sample, data are presented for the two larger groups at 12 months (White British, 38 %; Pakistani, 49 %), 18 months (White British, 37 %; Pakistani, 49 %) and 36 months (White British, 38 %; Pakistani, 48 %).
BMI Z-score
Weight (in kilograms) and height (in metres) were measured by trained researchers when children were aged 36 months. Age- and gender-adjusted BMI (= [weight (kg)]/[height (m)]2) Z-scores were then calculated based on the WHO 2006 standards( 27 ).
Data analysis
The frequencies of consumption of key indicator foods at age 12, 18 and 36 months were tabulated across children’s BMI Z-score at age 36 months for the full sample and by ethnic group; see Tables 2 and 3 for the median frequency and interquartile range (IQR) of consumption for each key indicator food by ethnic group. Although the FFQ assesses both frequency and quantity, we chose to evaluate frequency of consumption of foods as this was deemed more appropriate to identify and inform key public health messages. Quantitative recommended dietary intake guidelines do not currently exist for all the key indicator foods for this age group in the UK, so it was not possible to categorize intake into those meeting or not meeting recommended intake levels. A pragmatic approach to defining cut-offs was therefore used to define high and low intakes, where intakes were dichotomized into consumer/non-consumer (i.e. zero intake/any intake) and below and equal to/above the median intake for that key indicator food (i.e. lower intake/higher intake); see Table 1. Foods with a median intake of zero were those dichotomized into consumer/non-consumer and foods with a median intake of greater than zero were those dichotomized into below and equal to/above the median intake. Cross-tabulation of ethnicity against the categorizations (high and low consumption) of each food at 12, 18 and 36 months is shown in the online supplementary material, Supplemental Table 1. Also shown are P values from χ 2 tests of independence between ethnicity and consumption for each food group, using a false discovery rate correction for multiple testing.
Key indicator food consumption at 12 and 18 months, split by ethnicity: White British and Pakistani children from the Born in Bradford 1000 study (Bradford, UK), August 2008–March 2009

IQR, interquartile range.
* Consumption of any or none.
† Consumption of >median or ≤median.
Key indicator food consumption at 36 months, split by ethnicity, with logistic regression model properties: White British and Pakistani children from the Born in Bradford 1000 study (Bradford, UK), August 2008–March 2009

IQR, interquartile range.
* Consumption of any or none.
† Consumption of >median or ≤median.
Multiple linear regression was used to model associations between consumption of key indicator foods at age 12, 18 and 36 months with BMI Z-score at age 36 months, adjusted for ethnicity, gender and birth weight, with BMI Z-score at age 36 months being the response variable and ethnicity, gender and birth weight plus key indicator food consumption variables being predictors in the models. Multiple logistic regression was used to model associations between ethnicity and consumption of key indicator foods at age 36 months. The coefficients for the key indicator foods in Tables 4–6 represent the change in 36-month BMI Z-score for children consuming those foods or those consuming those foods more than the median frequency time (i.e. an increased consumption). The intercept represents a baseline BMI Z-score value and an effect for Pakistani children; the ethnicity variable represents the difference in BMI Z-score for White British children. Ethnic difference in 36-month BMI Z-score, adjusted for dietary intake, gender and birth weight, was assessed using these linear regression models, utilizing the coefficients and associated CI for ethnicity.
Key indicator food consumption at 12 months, with linear regression model properties and mean 36-month BMI Z-scores: White British and Pakistani children from the Born in Bradford 1000 study (Bradford, UK), August 2008–March 2009

IQR, interquartile range; Coeff., coefficient.
* Consumption of any or none.
† Consumption of >median or ≤median.
Key indicator food consumption at 18 months, with linear regression model properties and mean 36-month BMI Z-scores: White British and Pakistani children from the Born in Bradford 1000 study (Bradford, UK), August 2008–March 2009

IQR, interquartile range; Coeff., coefficient.
* Consumption of any or none.
† Consumption of >median or ≤median.
Key indicator food consumption at 36 months, with linear regression model properties and mean 36-month BMI Z-scores: White British and Pakistani children from the Born in Bradford 1000 study (Bradford, UK), August 2008–March 2009

IQR, interquartile range; Coeff., coefficient.
* Consumption of any or none.
† Consumption of >median or ≤median.
The statistical software package R version 2.15.1 (2012) was used for the analyses.
Results
From the 1916 mothers who were invited, 1735 (91 %) agreed to take part in BiB1000. For the current study, participants were excluded if they had multiple births (n 28; fifty-six infants), missing child dietary data, missing child BMI Z-score at age 36 months or were not of White British or Pakistani ethnicity. The sample therefore consists of 722 singleton infants with 12-month data, 779 children with 18-month data and 845 children with 36-month data.
Table 7 provides information on the characteristics of the sample. Data are presented for White British and Pakistani infants only, as they form the largest ethnic groups in the population of interest. Birth weight (grams) and 36-month BMI Z-scores have been summarized, split by ethnicity and gender, for the three time points of interest. There were a number of statistically significant differences between ethnicity and gender with respect to 36-month BMI Z-score and birth weight; therefore including ethnicity, gender and birth weight as confounders in the linear regression models was justified.
Characteristics of the sample of White British and Pakistani children from the Born in Bradford 1000 study (Bradford, UK), August 2008–March 2009

IQR, interquartile range.
Exploring dietary intake and patterns between 12, 18 and 36 months
Table 3 presents the associations between consumption of the key indicator foods at 36 months and ethnicity. OR are presented for Pakistani infants compared with White British infants. There were a number of statistically significant differences at 36 months, with Pakistani infants more likely to consume high-fat chips, processed fish, fruit and water (OR (95 % CI): 0·15 (0·09, 0·24), 0·32 (0·20, 0·51), 0·49 (0·31, 0·76) and 0·31 (0·20, 0·48), respectively) than White British infants. White British infants were more likely to consume low-fat milk, low-fat chips, non-processed meat, processed meat, low-sugar drinks and low-sugar cereals (OR (95 % CI): 2·70 (1·73, 4·23), 4·91 (3·09, 7·93), 3·23 (2·08, 5·06), 9·22 (5·67, 15·42), 3·22 (2·11, 4·97) and 1·76 (1·15, 2·68), respectively) than Pakistani infants.
Associations of key indicator food consumption at 12 months with 36-month BMI Z-scores
Table 4 shows the median frequency of consumption and associated IQR for the key indicator foods at age 12 months in White British and Pakistani infants (n 722) and associations between consumption of key indicator foods by infants aged 12 months with BMI Z-score at age 36 months, adjusted for ethnicity, gender and birth weight. There were no significant associations between consumption of any key indicator food groups at age 12 months and BMI Z-score at age 36 months.
Associations of key indicator food consumption at 18 months with 36-month BMI Z-scores
Table 5 shows the median frequency of consumption and associated IQR for the key indicator foods at age 18 months in White British and Pakistani children (n 779) and associations between consumption of key indicator food groups by children aged 18 months and BMI Z-score at age 36 months, adjusted for ethnicity, gender and birth weight.
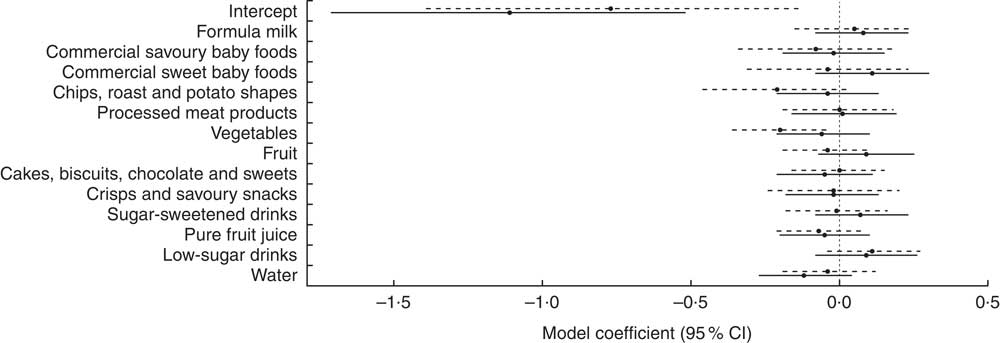
Intake of vegetables at 18 months was associated with BMI Z-score at age 36 months (model coefficient (95 % CI): −0·20 (−0·36, −0·03)), with children who consumed vegetables more frequently than the median time (6·0 (IQR 4·0–7·0) times/d) at age 18 months being more likely to have a lower BMI Z-score at age 36 months than children consuming vegetables less frequently than or equal to the median time. Intake of other key indicator foods at age 18 months was not related to BMI Z-score at age 36 months.
With assessment of the same key indicator foods at 12 and 18 months, the effect sizes and CI can be directly compared over time (Fig. 1). Confidence intervals to the right of the vertical dashed line at zero in Fig. 1 show variables which are associated with an increase in 36-month BMI Z-score, whereas those to the left show variables which are associated with a decrease in 36-month BMI Z-score. The upper limit for the vegetables CI at 18 months lies below zero, indicating a negative association and therefore that a higher consumption of vegetables at 18 months is associated with a lower BMI Z-score at 36 months. In addition, the CI at 12 and 18 months for each key indicator food overlap substantially, indicating no inconsistent effects of diet at age 12 and 18 months on BMI Z-score at 36 months.
Comparison of effect sizes (![]() ) and 95 % CI (represented by horizontal lines) of consumption of key indicator foods at 12 months (
) and 95 % CI (represented by horizontal lines) of consumption of key indicator foods at 12 months (![]() ) and 18 months (
) and 18 months (![]() ) on BMI Z-score at age 36 months among White British and Pakistani children from the Born in Bradford 1000 study (Bradford, UK), August 2008–March 2009
) on BMI Z-score at age 36 months among White British and Pakistani children from the Born in Bradford 1000 study (Bradford, UK), August 2008–March 2009
Associations of key indicator food consumption at 36 months with 36-month BMI Z-scores
Table 6 shows the median frequency of consumption and the IQR for the key indicator foods at age 36 months in White British and Pakistani children (n 845) along with the associations between consumption of key indicator foods by children aged 36 months and BMI Z-score at age 36 months, adjusted for ethnicity, gender and birth weight.
Children consuming high-fat chips more frequently than the median frequency at age 36 months (0·4 (IQR 0·2–0·7) times/d) were more likely to have lower BMI Z-scores at age 36 months than those consuming high-fat chips less frequently than or equal to the median frequency (model coefficient (95 % CI): −0·16 (−0·32, 0·00)). There remained an association between vegetable intake and 36-month BMI Z-score (model coefficient (95 % CI): −0·16 (−0·31, −0·02)), with children consuming vegetables more frequently than the median frequency at age 36 months (2·4 (IQR 1·4–3·6) times/d) being more likely to have a lower BMI Z-score at age 36 months than children consuming vegetables less frequently than or equal to the median frequency. Intake of other key indicator foods at age 36 months was not related to BMI Z-score at age 36 months; although a weak association was found between consumption of non-processed fish and 36-month BMI Z-score, where children consuming non-processed fish more frequently than the median frequency at age 36 months (0·1 (IQR 0·0–0·3) times/d) were more likely to have higher BMI Z-scores at age 36 months than those consuming non-processed fish less frequently than or equal to the median frequency (model coefficient=0·14 (95 % CI −0·01, 0·29)).
Ethnic differences in 36-month BMI Z-scores
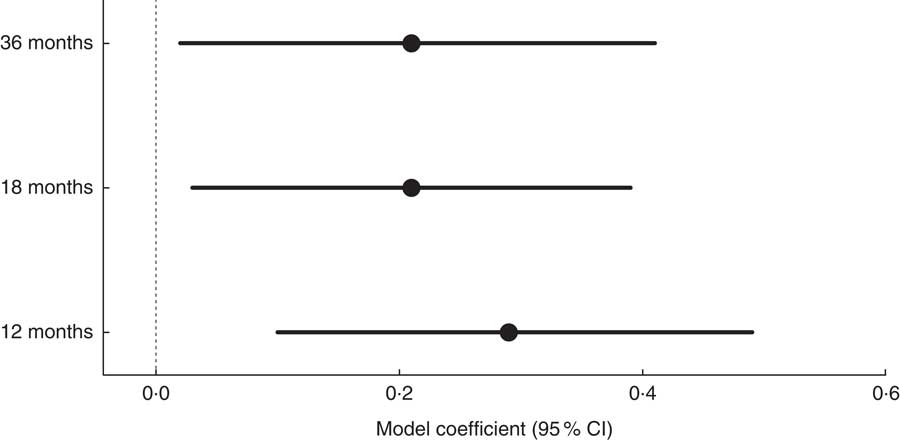
Ethnic differences in 36-month BMI Z-scores were consistent regardless of which dietary data (12, 18 and 36 months) were included in the model. Figure 2 shows the comparison of the ethnicity effect sizes and CI at 12, 18 and 36 months on 36-month BMI Z-score. These estimates were obtained from the linear regression models (Tables 4–6) where ethnicity was used as a confounder and represent the difference in BMI Z-score (White British – Pakistani children). White British children had a higher mean 36-month BMI Z-score than Pakistani children when adjusted for gender, birth weight and dietary intake at age 12, 18 and 36 months (model coefficient (95 % CI): 0·29 (0·10, 0·49), 0·21 (0·03, 0·39) and 0·21 (0·02, 0·41), respectively). These results suggest that ethnic differences in growth patterns such as BMI and weight which have been shown to exist at birth are likely to continue to at least 36 months of age.
Comparison of the ethnicity effect sizes (![]() ; White British – Pakistani children) and 95 % CI (represented by horizontal lines) at 12, 18 and 36 months on 36-month BMI Z-score among White British and Pakistani children from the Born in Bradford 1000 study (Bradford, UK), August 2008–March 2009
; White British – Pakistani children) and 95 % CI (represented by horizontal lines) at 12, 18 and 36 months on 36-month BMI Z-score among White British and Pakistani children from the Born in Bradford 1000 study (Bradford, UK), August 2008–March 2009
Discussion
In our study, White British children had higher BMI Z-scores at age 36 months compared with Pakistani children, consistent with other data stating Pakistani infants are lighter and have shorter lengths than White British infants at birth( Reference Fairley, Petherick and Howe 28 – Reference Deurenberg, Yap and Van Staveren 32 ). This demonstrates that ethnic differences in growth characteristics (weight and height) are present from birth to at least 36 months of age. Our research also provides evidence that higher intake of vegetables at ages 18 and 36 months is associated with a lower BMI Z-score at age 36 months. Previous literature in this area is inconsistent, which could be attributed to heterogeneity in populations, particularly differences in age groups. Inconsistent findings have been identified in a previous systematic review( Reference Ambrosini 33 ) indicating dietary patterns that are high in energy-dense, high-fat and low-fibre foods predispose young people to later overweight and obesity. That review also highlighted that examining multiple dietary factors within a dietary pattern may better explain obesity risk than individual nutrients or foods. Some literature suggests that the evidence of a relationship between vegetable consumption and BMI is inconsistent, especially among children( Reference Lin and Morrison 34 ); however, others report negative associations between fruit and vegetable consumption and BMI/obesity( Reference Lakkakula, Zanovec and Silverman 35 , Reference Shields 36 ). On balance, early introduction of vegetables in infant diets is warranted, not only due to its possible association with a reduction in BMI Z-score but also for its contribution towards a healthy balanced diet (e.g. high fibre, vitamin A and vitamin C, lower energy density). It is however unknown whether encouraging fruit and vegetable consumption displaces other high energy-dense foods in diets.
Dietary intakes for infants and children aged 12 and 18 months in this sample have been discussed previously( Reference Sahota, Gatenby and Greenwood 21 ), showing that consumption of foods high in sugar and fat is evident in diets before age 36 months. Foods such as chips; roast potatoes and potato shapes; cakes, biscuits, chocolates and sweets; crisps and savoury snacks; and processed meat products featured regularly in the diets of children. At 12 months Pakistani infants were more likely to consume fruit and chips or potatoes (adjusted OR (95 % CI): 2·20 (1·70, 2·85) and 2·75 (2·09, 3·62), respectively) but less likely to consume processed meat products than White British infants (0·11 (0·08, 0·15))( Reference Sahota, Gatenby and Greenwood 21 ). At 18 months, Pakistani infants were more likely to consume fruit, chips or potatoes and water (adjusted OR (95 % CI): 1·40 (1·08, 1·81), 2·26 (1·50, 3·43) and 3·24 (2·46, 4·25), respectively) but less likely to consume processed meat products than White British infants (0·10 (0·06, 0·15))( Reference Sahota, Gatenby and Greenwood 21 ). These patterns are shown to still be present at 36 months, indicating that ethnic differences in food consumption start early (12 and 18 months) and continue at 36 months. Here we have shown additional dietary data at age 36 months (Table 6) indicating persistent patterns, with median consumption of cakes and high-sugar drinks of 2·1 and 2·0 times/d, respectively. However, there is evidence to suggest the ‘five fruit and vegetables a day’ message may be starting to get through, with median consumption of 6·0 times/d (fruit 3·2 and vegetables 2·4). Although children eating fruit and vegetables on more than five occasions per day is encouraging, we should not confuse this result with five portions per day since the quantity eaten is not included in our analysis. Even so, five times per day is beneficial because this should displace other unhealthier foods at this young age( Reference Thompson, Ferry and Cullen 37 – 40 ). We acknowledge that looking at dietary patterns (e.g. a combination of foods consumed) might be better at reflecting associations with weight rather than individual foods (or food groups), as has been previously suggested( Reference Ambrosini 33 ), but for consistency with the analysis performed at 12 and 18 months( Reference Sahota, Gatenby and Greenwood 21 ) and in order to perform comparisons, food groups (a combination of similar foods) were used instead.
Our research suggests that relationships between 36-month BMI Z-score and key indicator foods are present at 18 and 36 months; however, using cross-sectional data means causality cannot be established. This was apparent in anticipated foods such as vegetables, but we also found other, more unexpected, associations between intake of non-processed fish (grilled or poached white fish, fried oily fish, smoked oily fish, tinned tuna, tinned salmon, sardines, mackerel, pilchards and prawns) and high-fat chips at age 36 months and BMI Z-score at age 36 months; related to higher and lower BMI Z-scores, respectively. These unexpected results could be attributed to our method of dietary assessment; on the other hand, previous literature has reported high intake of fish products is associated with an increased body weight status in school-aged children due to accumulation of fat-free mass( Reference Pei, Flexeder and Fuertes 41 ). We considered whether the level of breast-feeding in this age group was more important than diet but previous research in this sample has shown there are no associations between infant feeding practices and BMI at 3 years( Reference Santorelli, Fairley and Petherick 42 ).
Research exists reporting that obese children eat chips more frequently than normal-weight children( Reference Danielzik, Czerwinski-Mast and Langnäse 43 ), offering French fries and similar potato products in school meals more than once per week is associated with a significantly higher likelihood of obesity( Reference Fox, Dodd and Wilson 44 ) and higher BMI Z-scores are strongly associated with the consumption of high-fat foods (including chips and French fries)( Reference Millar, Rowland and Nichols 45 ); our research appears to disagree with these results and goes against intuition. More research is warranted in this population to fully investigate the relationship between consumption of high-fat chips and obesity (BMI Z-score).
Our identified relationships between diet and 36-month BMI Z-score contribute to evidence highlighting the importance of appropriate diets for all children from a young age( Reference Ambrosini 33 ). As promoting consumption of vegetables is notoriously more difficult than promoting consumption of fruit( Reference Chambers 46 ), it is encouraging to note in our sample that children aged 36 months were reported to consume vegetables on average almost two-and-a-half times per day and fruit and vegetables six times per day. With inappropriate eating behaviours established early in life( Reference Birch, Savage and Ventura 15 , Reference Moorcroft, Marshall and McCormick 16 ), the early introduction of foods associated with a decrease in BMI Z-score is essential. The results presented regarding the association between vegetable consumption and 36-month BMI Z-score leaves the question of what interventions could be encouraged. Possibilities are parents setting an example, the one bite rule and rewarding attempts to eat vegetables( Reference Rose 47 ). Repeated exposure is a simple effective technique that can be used to improve acceptance of novel vegetables( Reference Caton, Ahern and Remy 48 ). Other aspects of a child’s diet can be improved by eating a healthy breakfast, healthier snacks (e.g. fewer crisps and biscuits), making water the drink of choice, eating meals together and allowing children to get involved in the preparation of meals( 49 ).
The present study has highlighted ethnic differences in BMI Z-score in early childhood, consistent with previous research on growth patterns( Reference Fairley, Petherick and Howe 28 , Reference Mebrahtu, Feltbower and Petherick 29 ). Ethnic disparities in obesity prevalence are already present by the pre-school years, suggesting that disparities in childhood obesity prevalence may have their origins in the earliest stages of life( Reference Dixon, Pena and Taveras 50 ). Previous research has shown associations between dietary intake during infancy and the early childhood period by ethnicity in the BiB sample( Reference Sahota, Gatenby and Greenwood 21 ), with consumption patterns of processed meat products, fruit and chips or potatoes being evident in White British and Pakistani infants at 12 months and increasing by 18 months of age, and further consumption patterns in water and low-sugar drinks being established at 18 months( Reference Fox, Pac and Devaney 21 ). Research by the Avon Longitudinal Study of Parents and Children (ALSPAC) has also reported an impact of early nutrition on excess growth( Reference Emmett and Jones 51 ). In one study, breast-feeding status was associated with later obesity, although this was predominantly observed later, when children were of school age( Reference Hughes, Sherriff and Lawlor 52 ). It is possible that differences in the data between ALSPAC and BiB are due to differences in ethnicity between the cohorts (e.g. 71 % of the ALSPAC participants were White). It is also possible that the trajectory of excess weight gain in BiB children would continue to increase after school entry, but data are not available to test this hypothesis.
We have identified associations between consumption of some foods and BMI Z-score in early childhood. Further research is warranted to determine whether associations are maintained in later childhood.
Our study included a large bi-ethnic sample with longitudinal exposure data collected at 12, 18 and 36 months of age. Dietary data may have been affected by use of a parent-reported FFQ( Reference Marriott, Inskip and Borland 20 , Reference Sheehy, McNeill and Masson 24 ), which may be prone to overestimation of some foods and underestimation of others. Assessment of dietary intake via FFQ in large cohort studies is common( Reference Robinson, Marriott and Crozier 53 – Reference Leventakou, Georgiou and Chatzi 55 ) and is a standard, feasible approach in large samples( Reference Cade, Thompson and Burley 56 ). Further, two validated questionnaires were used( Reference Marriott, Inskip and Borland 20 , Reference Sheehy, McNeill and Masson 24 ). To our knowledge, there is no systematic error in reporting within FFQ by ethnicity( Reference de Hoog, Kleinman and Gillman 57 ).
A limitation of the present study is that infants and children of White British and Pakistani ethnicity only were included in the analysis, constituting only two ethnicities and one South Asian group. Due to the heterogeneous nature of this ethnic group, the data cannot be generalized to other South Asian infants and children. In addition, our study used data from only one UK geographical region, Bradford, and the results presented may not be generalizable to other areas. We accept that BMI Z-score may not be the most appropriate measure to use as BMI does not directly measure adiposity( Reference Cespedes 58 ). Given that previous BiB literature( Reference Fairley, Petherick and Howe 28 , Reference Mebrahtu, Feltbower and Petherick 29 ) reporting differences in Pakistani and White British infants’ growth measurements exists, a more suitable indicator for obesity such as percentage body fat could be used.
Stratified analysis by utilizing two-way interaction terms in our linear regression models (ethnicity with each key indicator food) was considered. However, the two-way interaction terms were all insignificant, meaning the stratified analysis provided equivalent conclusions to the models without interaction terms. Therefore, the simpler models were presented as they gave better estimates of the effect sizes by pooling the ethnicities, hence increasing the sample size and giving smaller standard errors and more precise estimates.
It has been suggested that dietary patterns which emerge early( Reference Smithers, Brazionis and Golley 59 ) track through infancy( Reference Robinson, Marriott and Poole 60 ), into later childhood( Reference Northstone and Emmett 61 ), and persist into adulthood( Reference Mikkila, Rasanen and Raitakari 62 ). Findings in the present study imply the importance of early-life exposures, with some evidence of associations between dietary intake and 36-month BMI Z-score being established early in life (18 and 36 months). This is an important conclusion as other studies which have shown relationships between food consumption and growth( Reference Dennison, Rockwell and Baker 63 ) have tended to focus on children of school age or older rather than pre-school children( Reference Collison, Zaidi and Subhani 64 – Reference Taveras, Berkey and Rifas-Shiman 66 ), or focused solely on growth characteristics( Reference Freedman, Khan and Serdula 67 , Reference Ogden, Carroll and Curtin 68 ) or diet( Reference Fox, Pac and Devaney 22 , Reference Fox, Condon and Briefel 69 ). These results should be used as a foundation to investigate relationships in other populations and links to BMI later in life. With the prediction that 20 % of all boys and 33 % of all girls will be obese by 2020( 5 ), it is important to use the information from studies such as the present one to develop tailored obesity prevention interventions aimed at pregnant women and new parents.
Conclusion
We found ethnic differences in BMI Z-score at age 36 months in our sample; in addition we found some evidence that dietary intake during infancy and early childhood is associated with BMI Z-score at age 36 months.
This information adds to the evidence base of the importance of diet in early childhood and supports the development of tailored interventions aimed to support parents and carers to optimize early healthy weight behaviours. Further research is required to establish the influence of these dietary patterns in infancy and early childhood on later health outcomes, including childhood obesity, across other ethnic groups.
Acknowledgments
Acknowledgements: The authors are grateful to all families who took part in this study, the midwives for their help in recruiting them, the paediatricians and health visitors, and the Born in Bradford team which included interviewers, data managers, laboratory staff, clerical workers, research scientists, volunteers and managers. Financial support: This research received no specific grant from any funding agency in the public, commercial or not-for-profit sectors. Conflict of interest: The authors declare no conflict of interest. P.S. and M.B. had some financial support from a National Institute of Health Research (NIHR) Collaboration for Leadership in Applied Health Research and Care (CLAHRC) implementation grant and/or an NIHR applied programme grant (RP-PG-0407-10044) for the submitted work, but have had no financial relationships with any organizations that might have an interest in the submitted work in the previous 3 years and no other relationships or activities that could appear to have influenced the submitted work. Authorship: All authors contributed to the interpretation of the results and write-up and have read and approved the final version. M.B. and P.S. designed the research, trained the data collection staff, provided oversight in data collection, interpreted results and supported the manuscript preparation. S.M. conducted the analysis, interpreted the data and led the writing of the manuscript. S.B. provided oversight to the analysis, contributed to data interpretation and reviewed the manuscript. Ethics of human subject participation: Ethical approval was granted by Bradford Research Ethics Committee (reference number 07/H1302/112) and all participants provided written informed consent (including allowing access to routine data collection) prior to inclusion in the research.
Supplementary material
To view supplementary material for this article, please visit https://doi.org/10.1017/S1368980018000654


