




1. Introduction
Frisian, Town Frisian, and Low Saxon are closely related West Germanic languages spoken in the northern and eastern Netherlands. Speakers of these regional varieties are (usually) also Standard Dutch speakers, which is the official language in the Netherlands. These regional languages have been converging to Standard Dutch on different linguistic levels since the middle of the twentieth century (Heeringa & Hinskens, Reference Heeringa and Hinskens2015), and there is further evidence specifically on the pronunciation level since the 1980s (Buurke et al., Reference Buurke, Sekeres, Heeringa, Knooihuizen and Wieling2022). It is common for European regional languages to become more similar to respective standard languages, which often become more similar to their standard languages through borrowing lexical and phonological features (Auer et al., Reference Auer, Hinskens and Kerswill2005; Grant, Reference Grant and Taylor2015). This type of convergence usually results from a combination of factors, such as the standard language’s prestige, negative prejudices about dialects and their speakers, and much stronger institutional support for the national standard language. Within such contexts, people are usually pressured to limit their regional language use to close interpersonal settings only, and they are discouraged from transferring their language to their children.
At the same time, differences between traditional dialects are also decreasing in many areas. Such directional patterns of language change can indicate the formation of so-called “regiolects” (Hoppenbrouwers, Reference Hoppenbrouwers1990), which are language varieties between the traditional highly localized dialects and the standard language (for example, to varying degrees for Limburgish, Zeelandic, Brabantish, and Flemish: Van de Velde et al., Reference Van de Velde, Wijngaard, Schrier, Swanenberg and de Tier2008; Vandekerckhove, Reference Vandekerckhove2009; De Caluwe & Van Renterghem, Reference De Caluwe and Van Renterghem2011; Swanenberg & Van Hout, Reference Swanenberg, Van Hout, Hinskens and Taeldeman2013). Such language variants typically retain features from the traditional dialects, but they are often simultaneously more similar to the standard language. In this contribution, we assessed whether there was evidence for regiolect formation in recent decades for Frisian, Town Frisian, and Low Saxon, specifically concerning broad pronunciation patterns (i.e. at the level of phonemes). We compared phonetic transcriptions made of sound recordings from the 1980s (abbreviated as GTRP, after the project name Goeman-Taeldeman-Van Reenen-project: Taeldeman & Goeman, Reference Taeldeman and Goeman1996) and a set of new sound recordings we collected in 2022 and 2023. The newer recordings were collected using a mobile laboratory, SPRAAKLAB (Rebernik et al., Reference Rebernik, Jacobi, Buurke, Tienkamp, Abur and Wieling2025), so we refer to this corpus as the SPRAAKLAB corpus.
1.1. Comparing phonetic corpora across time
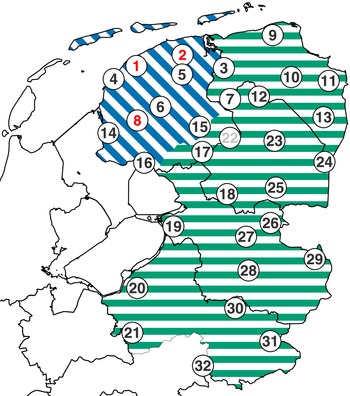
In our assessment of regiolect formation and pronunciation change direction, we attempted to improve upon earlier real-time studies of language change in this geographical area (see Figure 1). Real-time studies are often expensive and difficult to carry out satisfactorily due to the longer project duration and difficulty finding suitable participants (Tillery & Bailey, Reference Tillery and Bailey2003). So-called apparent-time studies are consequently more common, in which speakers from different ages are sampled at the same time, but these studies do not resample the speech community over time and cannot directly confirm language change of the community (Sankoff, Reference Sankoff and Brown2006:112). The apparent-time hypothesis also requires that individual language systems are stable past adolescence, but there is substantial evidence of language change at later ages (Blondeau, Reference Blondeau2001; Sankoff & Blondeau, Reference Sankoff and Blondeau2007; Sankoff, Reference Sankoff2019). Apparent-time studies are useful for other purposes, however, such as assessing whether an ongoing change is experienced by different age groups simultaneously. In our case, we are interested in community language change and therefore prefer a real-time approach. However, this required strictly controlling for speaker characteristics, such as a speaker’s age, gender, and location of growing up. We therefore ensured that the speakers newly recorded in this project had the same gender as their GTRP reference speakers, and ensured they were within three years of the sampling age and grew up within ten kilometers of the location where the GTRP reference speakers grew up.Footnote 1
Map of the GTRP reference locations, for which matching speakers were found in 2022 and 2023. The Frisian area is marked in blue with diagonal lines and the Low Saxon in green with horizontal lines. Town Frisian varieties, mixed varieties between Hollandic and Frisian (Versloot, Reference Versloot, de Velde, Hilton and Knooihuizen2021), are indicated by a red number. The place names are provided in Table 1.

We closely matched the data collection method of the GTRP, because mismatches between methods have been problematic before. Different large-scale regional language data collections (e.g. Taeldeman & Goeman, Reference Taeldeman and Goeman1996; Heeringa & Hinskens, Reference Heeringa and Hinskens2015) used different tasks to elicit speech data. For example, speakers were asked to translate isolated single words for the GTRP, while they were asked to translate sentences in a story for the corpus of Heeringa & Hinskens (Reference Heeringa and Hinskens2015). Buurke et al. (Reference Buurke, Sekeres, Heeringa, Knooihuizen and Wieling2022) found that comparing these collections results in a less accurate analysis. The pronunciation environment of isolated words is relatively controlled, which makes it easier to compare pronunciations of the same target word. Sentences reflect natural speech better, but target words in the sentences are influenced by surrounding words and processes that support speaking economically. These task choices make it difficult to compare these corpora. We ensured that the task for the SPRAAKLAB corpus was comparable to the older GTRP corpus by using overlapping target words in isolation, which ensured a greater probability of detecting changes across this longer period.
The GTRP covered a large geographical area, including the entire Netherlands and the Flanders region in Belgium, which required the assistance of many people (i.e. 45 field workers and 29 transcribers). However, 40 percent of the transcriptions were made by only two transcribers. Earlier studies found that there are transcriber effects in the corpus (Hinskens & Van Oostendorp, Reference Hinskens and Van Oostendorp2006), which is reflected by the fact that 73 unique symbols are used for the GTRP transcriptions for the Netherlands, while only 44 symbols are used for the Belgian part of the corpus (Wieling, Reference Wieling2007:104). These effects can be minimized by iteratively replacing infrequently occurring phonetic symbols in the corpus data (Wieling & Nerbonne, Reference Wieling and Nerbonne2015; Buurke & Wieling, Reference Buurke and Wieling2023), but the problem is best avoided altogether. We achieved this by ensuring that a single transcriber made all transcriptions for the GTRP and SPRAAKLAB recordings.
For most GTRP locations, only a single speaker was recruited per location. The Standard Dutch list that GTRP speakers were asked to translate into their local dialect consisted of over 1800 items, so their language system is likely appropriately sampled. At the same time, the single reference speaker contacted for the GTRP was not necessarily a highly representative speaker of the local dialect. We have tried to find at least two speakers per location for the newly collected corpus, each of which translated Standard Dutch target words into their dialect. This was successful for all locations except one, and we found at least three speakers for more than a third of the reference locations. The speakers were strictly matched with the GTRP speaker for age, gender, and the geographical location where they grew up. This is important, because if the age difference between the GTRP speaker and the SPRAAKLAB speakers is too large, it cannot be ascertained whether any detected change is age-related or due to language change.
1.2. Assessing evidence of regiolect formation
It is worth noting that there are different potential developmental paths for regiolects. A possible scenario is that (neighboring) dialects become more similar without any outside pressure of a standard language, but this is rare in Europe (Auer, Reference Auer, Boberg, Nerbonne and Watt2018:163). More often, dialects converge towards the standard language and simultaneously become more similar to neighboring dialects (e.g. Heeringa & Hinskens, Reference Heeringa and Hinskens2015) due to concurrent replacement of dialect features with standard language features. This widespread convergence often coincides with local divergence patterns for some varieties, especially around national borders (Smits, Reference Smits2011). In this study, we do not attempt to determine what developmental path was followed for a particular regiolect (if we encounter evidence for one). We take it as evidence of regiolect formation if varieties have become noticeably more similar to neighboring varieties of the same regional language. We assessed whether this co-occurs with convergence to Standard Dutch, but cannot directly make claims about whether this drives the process of regiolect formation.
Measuring change relative to the standard language is challenging, because standard languages themselves are not unchangeable. Standard languages were relatively exclusive during nation-building times (Haugen, Reference Haugen1966; Milroy, Reference Milroy2001), but standard languages are nowadays more often seen as a variety that everyone in a country should be able to use (Kristiansen & Coupland, Reference Kristiansen and Coupland2011; Smakman, Reference Smakman2012). Standard Dutch pronunciation still changed considerably in the twentieth century (Van de Velde et al., Reference Van de Velde, Hout and Gerritsen1997), and internal variation is now commonly accepted and detectable (Grondelaers et al., Reference Grondelaers, Hout and Van Gent2016). Newsreaders are perceived as good representatives of standard language speakers in the Netherlands (Smakman, Reference Smakman2006:280), so we selected a newsreader based on native Dutch speaker judgments (see Section 2 for details). We do not claim that the newsreader is representative of Standard Dutch from the 1980s, but it is impossible to find a suitable reference speaker for the 1980s to pronounce the same Standard Dutch target words used for the newly collected data. Convergence and divergence patterns detected in these studies are therefore specifically relative to Standard Dutch in recent years.
To investigate change between all regional variants of the regional languages and Standard Dutch, we construct dialectometric maps using Gabmap (Leinonen et al., Reference Leinonen, Çöltekin and Nerbonne2016). The application relies on the Levenshtein distance, an algorithm commonly used to derive how dissimilar two phonetic strings are (Kessler, Reference Kessler1995; Heeringa, Reference Heeringa2004; Wieling & Nerbonne, Reference Wieling and Nerbonne2015). These distances can then be used to generate dialectometric maps. These maps include beam maps and multidimensional scaling (MDS) maps (Nerbonne et al., Reference Nerbonne, Colen, Gooskens, Kleiweg and Leinonen2011), which provide an aggregated view of whether existing dialect groups have become more internally similar over time, and also whether the distance of specific variants to Standard Dutch has noticeably decreased. Note that this analysis is not statistically substantiated, because there is no straightforward test for detecting whether a regiolect has been or is being formed. A statistical test could be devised, but it likely has to rely on arbitrary thresholds for declaring when a regiolect has been formed, so we only visually inspect the observed patterns using dialectometric maps.
In addition, we provide a more in-depth analysis of the role of speaker characteristics and lexical covariates, for which we use a three-dimensional version of the Levenshtein distance, which can be used for comparing three transcriptions simultaneously (Heeringa & Hinskens, Reference Heeringa and Hinskens2015; Buurke et al., Reference Buurke, Sekeres, Heeringa, Knooihuizen and Wieling2022). We are specifically interested in how these characteristics affect the convergence to and divergence from Standard Dutch. For example, some speakers may be more prone to Standard Dutch convergence than others due to their life experiences (e.g. due to strongly negative views of their dialect use or decreasing dialect proficiency resulting from Standard Dutch’s ubiquity). Additionally, we need to account for lexical diffusion of pronunciation changes, because changes usually gradually spread out (Nerbonne, Reference Nerbonne2010). In this study, we account for a target word’s lexical frequency and word category, as these can account for a substantial amount of variation in language change (e.g. in lexical replacement: Calude & Pagel, Reference Calude and Pagel2011). Low-frequency words may be prone to change (Bybee, Reference Bybee2002; Pagel et al., Reference Pagel, Atkinson and Meade2007), although specific phonetic features may also be more prone to change in high-frequency words (Phillips, Reference Phillips1984:323). There is also evidence that some word categories are more resistant to change than others (for example, nouns more than adjectives and verbs; Pagel et al., Reference Pagel, Atkinson and Meade2007; Wieling et al., Reference Wieling, Nerbonne and Harald Baayen2011), which could be related to the fact that some word categories are more easily borrowed than others (Monaghan & Roberts, Reference Monaghan and Roberts2019). This in-depth analysis aids in detecting and correcting for structural variation associated with these factors, at least in the newly collected data. Which speaker characteristics and linguistic properties of the word list items are accounted for in the analysis is explained in detail in the next section.
2. Data
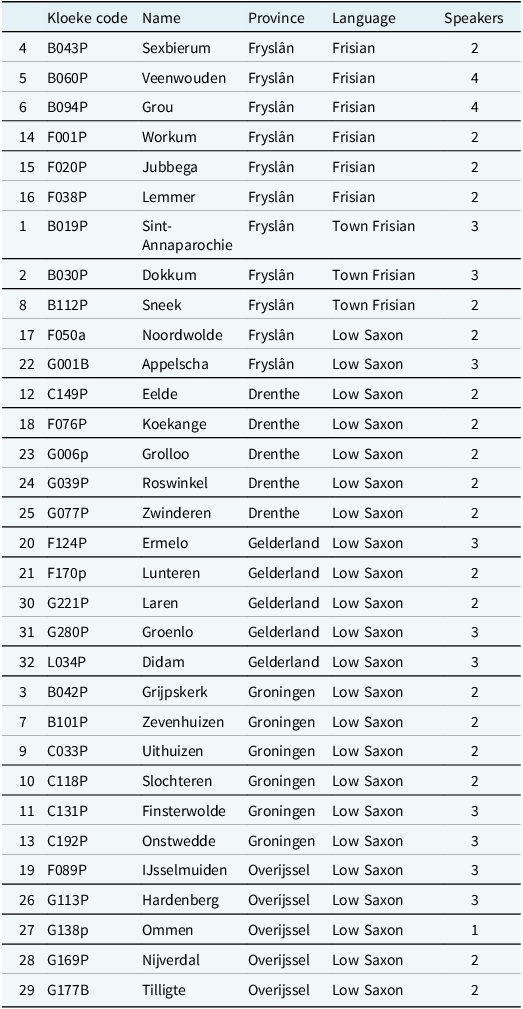
The GTRP reference locations for which new data were collected are shown in Figure 1, with relevant information per location in Table 1. We included Appelscha in gray in Figure 1, but these recordings could not be included in the analysis, because the GTRP speaker spoke Frisian and the SPRAAKLAB speakers spoke Low Saxon. Many Frisian speakers have migrated to this border area between Frisian and Low Saxon in the past century (Heeringa, Reference Heeringa2005), so this might be why a Frisian speaker was selected for the GTRP in this traditionally Low Saxon area.
Metadata per reference location, including the regional language and number of speakers. The geographical locations are shown in Figure 1

A variety of methods were used to find speakers, including mailing physical letters to people who participated in the study of Heeringa & Hinskens (Reference Heeringa and Hinskens2015), phoning companies in the reference locations, and referral sampling (i.e. a speaker asking other local dialect speakers they are familiar with). Post-initial communication primarily happened via e-mail, so speakers were familiar with general instructions before a recording session. The total number of SPRAAKLAB speakers whose data were included was 74. One GTRP speaker per location was included in this study (i.e. 31 in total), and a single Standard Dutch reference speaker, so there were 106 speakers in total.
As mentioned earlier, the new recordings were collected using the SPRAAKLAB mobile laboratory (Rebernik et al., Reference Rebernik, Jacobi, Buurke, Tienkamp, Abur and Wieling2025). SPRAAKLAB is equipped with professional directional microphones and a sound-dampened room. This ensured a high and consistent recording quality, a consistent experimental setup, a silent environment, and made it easier for dialect speakers to participate. The recordings in Workum were made with a laptop and head-mounted microphone due to the temporary unavailability of SPRAAKLAB, but they were of high enough quality to be used.
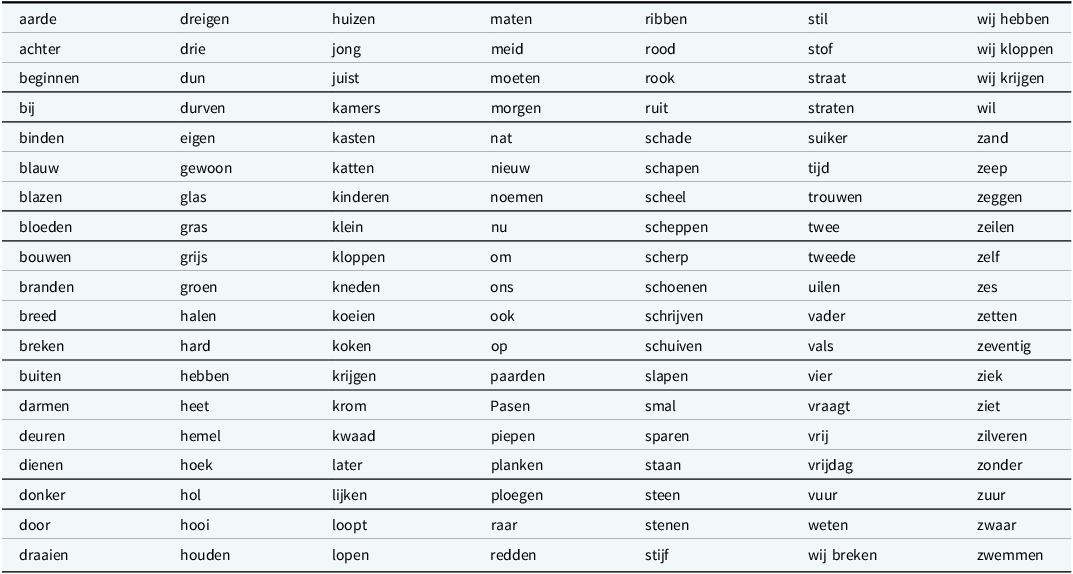
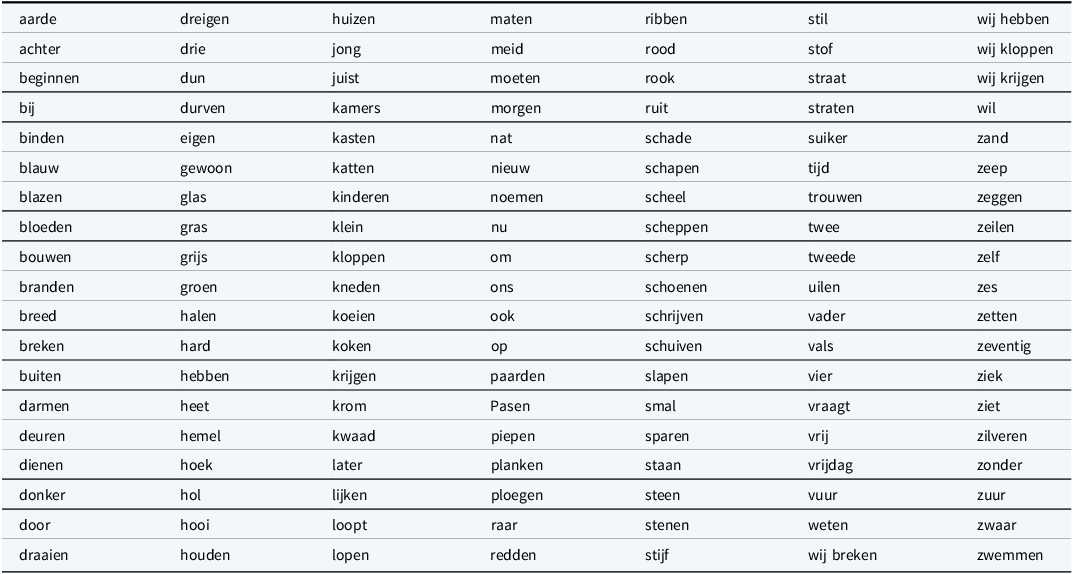
A session generally consisted of a short introduction, during which participants gave written informed consent. This was followed by the instruction to translate the presented Standard Dutch target words into the speaker’s dialect. They were instructed to translate the words as they would say them themselves (i.e. not another family member, who a participant may perceive as a better dialect speaker). They were also instructed to pronounce the translation only and not the target word. The target words were individually presented in written form in the center of a large screen for 2.5 seconds, after which a black screen was shown for 0.5 seconds. For example, if the target word huis ‘house’ was shown on the screen, the speaker would translate this (typically into [hus] or [hys]) and then automatically move on to the next target word. Verbs were presented with an underline to aid the speakers in differentiating between nouns and verbs, because many verbs and plural nouns are ambiguous in Dutch (e.g. vissen can both mean the plural noun ‘fish’ or the verb ‘to fish’). This cycle was repeated for all 150 target words of the task, of which 133 overlapped with the GTRPFootnote 2 and were included in the analyses (see Table 2). If a speaker failed to provide a pronunciation for a target word, the target was repeated at the end of the list. When a speaker indicated no fitting translation for a particular target in their dialect existed, they were instructed to remain silent, and the word was left out.
Standard Dutch target words for the word list translation task
After the word list translation task, speakers filled in a short background questionnaire. The questionnaire included questions about the respondent’s age, gender, and educational background. With nine possible values, the educational attainment scale ranged from “no education completed” to “university education.” The complete questionnaire is available on Open Science Framework (https://osf.io/hcavn/?view_only=3a9f1490cfae484796cc82cfbffde0ca).
Additionally, 40 statements about regional identity based on the Swabian Orientation Index (Beaman, Reference Beaman2021:107) were included in the questionnaire. The statements measure how strongly someone identifies with their region in the linguistic and cultural sense, including questions about whether someone consumes media in their dialect, knows local folklore, and is proud of their dialect. The statements were adjusted per dialect group to reflect terminology that is more widely in use by non-linguists (e.g. Gronings ‘Groningen dialect’ instead of Nedersaksisch ‘Low Saxon’). The statements were presented on a five-point scale, ranging from “strongly disagree” to “strongly agree.” The average value was computed across all 40 statements after ensuring negatively framed statements were inverted, and was used to index the strength of someone’s regional identity.
For Standard Dutch, a reference speaker needed to be selected. A national newsreader was therefore asked to pronounce the Standard Dutch target words, because newsreaders are perceived as representative speakers of Standard Dutch (Smakman, Reference Smakman2006:280). An earlier, separate study was set up (in 2021) to determine the most “standard” sounding newsreader out of 24 national newsreaders. In an online questionnaire, respondents were shown two side-by-side fragments of ten seconds read by a randomly selected pair of news readers. They were asked to rate which of the two seconds sounded the most “standard” Dutch on a five-point scale ranging from the first speaker sounding “much more standard” than the second speaker to the second speaker sounding “much more standard” than the first speaker. More details about the selection procedure, respondents, and results of this study are provided on Open Science Framework (see above). Based on 271 respondents, who rated 23 pairs of fragments, Astrid Kersseboom was selected as the best representative of Standard Dutch speech (although there was little difference between the top-ranked speakers). After contacting her, she kindly agreed to record the words of our word list, and her pronunciations serve as the Standard Dutch reference points in this study.
There may be word frequency effects (Phillips, Reference Phillips1984; Bybee, Reference Bybee2002; Pagel et al., Reference Pagel, Atkinson and Meade2007) and word category effects (Wieling et al., Reference Wieling, Nerbonne and Harald Baayen2011) when investigating language change, so we have derived this information for each Standard Dutch target word. There are several ways to estimate the frequency of specific words, but finding a suitable distribution that accounts for variation between individual language systems is challenging (Brysbaert et al., Reference Brysbaert, Mandera and Keuleers2018). SUBTLEX-NL is a psycholinguistically motivated database for Standard Dutch based on film and television subtitles, which reflects how easily people recognize words (Keuleers et al., Reference Keuleers, Brysbaert and New2010). The log-transformed frequencies of the target words in the SUBTLEX-NL database were used in the analyses; these ranged from 2.77 to 7.33.
The authors entered the word category metadata manually, considering which interpretation was most plausible when a target word was presented in isolation (and always matching the verb-distinction made during the experiment). Note that this approach is imperfect, because the word category of some target words remains ambiguous. For example, bij can mean both ‘bee’ and ‘at’ (or ‘with’, ‘by’, ‘close to’, or ‘towards’). This word has the same pronunciation in Standard Dutch, but these word categories have different pronunciations in some regional variants. However, prepositional use is much more frequent, so this directs the speaker’s interpretation in the translation task. The word list task was piloted several times, and after processing feedback from pilot participants, the list in Table 2 minimized the risk of confusion for speakers. In total, 45 verbs, 39 nouns, 29 adjectives, 13 adverbs, five numerals, and two prepositions were included in the final list.
There was one issue that could not be fully resolved. We relied on the GTRP target words provided in Gabmap for the word list, which was assumed to include only the first-person plural of verbs (Wieling, Reference Wieling2007:9). After the SPRAAKLAB recordings were completed, we discovered that the original GTRP list only included the first-person plural form of a few verbs, and that most verb targets in the list were in the infinitive form instead. This was a logical confusion, because these inflections have the same form and pronunciation in Standard Dutch and many dialects in the Netherlands (i.e. ending in [ən]). The error is not fully innocuous, however, because the few targeted first-person plural verbs in the GTRP corpus are translated with a [t]-ending in numerous Low Saxon variants (specifically, locations 17, 18, and 23 through 31). All plural verb forms uniformly end in [t] for these Low Saxon locations, which is known as a typical central Low Saxon feature. Many Low Saxon variants do not have this feature. It seems to compete with the [ən]-ending that is common in the Netherlands, although it is unclear whether the greater incidence of the [ən]-ending is a direct consequence of language contact with Standard Dutch (see Bloemhoff et al., Reference Bloemhoff, der Kooi, Niebaum and Reker2008:102–104 for a discussion).
All speakers for the SPRAAKLAB recordings were instructed to translate the underlined verb forms in the translation task as first-person plural forms. Upon inspection of the SPRAAKLAB recordings, only three speakers (a subset of speakers from locations 26 and 29) pronounced a [t]-ending for verbs, and only inconsistently so. This could be due to the choice to display the verbs without the preceding pronoun wij ‘we’, because we wanted to avoid speakers translating and pronouncing this part, which may have confused speakers. At the same time, it can also result from an expected form of language change (i.e. a greater similarity to Standard Dutch). Given this complicated state of factors, we evaluated whether the patterns meaningfully changed when infinitives (as elicited in the GTRP) were compared to first-person plural endings (as prompted in the SPRAAKLAB recordings), compared to excluding these items completely in our analysis. The results of this evaluation follow in Section 4.2.
3. Method
3.1. Phonetic transcriptions
The first author phonetically transcribed all target words for which valid recordings were available. We opted for broad phonetic transcriptions without suprasegmental information and diacritics, because they are often unreliable, even within transcriptions made by the same person (Shriberg & Lof, Reference Shriberg and Lof1991). Distances obtained from transcriptions including such smaller distinctions also correlate strongly with distances obtained without these distinctions, so they usually disappear in aggregated analyses involving many target words (Wieling & Nerbonne, Reference Wieling and Nerbonne2015) and are not informative at this level.
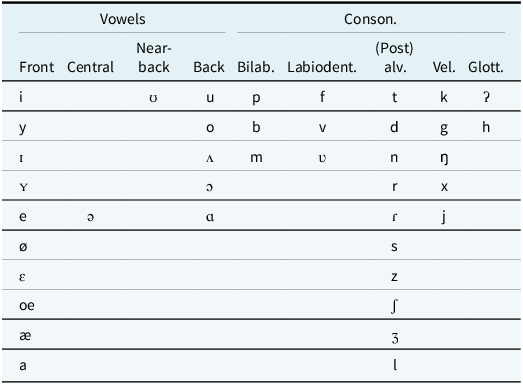
Note that the /r/ was always transcribed as [r]. Sebregts (Reference Sebregts2015) details how complex the nature of this phoneme is in Dutch, which can occur in at least ten variants in Standard Dutch (Van de Velde & Van Hout, Reference Van de Velde and Hout1999) or even more depending on the measurement method. Transcribing this variation would be highly time-consuming and likely unreliable, so the variation of this phoneme was simplified and is unlikely to affect the main conclusions of our aggregate-level analysis. Finally, the transcriptions were made by listening to all recordings by target word (rather than by participant or reference location), because the analyses are also on a word-level basis. The 40 phonetic symbols (17 vowels, 23 consonants) used for transcribing all recordings (i.e. the GTRP and SPRAAKLAB recordings combined) are reported in Table 3.
Phonetic symbols used in the combined corpus, ordered by place and manner of articulation according to the International Phonetic Alphabet (2005 version)

3.2. Levenshtein distance
We use two variants of the Levenshtein distance in our analyses. We use the traditional Levenshtein distance for the aggregate analyses and a three-dimensional version of the algorithm for the in-depth analysis. The Levenshtein distance has been used in dialectometry in recent decades to measure how similar phonetic transcriptions are (Kessler, Reference Kessler1995; Heeringa, Reference Heeringa2004; Wieling & Nerbonne, Reference Wieling and Nerbonne2015). The symbols in the phonetic transcriptions are aligned and paired in segments to see which binary operations are necessary to transform one transcription into the other. The possible operations are insertions or deletions of a phonetic symbol or substitutions of two phonetic symbols simultaneously. The number of minimally required operations equals the Levenshtein distance in the traditional implementation.
Each operation cost equals 1 in the traditional algorithm, but this is not optimally informative. A substitution of [i] by [ɪ] represents a much smaller change in phonetic space than a substitution of [i] by [u]. Following the approach of Wieling et al. (Reference Wieling, Margaretha and Nerbonne2012), which was also employed by Buurke et al. (Reference Buurke, Sekeres, Heeringa, Knooihuizen and Wieling2022), we induce more phonetically sensible weights for the algorithm using point-wise mutual information (Church & Hanks, Reference Church and Hanks1990). The most important adjustment is that the operation weights now lie between 0 and 1. A lower value represents a smaller adjustment in phonetic space, and a value closer to 1 represents a larger adjustment. We refer to the previously mentioned studies for examples of how this version of the algorithm can be used.
A three-dimensional version of the Levenshtein distance is used for the in-depth analysis, which is largely similar to the traditional approach. To compare the relevant transcription triplets (i.e. the GTRP, the SPRAAKLAB transcriptions, and the Standard Dutch reference speaker), we use a three-dimensional Levenshtein distance variant based on Heeringa & Hinskens (Reference Heeringa and Hinskens2015). The algorithm takes three phonetic transcriptions as input instead of the usual two, but involves the same binary operations (i.e. insertions, deletions, and substitutions).
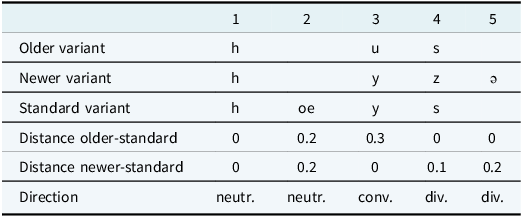
Table 4 provides a hypothetical triplet alignment for transcribed variants of the Standard Dutch target word huis ‘house’ and the associated algorithmic steps. There are five phonetic symbol triplets (i.e. aligned segments) involved in this alignment, each of which cascades into two paired phonetic symbols that are compared. For each of the five segments, the distance between the older (i.e. GTRP) and standard symbol is subtracted from the distance between the newer (i.e. SPRAAKLAB) and standard symbol. Note that diphthongs consist of two phonetic symbols, creating an extra segment in the alignment, and the sound at the end of the vowel glide is in the second segment. We opted to process diphthongs as two separate symbols, which allows for a more detailed comparison if, for example, the end position of the glide is slightly higher or lower between transcriptions. If we had processed diphthongs as a single sound, the measured difference would have been larger, as it would encompass a complete phonemic difference.
Hypothetical 3D Levenshtein alignment for variations of huis ‘house’

For the first segment, all symbols are the same and the distances are 0, so there is no change compared to the standard. The direction is neutral for the second segment, because the required operation for the older and newer comparison is an insertion of [oe] with the associated hypothetical distance of 0.2. For the third segment, the hypothetical weight for substitution of [u] by [y] is 0.3. The difference over time is negative 0.3, when the newer distance to the standard is subtracted from the older one. This means that for this segment, the overall change over time is one of convergence to the standard.
There is divergence from the standard for the fourth segment, because the newer comparison requires substituting [z] by [s] and the older one does not. There is again divergence from the standard for the fifth and final segment, because the newer comparison required a deletion of [ə] and the older one does not. This means there are two divergent, one convergent, and two neutral segments. Note that longer target words generally have longer alignments, so we also store the alignment length for the modeling procedure.
3.3. Analyses
The construction of the dialectometric maps was relatively straightforward, as it only required a geographical map file and phonetic transcriptions. The geographical coordinates of the GTRP reference locations were obtained using the OpenCage Python library (https://github.com/OpenCageData/python-opencage-geocoder) and manually checked.
Three maps were generated using Gabmap: a beam map, a reference map, and a multidimensional scaling (MDS) map. The beam map is useful for assessing whether groups of dialects have become more similar. The reference map is used specifically to see which areas have become more similar to Standard Dutch, so Standard Dutch is taken as the reference location in this map. The MDS map reduces the high-dimensional distance data into three dimensions, which can then be mapped onto the three primary colors for interpretation. More similar areas have similar colors, which is especially useful for visually assessing the dialect continuum. The reference and MDS map are partitioned into Voronoi tiles that differ in size according to the distribution of the recording locations, but the size of the tiles is not meaningful.
For the in-depth analysis, we assess to which degree speaker and lexical characteristics influence the convergence and divergence patterns with Standard Dutch as a reference point. We predicted how many convergent, divergent, and neutral segments were expected based on a combination of factors. Given the nature of the predicted variable, we used a Poisson-based generalized additive mixed-effects regression model (GAMM; Wood, Reference Wood2017), which is fitted using the mgcv R library (Wood, Reference Wood2000). This regression-based approach enables modeling linear and non-linear relationships between the predictor variables, such as target word frequency or geographical surfaces based on coordinates (Wieling et al., Reference Wieling, Nerbonne and Harald Baayen2011; Wieling et al., Reference Wieling, Montemagni, Nerbonne and Harald Baayen2014), and the dependent variable (i.e. the number of changed segments). As a mixed-effects regression approach, it also allows the inclusion of random effects, which can account for word-, speaker- and location-based structural variability. Besides the model summary, we report the explained deviance of the model, which is a generalization of the explained variance for non-Gaussian models (Wood Reference Wood2017:127) and indicates how much of the variation in the data is explained by the model.
The final model was constructed using an iterative modeling procedure in line with Wieling (Reference Wieling2018), which ensured that the model explained as much of the variation in the data as possible, with as few predictors as possible. We initially included the geographical effect only, and then consecutively added new predictors. The more complex model was kept if the additional complexity was justified, which was assessed using the compareML function of the itsadug package in R (Van Rij et al., Reference Van Rij, Wieling, Harald Baayen and Rijn2022). Note that maximum likelihood (ML) estimation was used when comparing models differing exclusively in the fixed effects. However, the default fast restricted maximum likelihood (fREML) estimation method was used for the final model. Only significant predictors or interactions were retained in the final model.
4. Results
4.1. Aggregate analysis
The dialectometric maps are presented in Figure 2. Note that darker colors in the beam map indicate greater similarity between locations, and darker colors indicate greater similarity to Standard Dutch in the reference map. The Frisian, Town Frisian, and Low Saxon areas can be clearly distinguished for both recording periods.
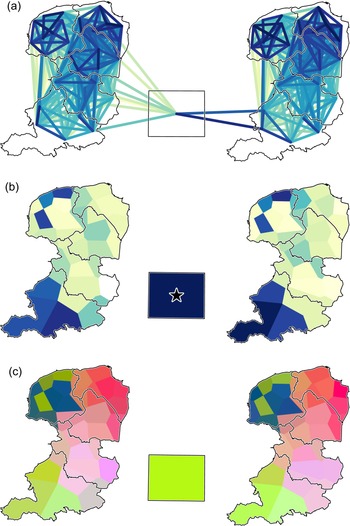
Dialectometric maps of the pronunciation variation. The GTRP corpus is visualized on the left, the SPRAAKLAB corpus on the right, and Standard Dutch is visualized via the rectangle in between. (a) Beam map. (b) Standard Dutch reference map. (c) MDS map.

Figure 2 Long description
Panel A: Two beam maps side by side. The left map represents the GTRP corpus, and the right map represents the SPRAAKLAB corpus. Both maps show interconnected regions with varying intensities of blue lines, indicating pronunciation variation. A rectangle in the center represents Standard Dutch. Panel B: Two standard Dutch reference maps side by side. The left map represents the GTRP corpus, and the right map represents the SPRAAKLAB corpus. Both maps show regions with varying shades of blue, indicating the presence of Standard Dutch. A star in the center represents Standard Dutch. Panel C: Two multidimensional scaling (MDS) maps side by side. The left map represents the GTRP corpus, and the right map represents the SPRAAKLAB corpus. Both maps show regions with varying colors, indicating pronunciation variation. A rectangle in the center represents Standard Dutch.
The increased darkness of the lines in Figure 2(a) connecting the Frisian locations indicates that these varieties have become more similar to each other in recent decades, while their similarity to Standard Dutch in Figure 2(b) seems stable. Their colors in the MDS space in Figure 2(c) remain virtually unchanged. The distance between the Town Frisian variants appears stable in Figures 2(a) and 2(c), and their similarity to Standard Dutch also seems stable in Figure 2(b).
For the Low Saxon area, the three southwesternmost areas appear to become more similar to Standard Dutch over time (see Figures 2(b) and 2(c)), and they remain relatively similar to each other (see Figure 2(a)). The three southwesternmost locations in the province of Gelderland are relatively distinct from the rest of the Low Saxon area in Figure 2(c), which they already were in the 1980s. The eastern Twente and Achterhoek regions in the provinces of Overijssel and Gelderland have over time become more similar (see Figure 2(c)). The most substantial differences in these regions are found for the easternmost locations in Overijssel (i.e. Tilligte) and Gelderland (i.e. Groenlo), because they have become less dissimilar to the other areas (see also Figure 2(b)).
Furthermore, the northern Low Saxon areas in Groningen and the north of Drenthe appear to become more similar over time, although the difference is smaller than for the Frisian locations (see Figure 2(a)). This pattern does not coincide with a substantially increased similarity with Standard Dutch in Figure 2(b). The eastern locations in the provinces of Groningen and Drenthe remain relatively distinct from the other areas in Figure 2(c), but other Groningen and Drenthe areas appear more similar in the SPRAAKLAB corpus.
4.2. In-depth analysis
Following the outlined procedure, we constructed a model predicting how many convergent, divergent, and neutral segments are expected given geographical variation, and speaker and lexical characteristics. To distinguish between the different change directions, we constructed a direction factor variable with three levels (abbreviated as ‘Dir.’). We also incorporated the length of each 3D Levenshtein alignment in the model to correct for the fact that target words differ in length and this will affect the number of segments that can differ between the transcriptions. Longer target words would otherwise structurally exhibit more overall change. The final model formula is as follows:
Count ∼ Alignment length * Dir.
+ Regional identity strength * Dir.
+ Educational attainment * Dir.
+ s(Word frequency, by = Dir.)
+ s(Longitude, Latitude, by = Dir.)
+ s(Word, Dir., bs = ′re′)
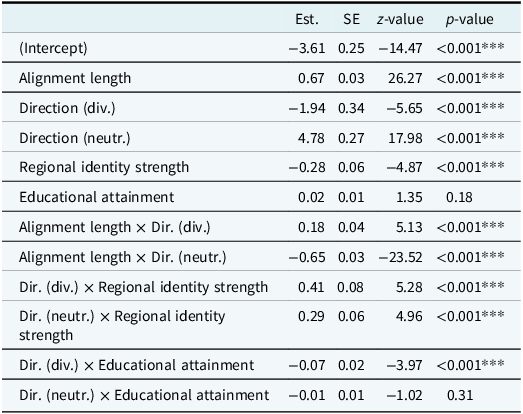
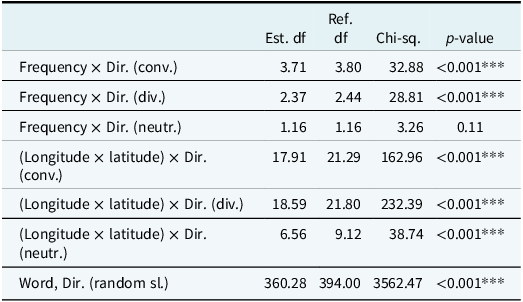
The model summary for the parametric and non-parametric model terms are provided in Tables 5 and 6. The final model has an explained deviance of 78.2%, indicating that a substantial amount of the observed pronunciation variation is explained by the model. Due to the many interactions in the model, it is informative to look at the estimated marginal effects plots, which are shown in Figures 3 and 4. By-speaker and by-target word random intercepts were added to the model with corresponding by-direction random slopes.
Parametric coefficients of the final model predicting convergent, divergent, and neutral segments

Smooth coefficients and random intercepts (int.) and slopes (sl.) of the final model predicting convergent, divergent, and neutral segments

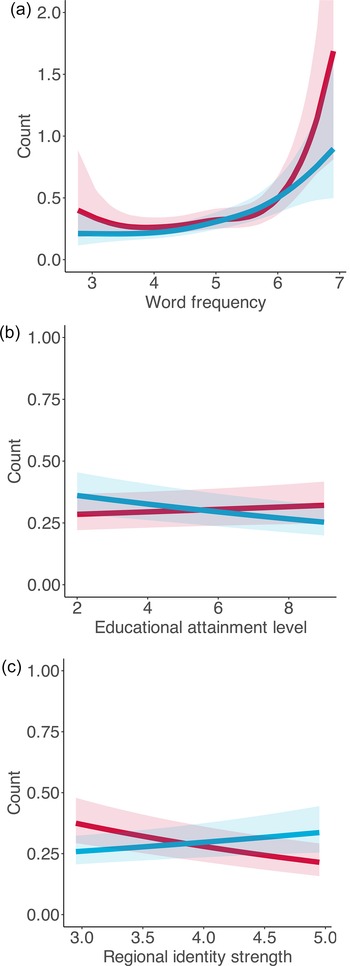
Estimated marginal effects of the final model. The red line represents convergent segments, the blue line divergent segments, and the green line neutral segments. (a) Word frequency. (b) Educational attainment level. (c) Regional identity strength.

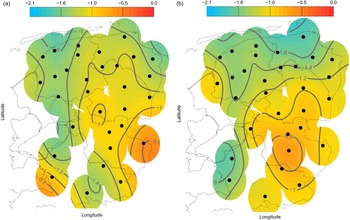
Marginal geographical effects of the final model with reference locations. Bluer colors indicate relatively less estimated change in that direction, and redder (more yellow) colors indicate more change in that direction. (a) Convergence to Standard Dutch. (b) Divergence from Standard Dutch.

As indicated before, we checked whether leaving out the target words categorized as verbs changed the outcomes of our analyses. There was no meaningful difference in the results (see the supplementary material) despite the substantial reduction in sample size (i.e. using data from 88 target words instead of 134), and thus we report the results based on all target words in the following.
As expected, a greater alignment length was associated with a greater change for each direction (see Table 5), although the expected increase was smaller for neutral segments. Furthermore, more convergence than divergence is predicted according to the model, but neutral segments still account for most of the data (see Table 5). This is also confirmed when tallying the segments by direction, which shows that 84.8% of all segments were neutral, 7.5% of the segments were convergent, and 7.7% of the segments were divergent. The estimates for neutral segments are left out of Figure 3, because we are interested in the convergence and divergence patterns, but the estimates are reported in the supplementary material.
The estimated marginal effect for word frequency in Figure 3(a) shows a slightly higher amount of convergence for particularly low-frequency target words. The overall estimated segment count is higher for higher-frequency words, but the increase occurs for both convergence and divergence.
The speaker characteristics visualized in Figures 3(b) and 3(c) significantly contributed to the model, but their overall effects are small and plotted with a smaller range of the y-axis for readability. The estimated divergence was higher for speakers with lower educational attainment, while the estimated convergence was higher for speakers with high educational attainment. Furthermore, the estimated divergence was somewhat higher for speakers with a stronger regional identity, while the estimated convergence was higher for speakers with a weaker regional identity.
The marginal geographical effect plot for convergence in Figure 4(a) is in line with the earlier Figure 2(b), because it shows relatively strong convergence in the southwesternmost Low Saxon areas in the province of Gelderland and Tilligte in the province of Overijssel. More moderate amounts of convergence are also found for most other areas, with the least convergence occurring in the northeastern part of the province of Groningen and most of the province of Fryslân. The marginal effect of divergence shows a relatively strong area of divergence in the eastern Twente and Achterhoek regions in the provinces of Overijssel and Gelderland, and relatively little divergence in other areas. The geographical variation of neutral segments is complementary to those already shown and therefore not reported here (see the supplementary material).
5. Discussion
In this real-time study with closely controlled speaker parameters, we assessed whether there was evidence for regiolect formation for the Frisian, Town Frisian, and Low Saxon regional languages between the 1980s and 2020s. We estimated how much and in which direction these regional language variants changed based on pronounced translations of 133 Standard Dutch target words. The aggregate analysis showed partial evidence of regiolect formation for Frisian and the northern Low Saxon region, because the local variants in these areas became more similar over time. The Town Frisian varieties (locations 1, 2, and 8 in Figure 1) and the southern Low Saxon varieties did not become noticeably more similar over time. Future studies may determine to which degree these potential regiolects are perceptually salient to speakers, and whether these regiolects replace the role of traditional dialects or instead add a potentially persistent extra layer of regional variation (as is the case in Germany; Kehrein, Reference Kehrein, Brunn and Kehrein2020).
An in-depth analysis showed that convergence to Standard Dutch was strongest around Lunteren (location 21) and Ermelo (location 20), located in the southwestern Low Saxon border area with the Hollandic dialects. There was also a relatively strong area of convergence around Tilligte (location 29) in the east of the province of Overijssel, although this could be due to the GTRP speaker being highly dissimilar from other variants at the time (see Figure 2(b)). The Tilligte speaker in the GTRP may not have been the best reference speaker for the local dialect, but that cannot be ascertained either. It is worth noting that Tilligte is situated in an area that had relatively conservative dialects in the twentieth century (Entjes, Reference Entjes1972), which could explain why the overall change is relatively high in this area. Some care should therefore be taken regarding our conclusions in the eastern parts of Overijssel. More moderate levels of convergence were found in most of the other areas, with the lowest levels found in the province of Fryslân and in northeastern Groningen. Divergence levels were predicted to be lower than convergence levels. The reference locations in the province of Overijssel (except IJsselmuiden, location 19) stood out as having relatively more divergence from Standard Dutch, although they also did not become noticeably more similar, so these dialects appear to fracture the dialect continuum.
The in-depth analysis showed that even when the recording period, reference location, and age range are relatively well controlled across time, other speaker characteristics can still influence the results to some degree. These characteristics included a speaker’s regional identity strength and education attainment levels, although these effects were relatively minor. It is well known that educational background (or social class) and dialect use interact in the Netherlands and elsewhere (Chambers & Trudgill, Reference Chambers and Trudgill1998; Driessen, Reference Driessen2005; Schmeets & Cornips, Reference Schmeets and Cornips2022:58), although the effect is only statistically significant for divergence. The observed regional identity effect occurs for both convergence and divergence, which indicates that this may play a more substantial role than educational backgrounds in the overall language change of regional variants.
A driver of the observed divergence patterns at the speaker level could be a process in which hyperdialectisms (i.e. ‘overdoing’ dialectal features to express a regional identity) become entrenched in a speaker’s language system, which has recently been observed for Brabantish and Limburgish (Doreleijers et al., Reference Doreleijers, Piepers, Backus, Swanenberg, Kristiansen, Franco, Pascale, Rosseel and Zhang2021). This is not unexpected in the context of the substantial dialect loss that has been observed for Low Saxon (Buurke, Knooihuizen, Heeringa & Wieling, Reference Buurke, Knooihuizen, Heeringa and Wieling2024), and it may explain the ‘new’ pronunciation variation observed in the province of Overijssel (showing both divergence from Standard Dutch and neighboring varieties). An example of this variation in Overijssel is the observed change from [ɑ] to in [ɔ] (e.g. [(h)ɑldn] →[(h)ɔldn] ‘to hold’), which is observed for all recording locations in that region. Furthermore, we observed changes for the target word dreigen ‘to threaten’ from [ɛi] to [i] (and vice versa), but also from [ɛi] to [a] and [i] to [ɛ]. These examples show increased vowel variability in this region, making the dialects simultaneously less similar to Standard Dutch and each other. It is also likely that such potential hyperdialectal behavior is more accepted among people with lower educational attainment, for example as an in-group solidarity marker (see e.g. Doreleijers & Swanenberg, Reference Doreleijers and Swanenberg2023). It is worth noting that regionalization effects under pressure have already been detected for Overijssel in earlier centuries (Kloeke, Reference Kloeke1927; Van Reenen, Reference Van Reenen2006), so it is possible that this region already had more substantial pronunciation variation before the time period under investigation here. Further studies can disentangle these identity effects more appropriately per individual speaker. Individual speaker effects can ostensibly be detected in aggregate analyses, confirming that regional identity strength should be accounted for in regional language change studies (see also Beaman, Reference Beaman2021).
Target words and their dialectal translations are also not equally likely to change. Low-frequency words (e.g. uilen ‘owls’) were particularly likely to converge to Standard Dutch, and high-frequency words (e.g. nu ‘now’) were prone to change regardless of direction. Low-frequency words are known to be prone to change (Bybee, Reference Bybee2002; Pagel et al., Reference Pagel, Atkinson and Meade2007), but the number of changing segments in high-frequency words appeared higher overall. These effects at the ends of the frequency spectrum probably have different underlying processes. Phillips (Reference Phillips1984:322) suggests that phonetic processes affect high-frequency words more than low-frequency words, while higher-level processes affect low-frequency words first. It could be that pronunciation simplification processes, such as vowel reduction and deletion, are strongly reflected in our dataset, resulting in more change for high-frequency words. A potential underlying higher-level process, resulting in more change for low-frequency words, is that dialect words for infrequently used concepts are not regularly reinforced in a speaker’s lexicon. Replacement by alternative forms or features that are more frequently used is likely, for which the forms from Standard Dutch are prime candidates, given Standard Dutch’s wide institutional facilitation and presence in all social contexts. Consequently, the regional language lexicon becomes smaller over time, even for speakers who are relatively proficient regional language users.
Comparing task differences between the GTRP and SPRAAKLAB recordings may be useful. The tasks were largely similar, but the task for the SPRAAKLAB corpus had a higher pacing than the GTRP task. Especially for low-frequency words, this may make it more likely that the Standard Dutch alternative is more readily activated. The pacing of the SPRAAKLAB task did not heavily bias the results with only Standard Dutch approximating forms, because there were clear cases where the non-Standard Dutch target words were pronounced instead. Variants of tsjuster (as opposed to Standard Dutch donker ‘dark’) were used by almost all Frisian speakers in the SPRAAKLAB recordings, whereas these variants were rare in the GTRP. Furthermore, the researcher’s presence was minimized in the SPRAAKLAB recordings to avoid the researcher’s use of Standard Dutch causing speakers to use more standard language forms. This was not done for the GTRP corpus, although some field workers spoke in regional varieties instead of Standard Dutch, alleviating the problem of potential Standard Dutch accommodation. At the same time, the speakers may still use more Standard Dutch forms as an alternative if the regional varieties are not highly similar, because the speaker likely still experiences the field worker as a differently speaking outsider. A future study may discern whether higher-paced tasks override the advantage of having no research present when eliciting dialect words, but this does not appear to have strongly impacted our findings.
Finally, it is attractive to think of ways to make obtaining relevant dialect data less time-consuming. In this case, a single transcriber made transcriptions for 106 speakers and 133 target words, which required listening multiple times to over 14,000 recordings. Newer methods are also available, for example by leveraging neural acoustic models to extract abstract numeric representations of the sound recordings automatically and quantifying the differences between them, instead of using the phonetic transcriptions in combination with the Levenshtein distance (Bartelds & Wieling, Reference Bartelds and Wieling2022; Bartelds, Reference Bartelds2023). We also attempted this approach for our data, but the obtained distances were systematically disproportionately large between the GTRP and SPRAAKLAB recordings. This was surprising, because using this neural acoustic method for the SPRAAKLAB recordings proved to be successful for automatically quantifying regional language variation before (Buurke, Bartelds, Knooihuizen & Wieling, Reference Buurke, Bartelds, Knooihuizen, Wieling, Grenoble, Lane and Røyneland2024; see the supplementary material for details), and likewise for the GTRP data (Bartelds & Wieling, Reference Bartelds and Wieling2022). This problem may be caused by the different sound recording methods of the corpora, because the GTRP was recorded on tape instead of with digital microphones (see https://projecten.meertens.knaw.nl/mand/GTRPdatata.html). This suggests that the novel method requires further exploration to ascertain its usefulness in scenarios where different datasets are compared, but it has potential for future studies of this size. In addition, the acoustic method is likely more capable of fully processing all details in the sound signal. Human transcribers are limited by their perception, which can be problematic. For example, some Standard Dutch target words had word-initial /z/ or /v/, which are nowadays more frequently pronounced as /s/ and /f/ in Dutch (Van de Velde et al., Reference Van de Velde, Hout and Gerritsen1997), although the rate of the change from /v/ to /f/ increases from the southern to the northern Netherlands (Pinget et al., Reference Pinget, Kager and Van de Velde2016). A human Dutch transcriber (especially from the area of interest) will likely have trouble distinguishing these sounds in these positions, because they are also subject to this ongoing change. Furthermore, it has been shown that the neural acoustic method aligns better with overall aggregated human perception than using the Levenshtein distance (Bartelds et al., Reference Bartelds, de Vries, Sanal, Richter, Liberman and Wieling2022).
6. Conclusion
We found evidence for regiolect formation in regional languages in the northern and eastern Netherlands by analyzing phonetic corpora from the 1980s and 2020s, especially for Frisian varieties. The detection of regiolects in this area fits a more widely occurring pattern in the Netherlands and Flanders, although it is not yet clear whether the increased similarity between localized dialects has an active role in speaker perception. Furthermore, we found that convergence to Standard Dutch was strong in the border region between Low Saxon and the Hollandic dialect group and for an eastern village in the province of Overijssel. The divergence from Standard Dutch was also relatively strong in Overijssel, but this co-occurred with a divergence between dialects in this area, which appears to fracture the Low Saxon dialect landscape.
We managed to control for speaker characteristics when measuring community language change, which addressed shortcomings of previous studies in this area, although differences between data collection tasks remain difficult to avoid. At the same time, some speaker characteristics still presented statistically measurable effects, such as a speaker’s educational background and regional identity strength. These findings indicate that it is essential to not rely on a single speaker in sampling locations, because inter-speaker differences can skew the results, although determining a reasonable minimum number of speakers remains a task for future studies.
Further studies may investigate whether regiolect speakers also form a strong regional identity, and whether this is similar to dialect speakers. This can be used to strengthen language preservation efforts (e.g. with the formation of a regiolectal writing standard). It may also interest language preservationists to see whether such regiolects could be institutionalized or granted some form of legal status. This is particularly interesting for Low Saxon, which enjoys fewer legal benefits than Frisian and whose speakers are distributed across more provinces in the Netherlands.
Acknowledgments
The authors thank Astrid Kersseboom for providing Standard Dutch recordings of the word list.
Competing interests
The authors declare none.

 Open access

