


Introduction
This article digitally visualizes changing crop choice over time in nineteenth-century equatorial eastern Africa. Specifically, it makes an initial attempt to map when, where, and to what degree farmers in different locales incorporated maize, rice, and cassava into their agricultural regimes. These crops all originate outside of Africa. Maize and cassava are “New World” crops and rice originates in Southeast Asia.Footnote 1 All arrived in inland regions of equatorial eastern Africa for the first time in either the late eighteenth or nineteenth centuries, though the specific timing of their arrival and their importance to nineteenth-century agriculture remains largely unknown or under-analyzed.Footnote 2 What is clear is that, during this period, farmers in eastern Africa adopted these crops alongside or in place of indigenous grains, such as sorghum and millet, and longer-standing imports, such as bananas/plantains (which are of Southeast Asian origin but may have been present in eastern Africa since sometime in the second millennium bc).Footnote 3 Maize, rice, and cassava’s arrival in eastern Africa can be understood as contributing to a broader transformation in equatorial eastern Africa’s food-producing systems, especially near to caravan routes and commercial and administrative centers. As several historians have outlined, this transformation was characterized by an intensification of food production, which was facilitated by the incorporation of new tools, new systems of labor, and cattle, as well as new crops.Footnote 4 In some ways, changing crop choice was part of a broader “agricultural revolution” that occurred in parts of equatorial eastern Africa during the nineteenth century.Footnote 5
The region under review in this article includes parts of present-day mainland Tanzania, Uganda, Burundi, and the Democratic Republic of the Congo (DRC). It broadly corresponds to the central caravan route between Zanzibar and inland regions of the mainland, focusing on regions to the west of the East Arc mountains. This route primarily facilitated a long-distance ivory trade from the eastern African interior to its coast and islands, from where ivory was shipped to industrializing North America and Europe.Footnote 6 It was along this and several ancillary caravan routes that maize, rice, and cassava were introduced to the region, although some maize may have come from the west via routes that linked central Africa to the West African coast as well.Footnote 7 This article excludes eastern Africa’s coast and hinterland for two reasons. First, these latter regions had more sustained connections to the Indian Ocean World and the globalizing economy, including its flora and fauna, before the nineteenth century, and so presence of maize, rice, and cassava in the region had a deeper history there.Footnote 8 Second, with some exceptions, it generally receives higher levels of rainfall than regions further inland, and rain falls in slightly different seasonal patterns: the coast and hinterland experiences two rainy seasons (October–November and March–May), while inland regions of present-day Tanzania experience one (November–April or December–March). Thus, nineteenth-century agricultural change on the coast and hinterland occurred within different temporal and climatic contexts to the regions under review in this article.
Up to now, understandings of nineteenth-century agricultural change in equatorial eastern Africa, especially histories of changing crop choice over time, have been inhibited by scholars’ approaches to limited source material. Outside of island, coastal, and hinterland regions of equatorial eastern Africa, for example, there has been a dearth of archaeological, palynological, and linguistic research that might shed light on this topic.Footnote 9 Oral traditions, meanwhile, some of which refer to the introduction of new crops, are notoriously difficult to place precisely in time and rarely quantify new crops’ significance to food production.Footnote 10 Further, the documentary source material, which was almost entirely written by Europeans, has yet to be systematically investigated for evidence of agricultural change in specific locales, referring instead only to broad trends. To be clear, much of this source material is highly problematic, not least for the authors’ racism and their perpetuation of paradigms that later contributed to imperial partition.Footnote 11 But a feature of the works of the so-called “explorers” is the attention their creators paid to geography and to the availability of different foodstuffs in the places through which they traveled. Despite challenges (described below), closer examination of these sources has the potential to shed light on changing crop choice over time on highly localized scales.
This article uses digital Geographic Information Systems (GIS) to undertake this investigation. Specifically, it starts this process by identifying all the references to different crops, including maize, rice, cassava, sorghum, millet, plantains, and bananas, contained in “explorer”-authored documents. Such explorers include Richard Burton, John Hanning Speke, James Augustus Grant, David Livingstone, Henry Morton Stanley, and Verney Lovett Cameron. The diaries, letters, and publications of these authors are among the only documents that contain primary information about inland regions of equatorial eastern Africa during the period 1856–76 (such sources can be supplemented by those of missionaries for the late 1870s and 1880s and by colonial-era sources thereafter).Footnote 12 Following their return to Europe, moreover, the explorers contributed to the creation of maps of eastern Africa based on their descriptions. Use of these maps allows statements about the presence or availability of different crops in different locales to be visualized on geographic representations of the region. As some explorers traveled through the region during the 1850s and others did so during the 1860s and/or 1870s, divergences between each explorer’s descriptions, as visualized on their respective maps, may indicate changing crop choice over time in certain locales. Archaeologists and/or palynologists may then use the visualizations created for this article as a basis on which to investigate the extent and significance of agricultural change in the nineteenth century using evidence “in the ground.”
There are significant stakes associated with analyzing agricultural change in inland regions of nineteenth-century equatorial eastern Africa. For example, the introduction of maize, rice, and cassava to the region had significant implications for labor, land-use, and climate dependency. Maize requires less labor and less time to produce a larger yield of grains than is possible with, for example, sorghum and millet.Footnote 13 However, it is also more reliant on abundant rainfall to do so, meaning that increased reliance on maize production could indicate decreased dependability of overall agricultural production in times of drought.Footnote 14 Rice, meanwhile, requires more moisture and is planted later in the rainy season than the other grains mentioned. Its introduction, therefore, could have stimulated agricultural expansion into some hitherto neglected river valleys, which may have enhanced exposure to certain diseases.Footnote 15 Meanwhile, cassava is the hardiest and grows the fastest of the crops under review, but it has lower nutritional value.Footnote 16 The incorporation of maize, rice, and cassava into equatorial eastern Africa’s agricultural regimes, therefore, opened the region to a range of possibilities. Under some conditions, it could help to feed the caravan system and the urban centers that have been so central to understandings of eastern Africa’s nineteenth-century history.Footnote 17 But, under drought conditions, it could lead to major shortfalls in agricultural production and nutrition.
The period 1856–76 is particularly significant in this context. To be clear, the timeframe chosen for this article is influenced by the availability of specific source material – namely, the documents and maps attributed to early European imperialists. But it also aligns with major economic, political, and environmental changes in equatorial eastern African history. This was a period of political and commercial expansion, notably with the founding of Mirambo’s state in western Unyamwezi and of Tippu Tip’s “commercial empire” in the eastern Congo rainforests, as well as with the consolidation of Unyanyembe’s and Buganda’s respective power in central Unyamwezi and present-day southern Uganda.Footnote 18 To a large degree, these powers relied on intensified agricultural production to sustain them.Footnote 19 Meanwhile, historical climatologists have identified the period 1856–76 as an era of general wetness in equatorial eastern Africa, with several consecutive years of abundant rainfall. This came to an end, however, towards the end of the 1870s, after which a series of droughts set in during a period of generally below-average rainfall that lasted until the 1890s.Footnote 20 The choices of crop visualized in this article, therefore, were made during a period when demand for food in certain locales was increasing and when climatic conditions were generally favorable to the growth of crops with high-potential yields but with low resistance to water stress. Subsequent famines, especially in the 1880s, may be linked to drought’s effects on agricultural regimes and broader systems of production that had, in recent years, become increasingly reliant on abundant rainfall.
Thinking about these mid-nineteenth-century changes also has consequences for how the environmental history of the early colonial period is understood. One of the major threads of early colonial environmental history is disaster and decreasing agricultural productivity. These phenomena were triggered by a mixture of epidemics and exploitative colonial policies that diminished several people’s capacities to manage their environments.Footnote 21 Thaddeus Sunseri’s analysis of Unyamwezi is a case in point. In this context, he linked German colonial demand for Nyamwezi labor on coastal plantations and in railway construction to the deintensification of agricultural production in Unyamwezi itself. This then contributed to bush regrowth, which, in turn, led to an expansion of the zone occupied by tsetse flies and to heightened vulnerability to trypanosomiasis (sleeping sickness).Footnote 22 Such environmental challenges, however, do not have to be considered exclusively colonial in nature. Historians such as Stephen Rockel and Philip Gooding have recently highlighted disastrous famines and their links to epidemics and political instability during the 1880s. Failure of agricultural production during seasons of drought was a core factor in this context.Footnote 23 Early colonial disasters, therefore, can be considered on a continuum of an evolving set of agricultural and other environmental challenges that colonial rulers exacerbated, but which may have begun to set in before their arrival. Changing crop choice, especially the incorporation of maize and rice during a period of general wetness, are important factors to examine when conceptualizing environmental change and challenges over the late nineteenth and early twentieth centuries.
The remainder of this article is divided into six sections and a conclusion. The first section details the methods adopted to visualize changing crop choice over time from early imperial sources in the period 1856–76 within a GIS environment. The five subsequent sections analyze the resultant maps in five different subregions, broadly corresponding to Ugogo, Unyamwezi, Lake Victoria and surrounds, Lake Tanganyika and surrounds, and Manyema. Although considered separately for the purposes of organization, these subregions cannot be considered entirely unified or distinct. They experience rainy and dry seasons, and variability therein, at roughly the same times,Footnote 24 and, during the nineteenth century, they were connected by the central caravan route.Footnote 25 Divergences, however, are observable in terms of the amount of average seasonal/average rainfall, the timing of connection to the central caravan route, and the amount of available data with which to visualize changing crop choice. Overall, the maps indicate a general increase in maize and rice production around commercial routes and urban centers over time, as well as certain locales where the transformation was especially stark. Such trends may help to explain the success of certain urban centers and African states during a period of generally abundant rainfall, as well as the disastrous effects of repeated droughts during the 1880s. Archaeological and/or palynological research, especially in locales where early imperial sources suggest significant changes in crop choice, would help to support the evidentiary basis for these assertions.
Nineteenth-century sources and GIS
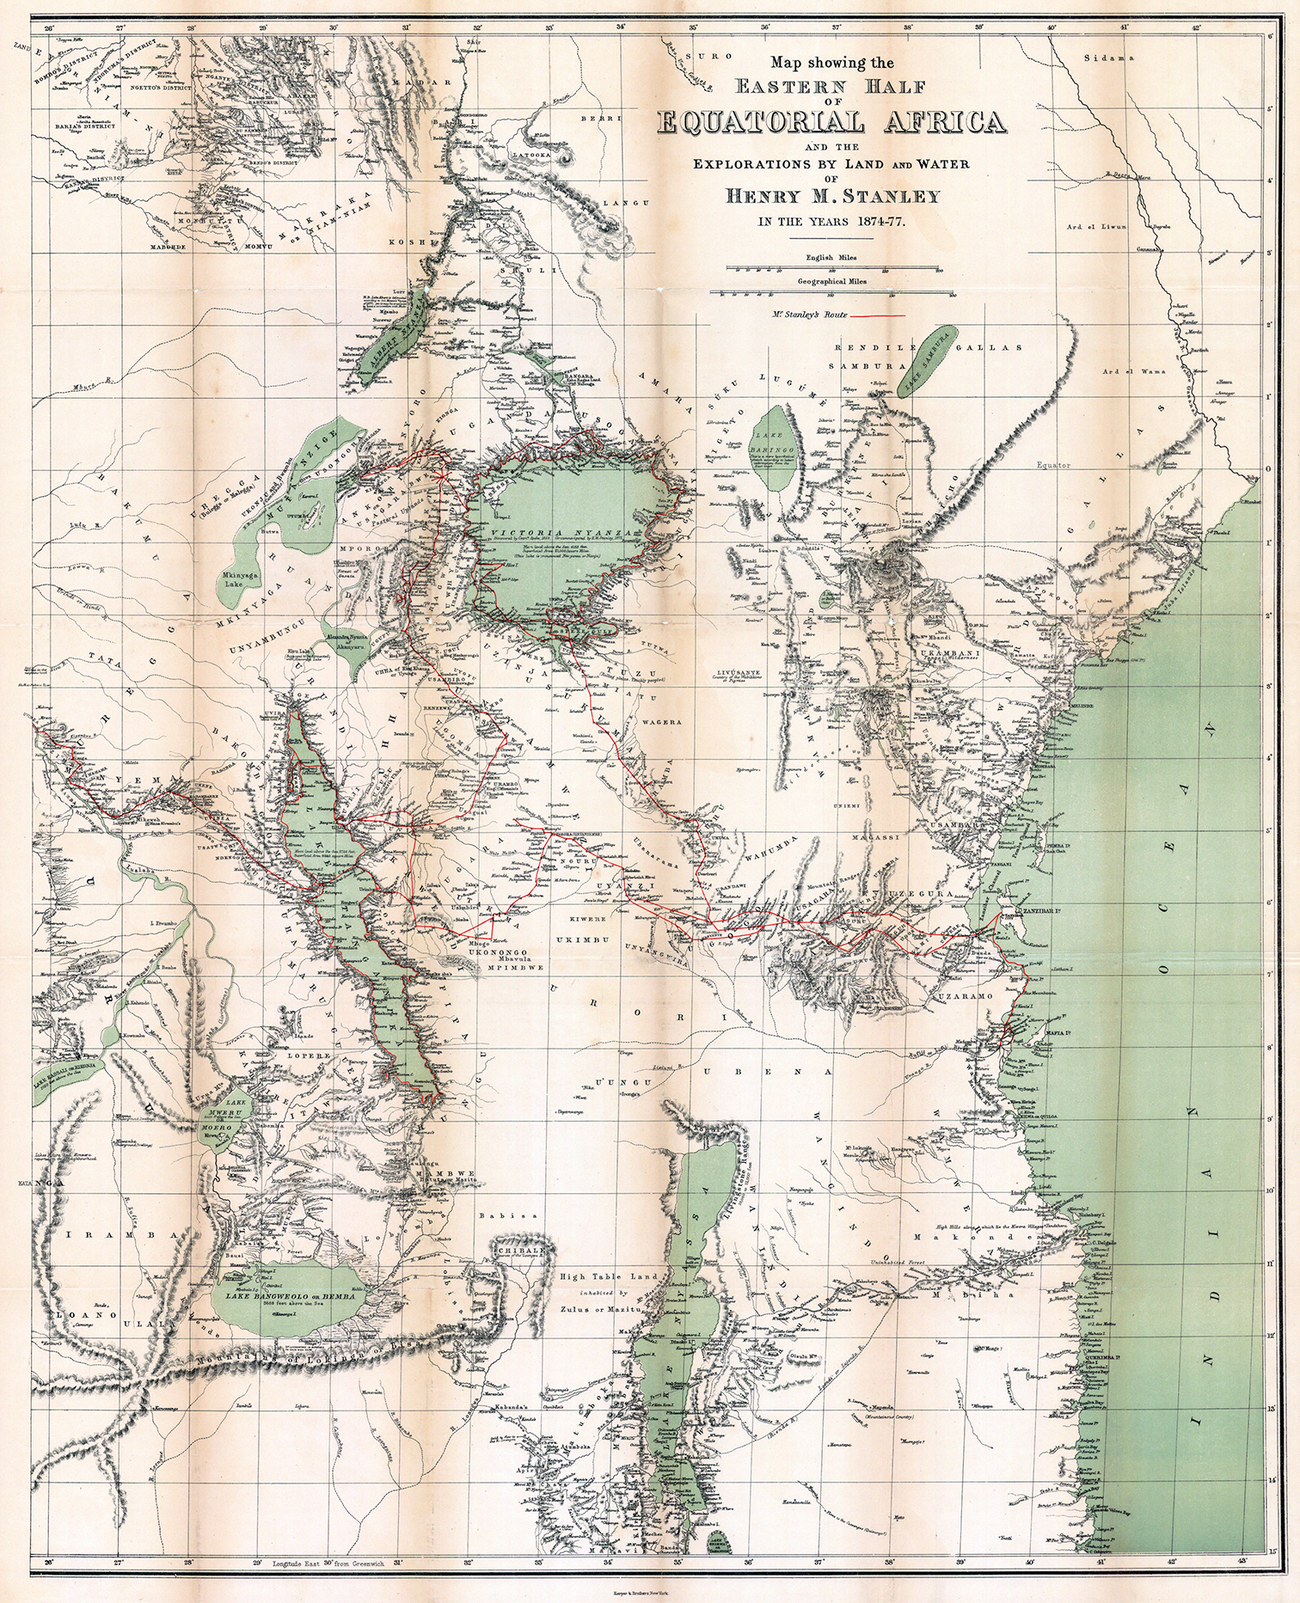
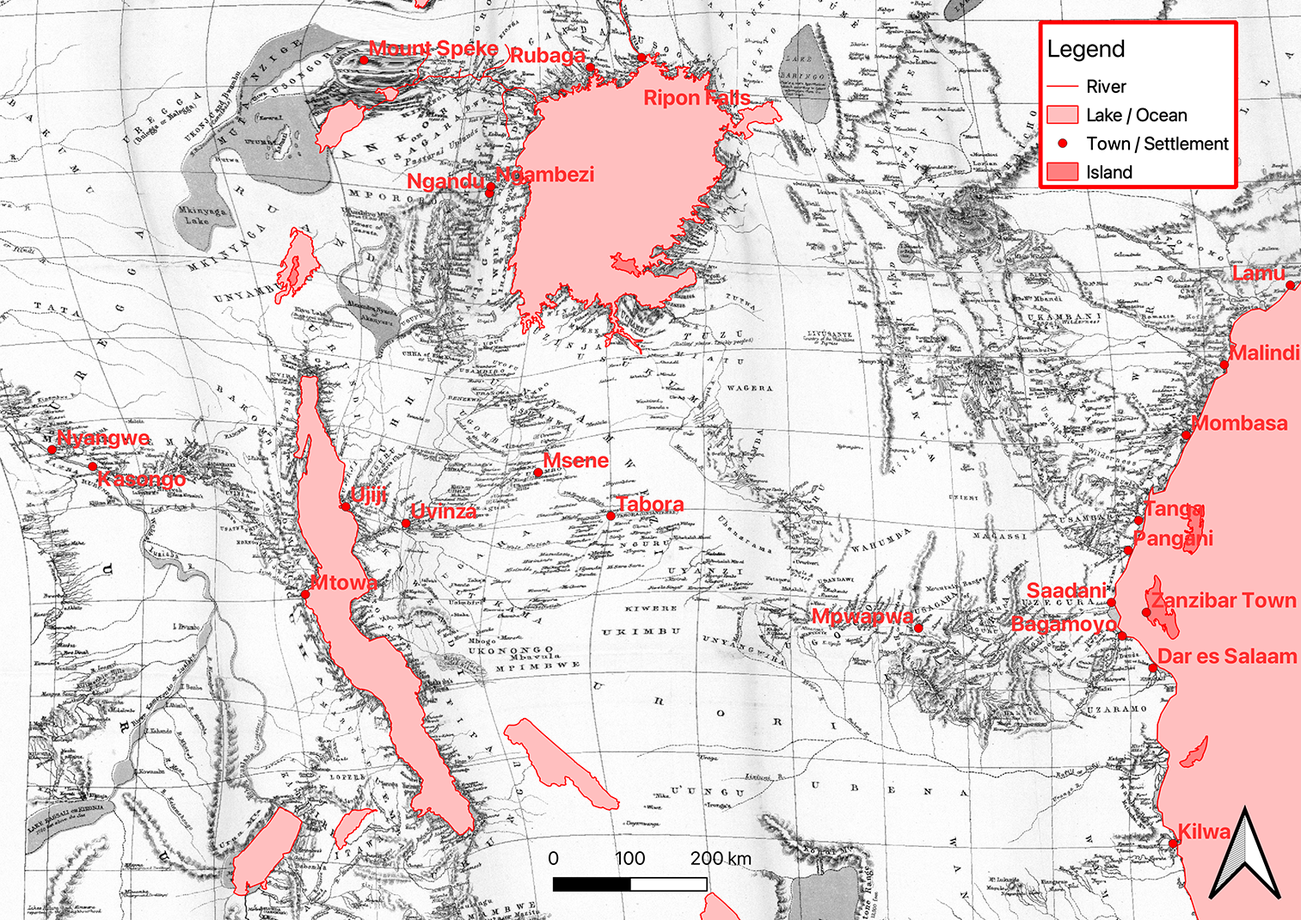
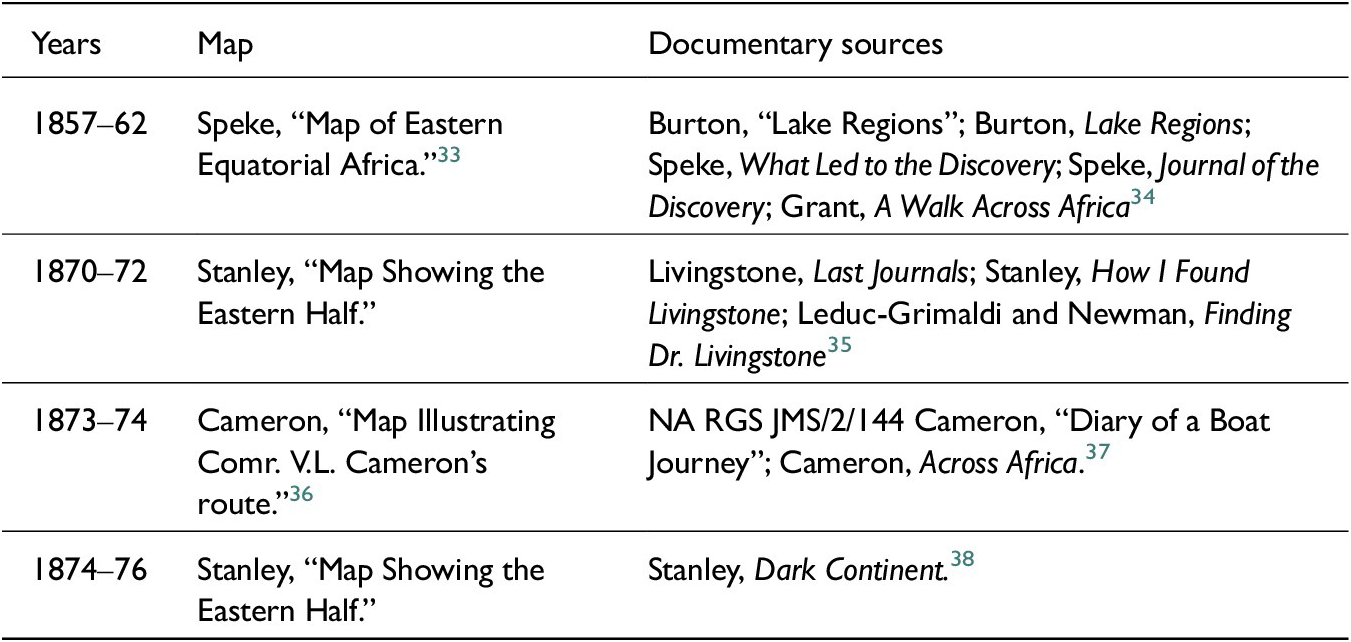
This article relies on three nineteenth-century maps of eastern Africa: John Hanning Speke’s (Reference Speke1864), Verney Lovett Cameron’s (Reference Cameron1877), and Henry Morton Stanley’s (Reference Stanley1878) (see Figure 1 and Table 1). Several factors contributed to inaccuracies and biases in these maps. These early imperialists were reliant on African and Omani traders and guides, and so they largely only mapped locations, regions, and geographical features on or around known trade routes. Moreover, in the process of making the maps, they purposely erased the cultural and material bases on which the information they gathered relied.Footnote 26 Thus, the information used by the cartographers with whom the “explorers” worked was incomplete, and the ways they interpreted the limited information they had was flawed. Only through using GIS software and a process of geo-rectification can the maps be shaped to reflect geographical reality, obfuscating at least some of the inaccuracies (although not the biases towards commercial routes).Footnote 27 Thus, for the purposes of this article, the original maps were shaped around known locations and features using a thin plate spline in QGIS (Figure 2). Known locations include settlements that have survived since the nineteenth century (such as Tabora, Ujiji, Nyangwe) and settlements that have been “rediscovered” via archaeological research (such as Ngandu, Ngambezi).Footnote 28 Footnote
Henry Morton Stanley’s map of eastern Africa (1878).Footnote 29

Geo-rectified version of Stanley’s (Reference Stanley1878) map of eastern Africa, focusing on the core regions covered in this article. Locations of known settlements and geographical features are highlighted in red, as it was around these points, lines, and polygons that the rest of the map was shaped. The same points, lines, and polygons were used as a basis to geo-rectify the other maps used in this article. Of course, errors remain in this map, as well as in the others. Errors in this map include: Lake Mwitanzige is grossly misshapen; Lakes Kivu and Malawi are much too far to the east; and Lakes Samburu and Baringo are misshapen and misplaced. I decided not to correct these errors. They are outside of the regions covered in this article, they were beyond where Stanley visited, and making corrections would have skewed other parts of the map. Thus, the resultant map prioritizes heightened levels of operability for data input over pure geographical accuracy.

Further challenges confront historians seeking to map crop choice over time during the nineteenth century from early imperial documents. Changing commercial and political conditions meant that the explorers frequently traveled on slightly divergent routes, meaning they commented on certain settlements or subregions only once or twice between them. Issues of locational interoperability between the different datasets thus pervade the following analysis. By contrast, most explorers commented on major commercial and administrative centers, such as Tabora, Ujiji, and Nyangwe, meaning that change over time in these zones is more observable. Additionally, heightened demand for food from traders, caravans, and other urban inhabitants in such locales, encouraged farmers to plant high-yield crops in their vicinities, and so these may be zones where changes in crop choice occurred most extensively.Footnote 30 Again, though, there are limitations. The reporting is uneven: evidence from Cameron’s descriptions, especially for the presence or availability of crops, is thinner than from the descriptions of other early imperialists. All the explorers also sometimes used the word “corn,” which can apply to both sorghum and maize, meaning that sometimes the data is ambiguous. Cross-referencing between sources and accounting for historical and seasonal changes enables somewhat sure interpretations of such data, but, as a rule, ambiguities are left in the maps, allowing for it to be tested against future research, likely with the use of archaeological and/or palynological methods.
Mapping agricultural change over time from the documentary and cartographic source material involved attributing coordinates to descriptions of crop availability and/or visibility found in documentary sources (Table 1). I collected data about the presence of bananas (including plantains), cassava, maize, mtama (sorghum and millet), and rice.Footnote 31 The reasons for combining sorghum and millet into a single category are threefold. First, many explorers referred to them interchangeably, often as mtama (Swahili: sorghum), and so it was impossible to determine when or where one was grown and the other was not. Second, they require similarly fertile soils and levels of rainfall to thrive, and so they were likely grown in the same locales. They are both also similarly resilient to the effects of water stress caused by meteorological drought or floods, meaning that they produce similar grain yields.Footnote 32 And third, they are indigenous staples, and the investigation here is to establish the extent to which such staples were replaced or supplemented by other imported crops, especially maize and rice. References to corn and grain were collated when the source was not specific, leaving open the possibility of maize or mtama for each relevant datapoint. Overall, combining all the available documentary sources, this process identified 284 separate references to different crops in the five subregions under review.
The maps and documentary sources consulted

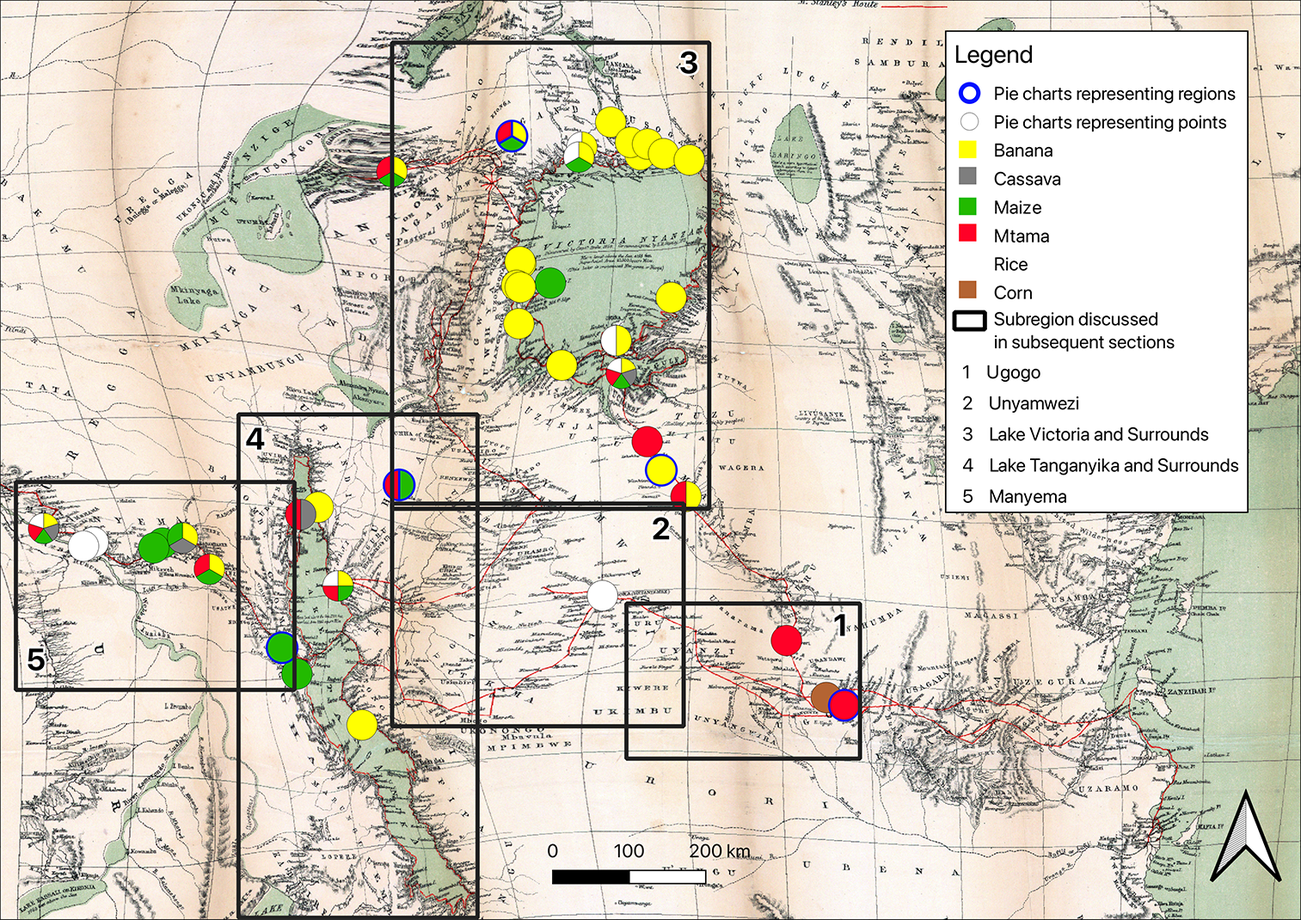
Following collection of documentary references to crops, each datapoint was assigned a location name based on textual descriptions. This name was then identified on the geo-rectified maps, which facilitated the generation of coordinates. The few locations that were not marked on the maps were estimated by identifying marked settlements that the explorers visited before and after. Each location with crop data was then represented with a pie chart, with each section of the pie representing a crop Footnote Footnote Footnote Footnote Footnote Footnote that was mentioned as present at that location in the documentary source. Unfortunately, owing to a lack of detail in the original source material, it is mostly impossible to glean a sense of proportion of each crop in relation to the others, and so mere “presence” rather than quantity is represented (again, archaeological and/or palynological research would almost certainly help here). Finally, coordinates were assigned to “regions,” in which the explorers described the presence of crops across a large expanse rather than at a specific point. The pie charts that refer to regions are marked by italics in the location name and by a thick blue line around them. Figure 3 shows Stanley’s geo-rectified map with all the crop data taken from his account of his journey in equatorial eastern Africa in 1875–76. Zoomed-in sections, the locations of which are also marked on Figure 3, are provided in the following subsections.
Spatial distribution of crops mentioned in documents relating to Stanley’s 1875–76 expedition in equatorial eastern Africa and subregions discussed in subsequent sections of the article.

Ugogo
Ugogo is the most arid region of those under review. Its rainy season lasts for four months, from December to April. According to rain gauge data captured at Dodoma (6.2S, 35.8E) between 1922 and 2018, it receives an annual average of around 561 mm of rainfall, although locations at the foot of the Rubeho Mountains towards the east receive closer to 700 mm annually.Footnote 39 These climatic conditions made the core of Ugogo marginal for the growth of crops with low resistance to water stress, such as maize and rice, especially if the rains started late or finished early. The marginality of environmental conditions for agriculture and the absence of tsetse flies in such arid conditions also encouraged cattle-ownership.Footnote 40
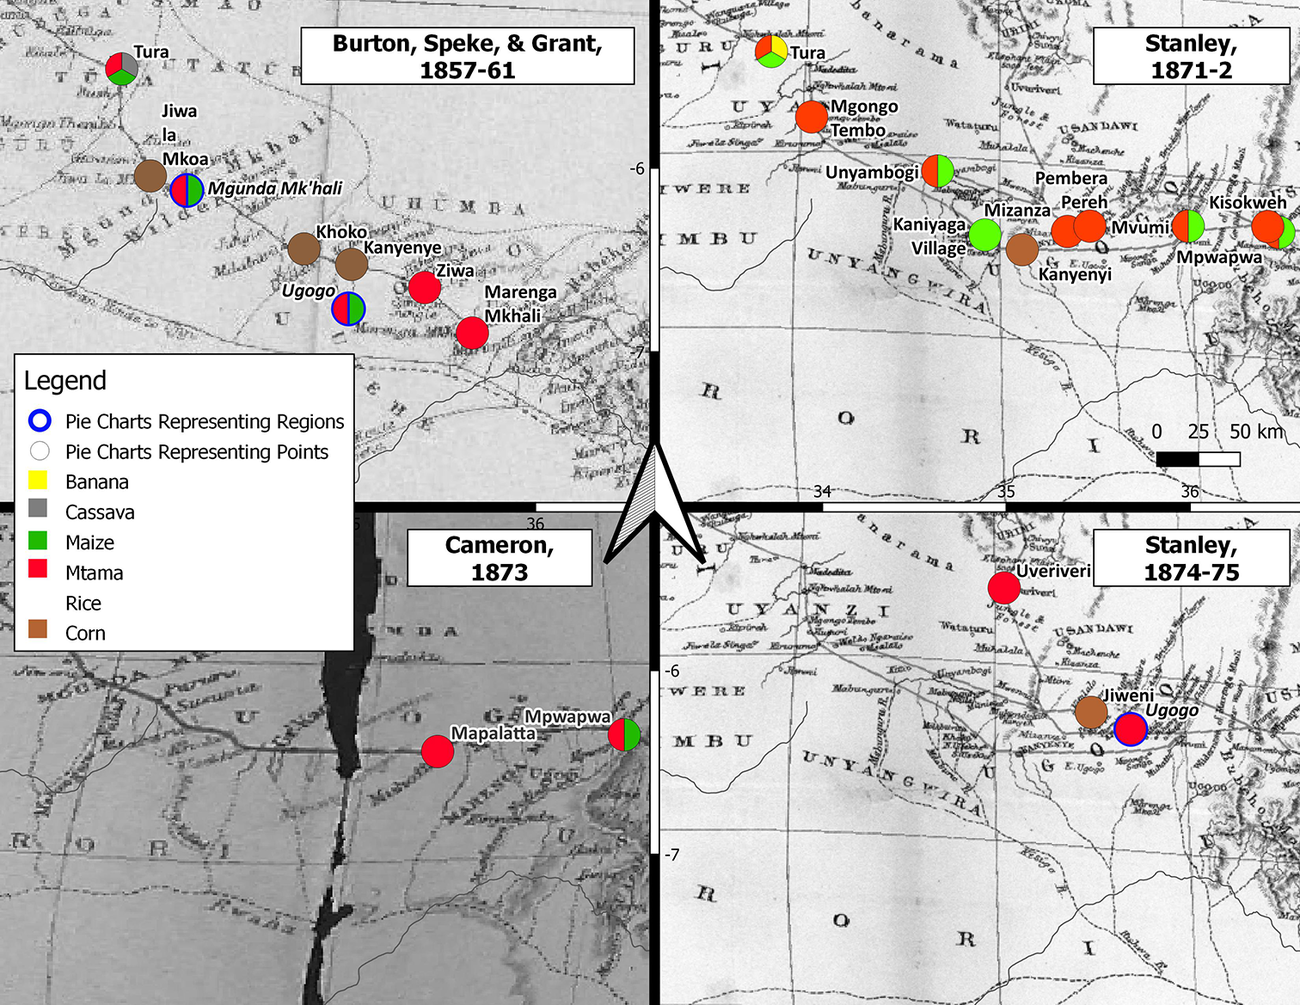
Despite these constraints, agricultural practices went through significant changes in Ugogo during the nineteenth century (Figure 4). Although both maize and mtama were mentioned by Burton, Speke, and Grant in 1857–61, they described the region more broadly as a land of scarcity.Footnote 41 Interannual variations in rainfall may have played a role in creating these conditions. Burton’s account suggests gradually drying conditions in 1856–57 and 1857–58, followed by late onset of rains in the 1858–59 season and drought in 1859–60.Footnote 42 By late 1860, local populations had been forced to eat seeds to save grain.Footnote 43 The return of more regular rainfall during the 1860–61 season may have helped to stave off famine.Footnote 44 Consequently, although the maps indicate presence of crops in certain locales, shortages of grains were omnipresent, forcing caravan leaders to send porters back and forth to more fertile zones, including into Unyamwezi.Footnote 45 Maize was not mentioned as available in any locale, although descriptions of the wider region suggest that attempts at growing it were made.
Maps of Ugogo. Note: The rip in Cameron’s map was present in the copy that the author digitized.

By contrast, both maize and mtama were widely available throughout Ugogo during the early 1870s. This is most clearly shown in Stanley’s map referencing his journey through Ugogo in 1871, and it is supported by statements made in Cameron’s account from 1873. The latter wrote:
The Mgunda Mkali [6.1S, 34.1 E] … was only just beginning to be cleared when Burton and Speke were in the country … Now, however, things are much changed for the better … Water has been found in many places, large spaces have been cleared and brought under cultivation, and, under the dominion of man, some of the most fertile … spots on Africa are now scattered in the midst of what was formerly … forest.Footnote 46
Stanley also portrayed Ugogo as a land of plenty in 1871–72, with mtama and maize being in abundance.Footnote 47 Some of the latter may have been imported from the west. However, by this time, the town of Mpwapwa had emerged (6.3S, 35.6E), which was reliant on an expansion of cultivation, including of maize, at the foot of the Rubeho mountains.Footnote 48 Abundance here and further west and northwest owed itself partly to patterns of expanding cultivation described by Cameron, but also to climatic conditions.Footnote 49 Stanley made several references to the 1870–71 rainy season being exceptionally wet, which would have aided the growth of Ugogo’s grains, especially maize.Footnote 50 Given the abundance of cultivation, indicated above, Cameron’s account also suggests regular rainfall in 1872–73.Footnote 51 General wetness, exploitation of maize as well as mtama, and an expanded area under cultivation, increased Ugogo’s agricultural yields by the early 1870s.
But the reliance on regular rainfall to reap the benefits of agricultural change increased vulnerabilities to the effects of drought. This is partly apparent from Stanley’s map and account of his visit to the region during the rainy season of 1874–75. Although he traveled northwards from around 33.3E – meaning he did not report on the regions further west that he, Cameron, Burton, and Speke reported on beforehand – the differences in his and earlier descriptions of the region between this point and Mpwapwa are stark. Stanley wrote that the rainy season only set in on 23 December 1874, which is significantly late, and that there were shortages of food, which suggests that the rains were deficient in 1873–74 as well.Footnote 52 Thus, mtama was almost certainly the only available grain; although he mentioned “corn” at Jiweni, meaning that maize is a possibility, his report on mtama being the only available staple in Ugogo strongly suggests he was referring to sorghum or millet here as well. High prices and general scarcity forced him to rely on a small supply of rice for sustenance, which he had brought with him from the coast.Footnote 53
Overall, then, adoption of maize and expansion of the cultivated area in Ugogo were made on tenuous ground. The size of harvests, and thus also the availability of food, fluctuated dramatically with seasonal rainfall variability. This can be attributed to two factors. First, the shortness of the rainy season and general aridity in Ugogo meant that late starting or early finishing rainy seasons increased the chances of crops withering during a protracted dry season. Second, farmers’ adoption of maize alongside mtama decreased resistance to water stress. Although Stanley’s account of 1874–75 indicates this heightened vulnerability to the effects of drought on its own, increased frequency of droughts from the late 1870s and into the 1880s, which were recorded by missionaries, emphasizes the point. Food was generally unavailable in Mpwapwa during and following a drought year in 1876–77, and famines throughout Ugogo occurred during the severe droughts of 1879–80 and 1883–85.Footnote 54 Cassava, which is highly drought resistant, does not appear to have been grown in any large quantities at any point – a phenomenon that persisted during the colonial period despite its ostensible suitability under drought conditions.
Unyamwezi
Unyamwezi is a spatially ambiguous region. Parts of Lake Victoria’s southern shores, for example, were subject to direct political influence from Nyamwezi rulers, notably Mirambo (c. 1840–84), for some of the nineteenth century, and so might be considered part of “Greater Unyamwezi.”Footnote 55 However, the core of Unyamwezi is usually considered to be the miombo savanna region at the center of a high plateau – roughly 1,000 m–1,500 m in elevation – in present-day west-central Tanzania.Footnote 56 It is fertile and, compared to Ugogo, well-watered. It receives rainfall in a six-month-long rainy season between November and April. Tabora (5.0S, 37.8E), the largest nineteenth-century urban space in the region, receives an average of 896 mm of rainfall per year, according to rain gauge data collected during the twentieth century.Footnote 57 High levels of fertility and comparatively high levels of rainfall contributed to Unyamwezi becoming a major “breadbasket” in the wider region during the nineteenth century (Figure 5).Footnote 58
Maps of Unyamwezi.

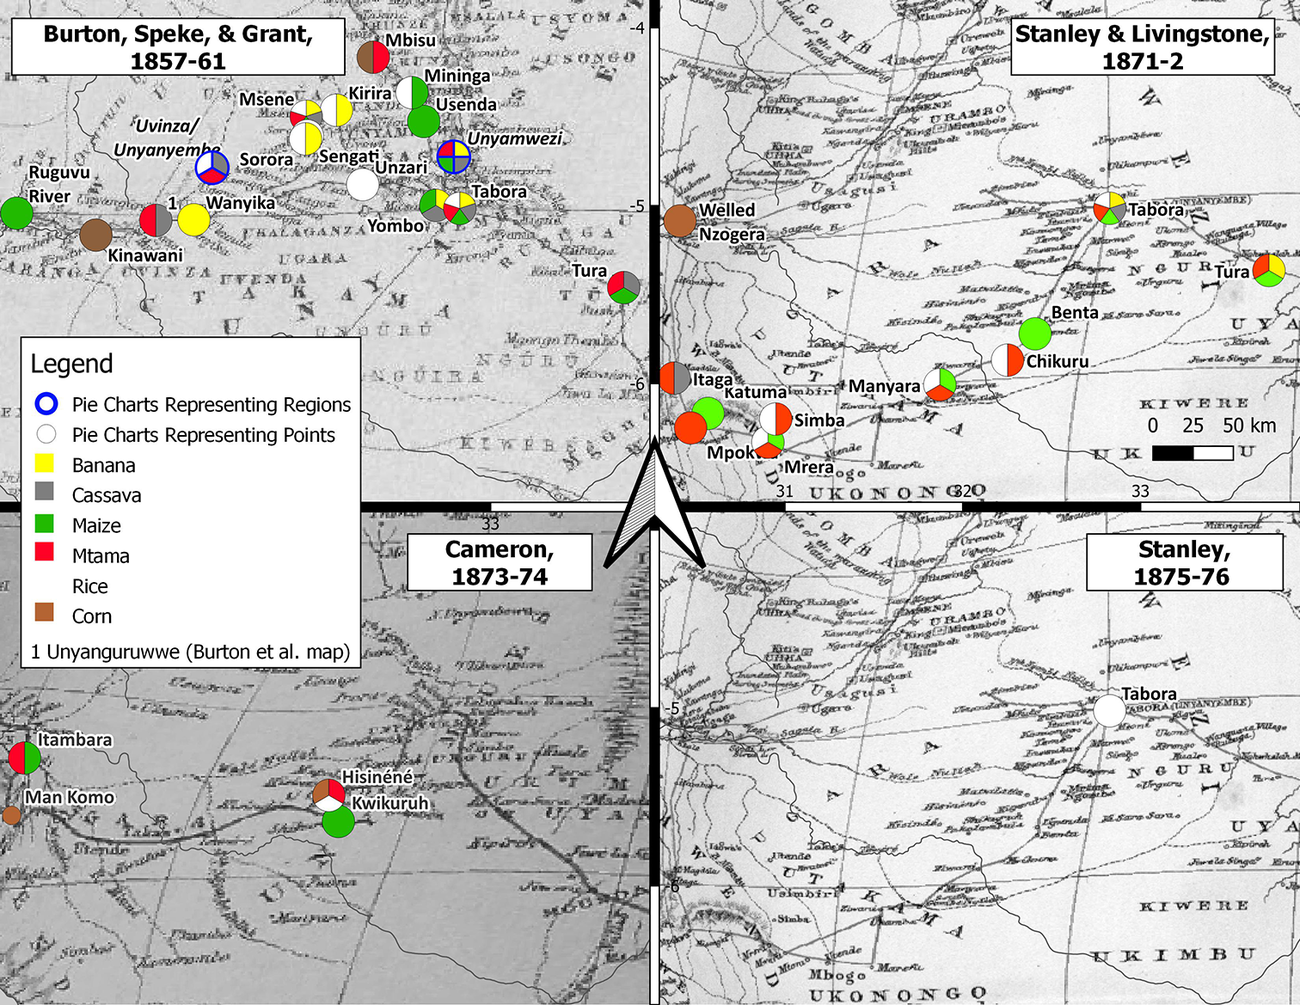
Interoperability of data presents a challenge for assessing changing crop choices over time in Unyamwezi, however. This is because the largest datasets cover different areas west of Tabora. The rise of Mirambo’s state and associated violence roughly between 4.5S and 4S on Burton and Speke’s line of travel during the second half of the 1860s inhibited travel westwards in the early 1870s. Thus, Stanley and Livingstone were forced to follow a more circuitous route to between Tabora and Lake Tanganyika, which first went southwards to around 6.3S, before turning westwards and then northwards, meeting Burton and Speke’s route at roughly 30.5E. Cameron’s account, meanwhile, contains few relevant datapoints, and Stanley bypassed most of the region in 1875–76, reporting only on the availability of rice grown in Tabora as an example of coastal traders’ farming practices in equatorial eastern Africa more broadly.Footnote 59 In his account, Tabora was like other towns with large coastal trader populations, in that it was now significantly reliant on rice as a staple crop.Footnote 60 This characterization of Tabora is supported by the other maps in Figure 5.
The introduction of rice, nevertheless, may represent major change to the region’s agricultural regimes. Mtama farming centered on the plains, and most Nyamwezi farmers in central and eastern areas neglected river valleys because they could attract vectors for disease and because they often flooded during the rainy season, making travel difficult.Footnote 61 But, as seen in Speke’s map (1857–61), rice and bananas figured prominently among the crops grown in much of Unyamwezi by the late 1850s/early 1860s, especially in the settlements around Msene (4.5S, 31.9E), many of which were all on the banks of rivers. Bananas probably grew wild in such locales and were used as an insurance policy against drought-induced failure of grains, which may have occurred at the time of Burton’s, Speke’s, and Grant’s visits. Meanwhile, these river valleys were also ideal for rice farming, which probably attracted coastal traders, as they had a cultural preference for rice over other staples.Footnote 62 In subsequent years, Mirambo, whose state was centered in the same locale, prioritized rice farming in these locales.Footnote 63
During these intervening years, rice farming continued to spread elsewhere in Unyamwezi. Burton was explicit that rice farming ceased west of Unzari (4.8S, 33.2E) and Sorora (4.6S, 32.0E), but conditions had clearly changed by the 1870s.Footnote 64 Rice and maize were prominent much further west in Stanley’s and Livingstone’s accounts from 1871–72, in places such as Chikuru, Manyara, Simba, and Mrera, as well as around and beyond Lake Tanganyika (see subsequent sections). It is possible, given that Burton and Speke did not travel through these settlements, that rice was being grown in these parts of southwestern Unyamwezi in the late 1850s/early 1860s, but it is unlikely. Coastal traders had yet to settle in this zone and it was less connected to long-distance commercial routes than central and western regions,Footnote 65 and rice was certainly not being grown in Ujiji on Lake Tanganyika’s northeastern shore at this point (again, see below). Of equal significance, though, is the prevalence of maize in the early 1870s, especially as it was rare in Burton’s and Speke’s accounts. At Benta (5.7S, 32.4E), for example, Stanley wrote that maize had completely usurped mtama by September 1871, a pattern that was confirmed by Cameron at Kwikuru, which is roughly in the same locale, two and a half years later.Footnote 66 By the 1870s, many Nyamwezi farmers were growing high-yield grains on plains and in river valleys, sometimes in place of indigenous staples.
Although better-watered than Ugogo, climatic and other factors did contribute to harvest shortfalls. According to Speke, late 1850s and early 1860s droughts contributed to the whole area around Tabora becoming “half-starved,” with poorer populations relying on wild grasses for sustenance.Footnote 67 Shortages in this context were exacerbated by the effects of war.Footnote 68 Similarly, warfare and the violent expansion of Mirambo’s state contributed to depopulation and subsequent shortages in southwestern Unyamwezi in 1871, despite apparently regular rainfall.Footnote 69 More significant shortages towards the center of Unyamwezi developed in the second half of the 1870s and 1880s. Severe droughts in 1876–77, 1879–80, 1883–84, 1886–87, and 1887–88 contributed to famine and the collapse of Mirambo’s state in 1884–85, as well as to famines in and around Tabora in 1887–88.Footnote 70 In each example of drought, increasing reliance on high-yield crops with little resistance to water stress probably exacerbated harvest shortfalls.Footnote 71 As in Ugogo, farmers were generally reticent to grow cassava, a pattern which again persisted into the colonial period.Footnote 72
Lake Victoria and surrounds
The regions around Lake Victoria represent well-watered highland areas. Present-day Kampala (0.3N, 32.6E), just beyond the lake’s northern shores, receives an average of 1,216 mm of rainfall per year according to twentieth-century rain gauge data, and Ukerewe Island (2.1S, 33.0E) in the southeast of the lake, receives 1,229 mm.Footnote 73 Although hinterland areas tend to receive somewhat less than this, these figures are upwards of 20 percent higher than in the savanna regions of equatorial eastern Africa further to the south, such as in Unyamwezi. Although dry months occur, they are not so severe as further south, with rain falling perennially. The wettest months are September–December and March–May, which is broadly in line with seasonal patterns in equatorial eastern Africa’s coastal and island regions. High altitudes (contributing to lower average temperatures) and abundant rainfall enabled reliance on bananas and plantains as staples (Figure 6).
Maps of Lake Victoria and surrounds.

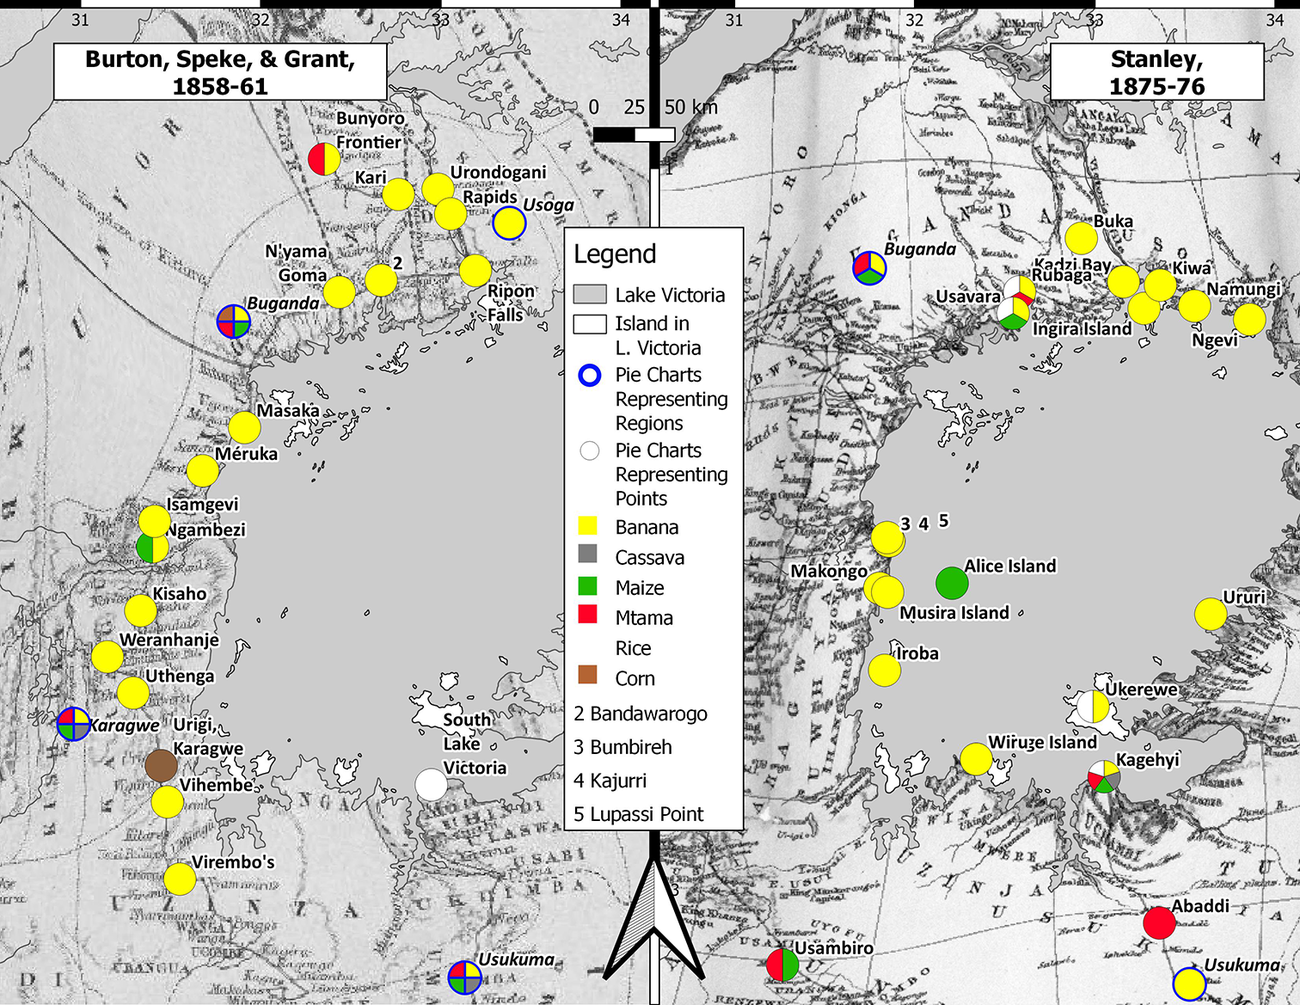
The core regions covered by the explorers’ datasets are Buganda (to the north and northwest of Lake Victoria), Karagwe (west), Uzinza (southwest), and Usukuma (south), in addition to Ukerewe Island. Only Speke, (in 1858 and 1861–62), Grant (in 1861–62), and Stanley (in 1875) visited these regions in the time-period under review, and so only the maps relevant to their journeys are included in the analysis. There are, nevertheless, challenges regarding interoperability of data. Most of Speke’s and Grant’s datapoints towards the west of the map are in the lake’s hinterland, while Stanley’s are on the lake’s shores and islands. This is despite their following similar routes overland through Karagwe. Each explorer described the general abundance of foodstuffs in said region, but Stanley neglected to mention the available agricultural produce on his journey southwards from Buganda until he reached Usambiro, which may be regarded as the northwestern frontier of Unyamwezi. Similarly, Speke neglected to mention the crops growing at most locales in Usukuma in 1858, largely only stating regularly that the areas through which he passed were “well-cultivated.”Footnote 74 He and Burton reported the presence of mtama, maize, cassava, and bananas in the region more broadly, an assessment that is supported by missionary accounts from later in the century.Footnote 75
Despite these challenges, two broad trends are observable. The first is that maize and rice had limited impacts in most regions. Cultural preference coupled with climatic and environmental factors limited their appeal. Instead, farmers in Buganda, partly at the encouragement of the kabaka (king), expanded banana production to feed the growing capital (located within present-day Kampala) as an administrative and commercial center.Footnote 76 Coastal traders grew a comparatively small amount of rice in the same region by the mid-1870s, but their endeavors were not as significant to the overall agricultural regime as they were in the savanna regions further south. Even so, despite not adopting new, high-yield grain crops with low levels of resistance to water stress, urban growth still exposed vulnerabilities to the effects of drought. Famines and epidemics occurred in Buganda during and following the drought years of 1880, 1884, and 1888, which contributed to the collapse of central authority and the imposition of European colonial rule.Footnote 77
The second major trend that is observable from the maps is that Ukerewe Island and its nearby shoreline adopted a wide variety of crops. This was the only locale in this region that Speke identified as having rice available, which was probably a reflection of its novelty alongside other grains and bananas at that time. Stanley’s account further emphasizes the diversity of available produce. This represented a major agricultural change – although, given Speke’s account, it was largely instituted before the period under review. Indeed, according to oral traditions, it probably began developing in the late eighteenth or early nineteenth centuries, and possibly accelerated in the aftermath of a devastating drought and famine that occurred during the 1830s.Footnote 78 The extent of the famine contributed to the deposition of the king. His replacement then facilitated a “revolutionization” of the agricultural sector, partly to safeguard his position.Footnote 79 Consequently, Ukerewe was one of the earliest areas in equatorial eastern Africa to undergo a shift towards imported crops during the nineteenth century. The extent of change in terms of crops grown was much greater in Ukerewe than in many other equatorial eastern African regions, especially in the vicinity of Lake Victoria.
Lake Tanganyika and surrounds
Rainfall is variable on the shores of Lake Tanganyika, with annual averages at between 950 mm and 1,150 mm depending on locale according to twentieth-century rain gauge data. Ujiji (4.9S, 29.7E), the major nineteenth-century commercial center within this zone, receives an annual average that is towards the lower end of this spectrum.Footnote 80 As in Unyamwezi, November–April are the wettest months. The climate, physical environment, and timing of the region’s integration with the world economy contributed to major changes in the region’s agricultural sectors, some of which are clearly visible in the maps created for this article (Figure 7).
Maps of Lake Tanganyika and surrounds.

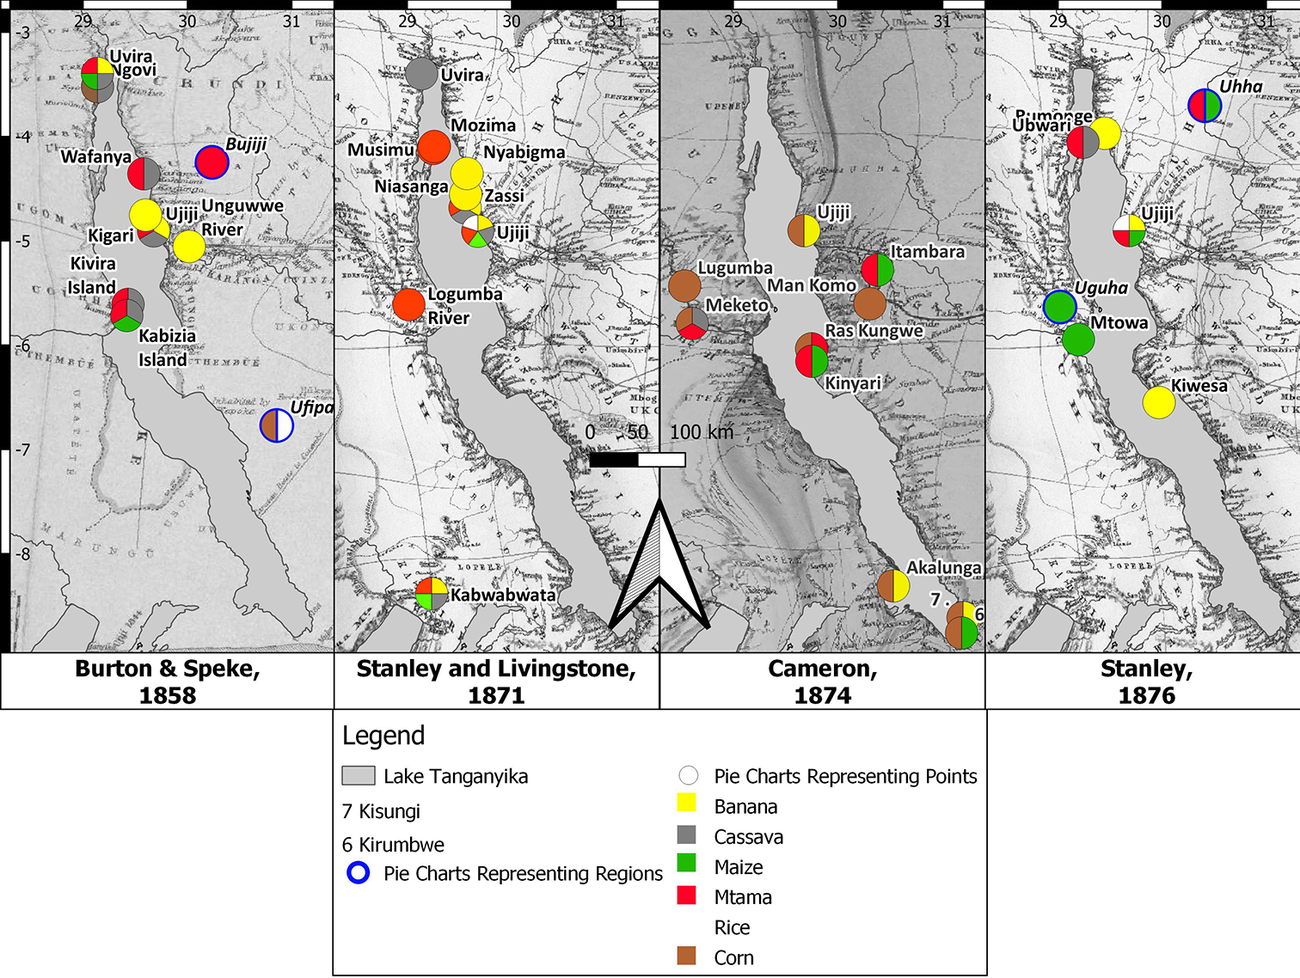
Again though, and as with Unyamwezi and the regions around Lake Victoria, there are challenges with interoperability of data. All the explorers began their journeys around Lake Tanganyika in Ujiji. But Burton and Speke in 1858 and then Stanley and Livingstone in 1871 only traveled around the northern end of the lake. Both Cameron (1874) and then Stanley (1876) traveled around the lake’s southern end, but they commented very little on the presence of different crops: both stocked up with food in Ujiji before embarking on lakeward travel, and so they were probably less interested in what was being grown in the other lakeshore locales they visited.Footnote 81 An intersection of data that transcends this north/south divide does occur, however, around (5.9S, 29.2E) between Speke’s (1858) and Stanley’s (1876) data. Additionally, Livingstone’s reports of Kabwabwata and other unmapped regions to the southwest excepted, all datapoints were made from the perspective of lakeward travel, contrary to around Lake Victoria, where datapoints partly come from reports of traveling overland in its vicinity. Thus, several locations were visited more than once, allowing for indications of change over time.
The most significant agricultural change around Lake Tanganyika occurred in Ujiji. In 1858, its agricultural regime was dominated by mtama, supplemented by bananas and cassava. Such conditions prevailed around much of the northern lakeshore at this time (Uvira excepted, which became an early gateway from the lake region to regions further west), probably limiting the effects of drought. Burton stated that rice was not being grown in Ujiji, although he hinted that attempts had been made before.Footnote 82 He attributed its absence at the time of his visit to local preference for sorghum, rather than because of climatic or environmental factors.Footnote 83 By contrast, from the early 1870s, increased demand from urban settlers and passing caravans necessitated the growth of maize and rice as higher potential yield staples. Absence of cassava in Cameron’s and Stanley’s (1876) respective descriptions suggest that growth of this drought-resistant crop was sacrificed to make way for these potentially more abundant grains. Stanley’s two maps suggest that similar patterns did not occur further north than Ujiji during the time period under review, although missionary sources from the late 1870s and 1880s indicate that they did eventually prevail there as well.Footnote 84
Further south, the maps suggest significant change around (5.9S, 29.2E) on the western side of the lake. Some estimation is necessary, as Speke reported on islands opposite the mainland and Stanley (in 1876) reported on the mainland itself. However, both sources are notable for the reports on maize. In 1858, growth of maize as a supplement to mtama and cassava helped to facilitate the development of a small coastal trader station on an island, which traders used as a base from which to travel into the lake’s western hinterland and towards the regions around the Lualaba River.Footnote 85 But, by the mid-1870s, their main commercial center had shifted to Mtowa on the mainland. By this stage, maize had become the major staple. Its production was reliant on regular rainfall and on the fertile soils surrounding the Lukuga River. It dominated the region’s agricultural regime, so much so that, in good rainfall years, it became the region’s most notable export, especially to Ujiji.Footnote 86 As with other regions in equatorial eastern Africa that went through similar transitions, however, droughts contributed to shortages, inflation, and instability, notably in the aftermath of weakened harvests in 1880 and 1884.Footnote 87
The data from the period under review is too thin to make any overarching statements about changing agricultural practices around the southern end of the lake. As with parts of the northern end, however, missionary sources from the late 1870s and 1880s indicate major changes did occur later. Commercial growth around several centers was built on maize and rice production in lakeshore towns, although droughts during the 1880s periodically forced lakeshore inhabitants to purchase hardier grains from inland zones at inflated prices.Footnote 88 The strength of the “explorer” data, however, is that it shows significant agricultural change in two distinct locales on a scale that is comparable to that which occurred earlier around Ukerewe, as well as in Unyamwezi and Ugogo. The fact that Lake Tanganyika was only on the western edge of coastal traders’ expansion during Burton and Speke’s 1858 visit contributed to there being little agricultural change up to that point, other than with the incorporation of cassava, which may have minimized shortages in drought years during the early 1860s. But greater integration with the world economy thereafter subsequently contributed to significant change, particularly with the adoption of high potential yield grains in and around Ujiji and Mtowa.
Manyema
Manyema’s westernmost reaches, being located in the eastern Congo rainforests, are among the most well-watered in all inland equatorial eastern Africa. A limited rain gauge dataset from Malela (limited because it only covers fifteen years between the 1930s and 1950s), which is just outside of Nyangwe (4.2S, 26.1E), suggests that average annual rainfall is around 1,375 mm. Further East, Fizi (4.3S, 28.9E) receives around 1,200 mm per year. These figures are all higher than that for Kalemie, near Mtowa on the west-central shore of Lake Tanganyika (5.9S, 29.2E), whose annual average is around 1,050 mm.Footnote 89 Throughout Manyema, rainfall is heaviest between November and April, although September and October are considerably wetter towards the west than they are further east. General wetness contributed to the widespread adoption of crops with lower resistance to water stress, but which had higher potential yields (Figure 8), during the nineteenth century.
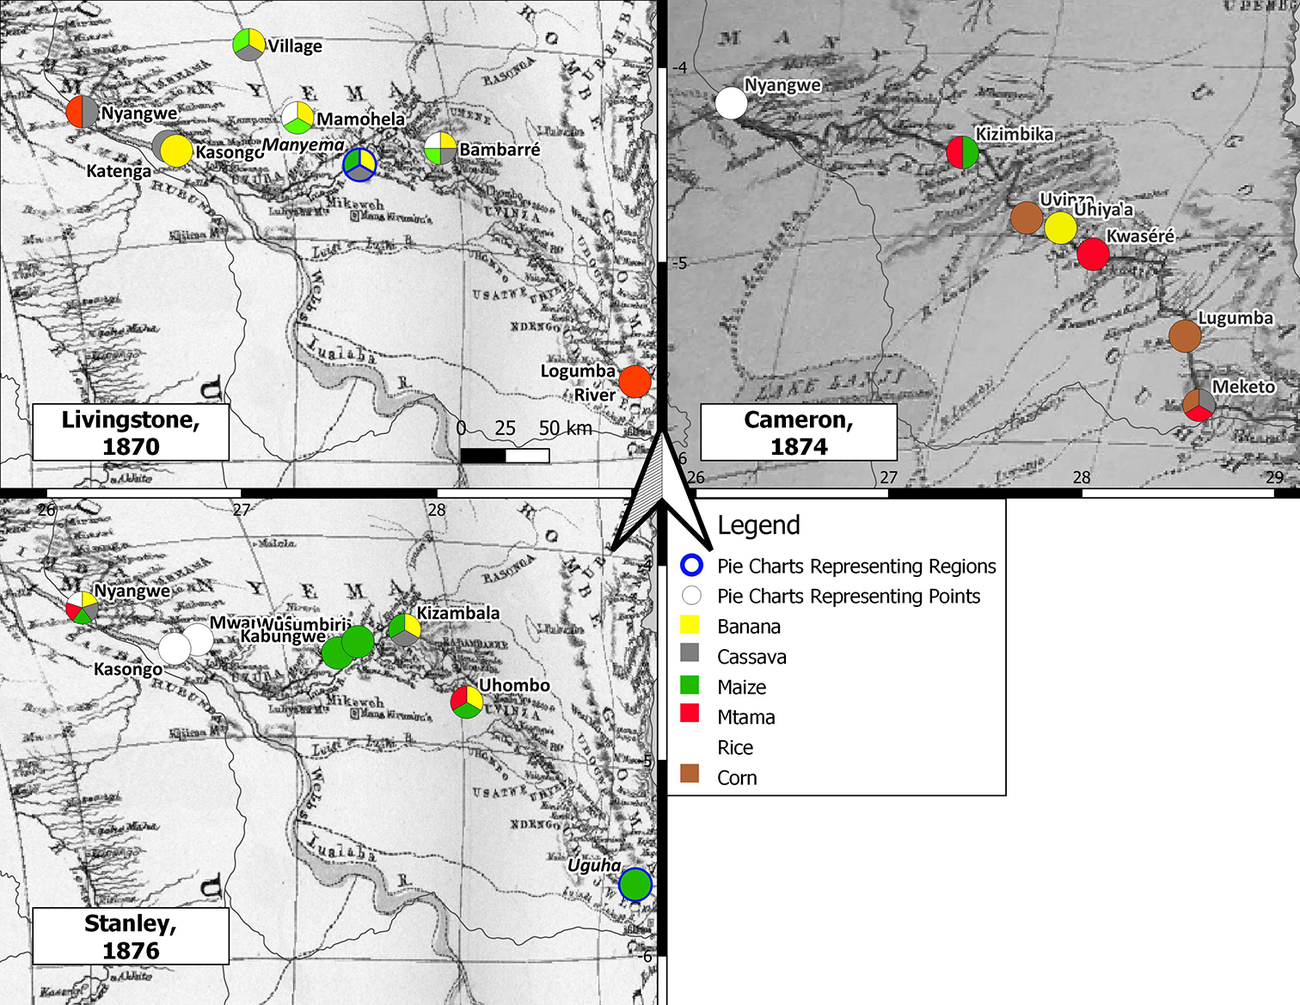
Maps of Manyema.

As with Unyamwezi, the limits of Manyema are ambiguous. In present times, Maniema is a province in the eastern DRC. In the nineteenth century, the term could broadly apply to the regions on the central caravan route west of Lake Tanganyika’s hinterland and up to just beyond Nyangwe. It was highly heterogeneous in terms of population. Burton and Speke did not travel in this zone, and so their map is excluded from Figure 8. But the fact that Livingstone (1870–71), Cameron (1874), and then Stanley (1876) followed roughly the same path between Nyangwe and Mtowa on the western shores of Lake Tanganyika means that direct comparisons across time are possible, although there is a slight divergence between 4.3S, 27.8E and Nyangwe: Stanley took a slightly more southern route in this context than his two European predecessors. Still, the maps suggest broad trends across this region.
Livingstone entered the region when it was still on the western edge of the coastal traders’ expansion. Coastal traders first permanently settled in Nyangwe, which became the region’s major commercial center, in around 1867, merely three years before Livingstone’s arrival. Major changes were already afoot in the wider region, however. Maize was the most readily available grain in much of Manyema, especially in the well-watered regions further towards the west.Footnote 90 It is possible that it was already present in the region via connections to the western African coast before the expansion of commercial networks from the east. West of 28.5E on Livingstone’s route, mtama was only available at Nyangwe, implying that it had been replaced by maize in the intervening zone.Footnote 91 Meanwhile, coastal traders had made small, temporary stations at Bambarre (4.4S, 28.0E) and Mahomela (4.2S, 27.3E), where they had also begun to grow rice alongside maize and local bananas. In Manyema, the gradual westward migration of coastal trader settlements in the 1860s contributed to what may have been a longer-term process in which indigenous staples became replaced with high potential yield imports.
Cameron’s and Stanley’s maps for respectively 1874 and 1876 confirm these processes. Given Livingstone’s statements (as well as references to maize in Stanley’s account), Cameron’s regular references to “corn” can be assumed to be maize. By the time of his visit in 1874, Bambarre and Mahomela had ceased to exist as significant coastal trader entrepots. The main centers had moved to the west, principally Nyangwe, but also Kasongo (4.4S, 26.7E) and Mwana Mamba’s (4.3S, 26.8E), the latter two being shown in Stanley’s map.Footnote 92 Thus, although indigenous farmers in the intervening region continued to grow maize, rice only became available at the major coastal trader settlements. The novelty of rice’s availability to Cameron is symbolized by it being the only crop he mentioned at Nyangwe. Stanley’s account, however, confirms that it was just one of several crops grown there. As with Tabora in Unyamwezi, Nyangwe became the major granary or “breadbasket” of its region.
Nyangwe, Kasongo, and Mwana Mamba’s probably became favored by coastal traders because they were especially well-watered compared to more eastern regions in Manyema, and because they were on the banks of the Lualaba River, whose annual floods facilitated wet rice farming.Footnote 93 Shortages in the wider region, however, were not unknown. Livingstone reported on “hunger” around Bambarre in 1870, a phenomenon that he attributed to heightened demand for food from the arrival of caravans and to local farmers’ reticence to grow cassava.Footnote 94 Hamed bin Muhammad el-Murjebi (also known as Tippu Tip), may have reported similar shortages further south with the arrival some of the first coastal-trader caravans in 1867.Footnote 95 Subsequent shortages and consequential migration during the late 1870s and 1880s were generally attributed to violence and warfare, rather than to drought.Footnote 96 Nevertheless, a wetter climate than elsewhere, the annual flood of the Lualaba River, and the growth of both indigenous crops and high-yield imports limited shortages at settlements on the shores of the Lualaba until the establishment of European colonial rule from the 1890s.
Conclusion
Although limited in certain respects, the visualizations of changing crop choice over time created in this article suggest certain region-wide patterns. First is that there appears to have been a general increase in the availability of high-yield imported grains between the late 1850s/early 1860s and the 1870s around important commercial routes and nodes. This applies especially in Unyamwezi, central Lake Tanganyika, and Manyema. Low levels of annual rainfall prevented such patterns from persisting to the same extent in Ugogo, even if maize was available in rain-abundant years. The abundance of plantains/bananas around much of Lake Victoria, meanwhile, limited demand for such imported grains there. A second trend is the existence of a possible rice frontier. The maps suggest that it was rare beyond western Unyamwezi in the late 1850s/early 1860s, but much more widespread thereafter, including in Ujiji and in Manyema. In the latter region, after being relatively dispersed in c. 1870, rice farming gradually became concentrated around settlements on the banks of the Lualaba River. In this sense, rice farming followed where coastal traders settled, although local populations also adopted it in certain locales. Finally, certain continuities over time must be acknowledged, such as the persistence of plantains/bananas around Lake Victoria and the relative absence of cassava as an important staple – even in times of drought.
Of more significance, however, are the implications these maps have for further research. Much is known about the economic and political histories of major commercial and administrative centers in the region, such as of Mpwapwa, Tabora, and Ujiji.Footnote 97 The maps imply major changes in these towns’ rural hinterlands, notably by hinting at processes that were key to feeding their growth. At the same time, they also shed light on factors, such as heightened drought vulnerability in agricultural regimes, that contributed to instability during the 1880s and into the early colonial period. These kinds of histories deserve greater attention. Meanwhile, the maps also point to areas of major transformation, such as in western Ugogo and around Benta/Kwikuru in Unyamwezi, where historical research has not been abundant on any theme. The maps and accompanying descriptions suggest that new land was opened for cultivation in the former and mtama was abandoned for maize in the latter. These changes suggest local innovations that were not necessarily tied to the caravan system. On the ground research using methods in archaeology and palynology may help to uncover these histories further. Conducting this research focusing on the nineteenth century may help to establish a longer-term context to the better-known environmental challenges of the 1880s and early colonial period.
Acknowledgements
The research for this article was funded by the Social Sciences and Humanities Research Council of Canada. I wish to thank Hamid Farahani for his data collection efforts during the early part of the research process. And I wish to thank two anonymous reviewers, whose insightful comments helped me to significantly improve how the article is framed.
The author reports no conflict of interest.

 Open access