


Globally, the number of persons aged 65 or over has been escalating in the last decades, and it is expected to more than double between 2019 and 2050(1). Malnutrition is one of many clinical conditions that have an impact on health and well-being in advanced age(Reference Cereda, Pedrolli and Klersy2). It is estimated to affect 3·1 % (95 % CI 2·3, 3·8) of older community-dwellers and 17·5 % (95 % CI 14·3, 20·6) of nursing home (NH) residents worldwide(Reference Cereda, Pedrolli and Klersy2). Malnutrition is defined by the European Society for Clinical Nutrition and Metabolism as a ‘state resulting from lack of uptake or intake of nutrition leading to altered body composition and body cell mass leading to diminished physical and mental function and impaired clinical outcome from disease’(Reference Cederholm, Barazzoni and Austin3). There is solid evidence that malnutrition adversely influences older adults’ functional status and quality of life, and it increases both morbidity and mortality(Reference Norman, Pichard and Lochs4).
Several risk factors for malnutrition have been identified among older persons(Reference Favaro-Moreira, Krausch-Hofmann and Matthys5). Age by itself, and biological, socio-psychological and environmental changes that occur with ageing increase the odds for malnutrition(Reference Nieuwenhuizen, Weenen and Rigby6). Anorexia, impaired sensory functions, physical limitations, compromised cognitive function, financial difficulties, social isolation, among others may all concur to an insufficient or imbalanced food intake, which may lead to malnutrition(Reference Favaro-Moreira, Krausch-Hofmann and Matthys5–Reference John, Bullock and Brenner7). In fact, there are a few studies showing that a lower nutrient intake(Reference Jyväkorpi, Pitkälä and Puranen8,Reference Ongan and Rakıcıoğlu9) , worse diet quality(Reference Jyväkorpi, Pitkälä and Puranen8) and less diet variety(Reference Donini, Poggiogalle and Piredda10) are associated with malnutrition. However, the existing evidence linking malnutrition with a posteriori derived dietary patterns(Reference Machón, Mateo-Abad and Vrotsou11,Reference Madeira, Severo and Oliveira12) and adherence to predefined nutritional recommendations is limited and not consensual(Reference Jyväkorpi, Pitkälä and Puranen8,Reference Hengeveld, Wijnhoven and Olthof13) .
The aforementioned diet-related factors could potentially be modified in order to prevent the deterioration of the nutritional status in older age. For this to happen, more research is needed to identify which dietary components should be specifically targeted by food and nutrition policies and interventions. Yet, population-based dietary surveys that include older adults with no upper age limit are scarce. Particularly, there is a gap in the literature concerning the relationship between dietary intake and malnutrition using large representative samples including institutionalised and non-institutionalised older people. Therefore, the aims of the present study were to (a) estimate the association between energy/nutrients intake and malnutrition and (b) characterise inadequacy of nutrients intake by nutritional status in institutionalised and non-institutionalised older adults.
Methods
Study design and subjects
Data presented here derived from the Portuguese Elderly Nutritional Status Surveillance System (PEN-3S) study(Reference Madeira, Peixoto-Plácido and Goulão14), which was conducted in articulation with the National Food, Nutrition and Physical Activity Survey (IAN-AF) 2015–2016(Reference Lopes, Torres and Oliveira15). The main aim of the PEN-3S study was to characterise the nutritional status of the Portuguese population aged 65 or older living in NH or in the community. It followed a cross-sectional design and included a nationally representative sample, as detailed elsewhere(Reference Madeira, Peixoto-Plácido and Goulão14). Briefly, a multistage sampling was followed: (1) random selection of NH and primary healthcare units from the list of all existing institutions in the seven main Portuguese regions (NUTS II) and (2) invitation to enrol to all NH residents, and to randomly selected community-dwellers registered in participating units, who were aged ≥ 65 years. Participation rates, given as the ratio accepted/invited to enrol, were 93 % for NH residents and 23 % among community-dwellers. The exclusion criteria were being bedridden or hospitalised; not able to understand and/or answer the questionnaire (e.g. due to dementia, severe hearing or visual impairment; non-Portuguese speakers); or living in Portugal for <1 year. This study was approved by the National Data Protection Committee, Faculdade de Medicina, Universidade de Lisboa Ethics committee and all seven Regional Health Administrations Ethics committees.
For the present analyses, participants presenting cognitive impairment according to the Mini Mental State Examination(Reference Guerreiro, Silva and Botelho16) (609 NH residents and 192 community-dwellers) were excluded from the initial sample of 2306 participants (1186 NH residents and 1120 community-dwellers) from the PEN-3S study. Additionally, those without complete information regarding nutritional status and dietary intake (i.e. two 24-h recalls per participant; fourteen NH residents and ninety-one community-dwellers) were also excluded. Therefore, the final sample of the present study included 1400 individuals (563 NH residents and 837 community-dwellers).
Data collection procedures and instruments
Data collection required a written informed consent from each participant and occurred from October 2015 to September 2016 at the NH, primary healthcare unit or, less frequently, at the participant’s home. Face-to-face structured interviews were conducted by the research team assisted by computer, with software developed specifically for this purpose(Reference Lopes, Torres and Oliveira17). Data included socio-demographic characteristics (sex, age, marital status, monthly income, education), self-reported health, functional status, loneliness feelings, nutritional status and dietary intake.
Participants were asked to rate their general health status using a 5-point Likert-type scale (from 1 ‘Poor’ to 5 ‘Excellent’ health)(Reference DeSalvo, Fan and McDonell18). Functional status to perform instrumental activities of daily living (e.g. using the phone, handling finances) was evaluated by the Lawton scale (0–8 points)(Reference Lawton and Brody19). A score below 8 denoted some degree of functional limitations. The UCLA Loneliness scale (16–64 points) was administered to study subjective feelings of loneliness and social isolation; a score >32 indicated the presence of loneliness feelings(Reference Russell20,Reference Pocinho, Farate and Amaral Dias21) . Nutritional status was assessed by the 18-item Mini Nutritional Assessment (MNA full form®, herein referred as MNA), which is structured in four domains (anthropometry, general status, dietary habits, and self-perceived health and nutrition states), providing a multidimensional assessment that is specific for older adults(Reference Rubenstein, Harker and Salvà22–Reference Vellas, Villars and Abellan24). Participants’ nutritional status was categorised according to MNA established cut-offs as normal (24–30 points), at risk of malnutrition (17–23·5 points) or malnutrition (<17 points)(Reference Rubenstein, Harker and Salvà22–Reference Vellas, Villars and Abellan24). This categorisation has been shown to predict a 2-fold risk of death (relative risk = 1·92, 95 % CI 1·55, 2·39) of malnourished community-dwellers compared with those at risk of malnutrition or well-nourished(Reference Marshall, Craven and Kelly25). A review of the 25 years of MNA reported a mean sensitivity and specificity of 80 and 68 %, respectively, against an extensive range of criteria, in forty studies(Reference Guigoz and Vellas26). Anthropometric measurements (weight, height, arm and leg circumferences) were performed according to international standard procedures(Reference Stewart, Marfell-Jones and Olds27). When it was not possible to measure height following those standards, hand length and the respective validated equations for the Portuguese population were used to estimate height(Reference Guerra, Fonseca and Pichel28). The MNA version that scores item F with calf circumference instead of BMI was employed when weight was not available to compute BMI(Reference Kaiser, Bauer and Ramsch29).
Dietary intake was assessed using two non-consecutive 24-h recalls, 8–15 d apart, in randomly selected days of the week, whenever possible according to participants’ availability, and across a whole year. Dietary assessment followed the EU Menu methodology, proposed by the European Food Safety Agency(30), and it was assisted by an electronic platform developed by the IAN-AF team (‘You eAT & Move’)(Reference Goios, Severo and Lloyd31). All food items, including beverages and food supplements that participants had consumed in the previous 24 h, were thoroughly described, following the Automated Multiple-Pass Method for 24 h (five steps)(Reference Moshfegh, Rhodes and Baer32). Recipes were disaggregated into ingredients, and food portions were estimated using pictures, household measures, weight/volume, standard units or default mean portions when quantity was unknown. The data collection software was linked to the Portuguese Food Composition Table, which was constantly updated with new items, which enabled the conversion of foods into nutrients(33). Finally, the mean intake of the 2 days of report was computed for each nutrient. The European Food Safety Authority Dietary Reference Values for nutrients were considered to determine the prevalence of adequate intake (AI)(34). Reference intake ranges were used for macronutrients, whereas average requirements, AI or tolerable upper intake level were used for micronutrients, depending on which reference value is available. For protein per kg of body weight, additional cut-offs (1 and 1·2 g/kg) were studied, based on recent clinical guidelines for older adults(Reference Volkert, Beck and Cederholm35).
Statistical methods
Taking into account the substantial expected differences between the two living settings in terms of their socio-demographic characteristics (sex, age and education), a propensity score (probability of being assigned to a certain group depending on baseline characteristics) was calculated considering those variables, in order to allow for the comparison between settings. This score was considered as weight in complex sample procedures, thus all the remaining statistical analyses were weighted for the socio-demographic characteristics of the most disadvantaged group (NH residents). Variables’ distributions and statistical assumptions were verified prior to the analyses. Total energy intake outliers were defined as intakes three times the interquartile range above the mean intake, and participants (n 5) were excluded from the global analyses. Micronutrients’ outliers were excluded only in the respective analyses (e.g. vitamin A outliers were only excluded for vitamin A analyses).
Estimates of mean intake of energy, macro and micronutrients in the two settings (NH v. community) were compared using the Wald F test. Considering the skewed distribution of micronutrients intake, these variables were log-transformed, and the geometric means are presented. Logistic regressions models were used to study the associations between energy, macro and micronutrients intake (continuous variables divided by the respective standard deviation) and nutritional status as assessed by MNA (‘at risk of malnutrition’ or ‘malnutrition’ (malnutrition risk) v. ‘normal nutritional status’). Results are presented as OR and 95 % CI. Model 0 is the crude model, whereas model 1 was adjusted for sex, age and education. Model 2 was further adjusted for non-collinear variables that were significantly associated with malnutrition risk in the univariate analyses (i.e. self-reported health status and loneliness feelings), and model 3 was adjusted for variables in model 2 plus energy intake. In the case of macronutrients, the adjustment was performed for energy from all other macronutrients excluding the one under study (e.g. for protein, model 3 was adjusted for total energy minus energy from protein). The Hosmer–Lemeshow test was used to assess the goodness of fit of model 3.
To assess the prevalence of inadequacy, the usual intake adjusted for intra-individual day-to-day variability was considered. These specific analyses were performed with SPADE® (Statistical Program to Assess Dietary Exposure; package SPADE.RIVM for R software version 3.4.0 for Windows). For those nutrients whose Dietary Reference Value is an AI, the method used here only allows to specify that inadequacy is ‘low’ if mean intake >AI, otherwise no conclusions can be drawn. SPSS® software, version 24.0 was used for all other statistical analysis. A significance level of 5 % was assumed in the present study.
Results
Samples characterisation
Comparing the participants’ characteristics between the two living settings (Table 1), the proportion of women was higher in the NH setting (70·0 % v. 48·9 %), as well as the proportion of participants aged 85 years or older (46 % v. 13 %), and the percentage of those attending school for <4 years (45·3 % v. 17·3 %). Also, 40·3 % of the NH residents and 23·4 % of the community-dwellers reported a ‘Poor or Very poor’ health status, while 84·0% and 31·1 %, respectively, presented some functional limitations in performing instrumental activities of daily living. Moreover, 37·3 % of the NH residents were at risk of malnutrition or malnourished, and 39·2 % reported feelings of loneliness, whereas in the community these percentages were 11·2 and 11·7, respectively.
Characteristics of the samples (NH residents and community-dwellers)
(Numbers and percentages)
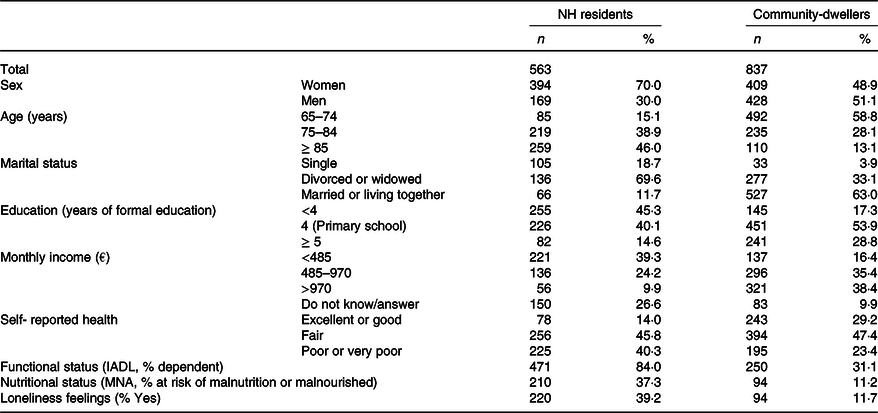
NH, nursing home; IADL, instrumental activities of daily living; MNA, Mini Nutritional Assessment.
Energy and nutrients intake by setting
After weighting for age, sex and education of the NH residents, the mean total energy intake was not significantly different between the NH residents (369·2 kJ, 95% CI 361·0, 377.4 (1544·7 kcal, 95 % CI 1510·5, 1579·0)) and the community-dwellers (362·0 kJ, 95% CI 347·9, 376·0 (1514·4 kcal, 95 % CI 1455·6, 1573·2), P value = 0·382), neither was the mean intake of total, mono or polyunsaturated fat (Table 2). Conversely, the proportion of total energy intake (% TEI) from protein and saturated fat was significantly higher in the community than in the NH setting. On the other hand, the mean intake of carbohydrates (total, mono and disaccharides) and fibre was significantly lower in the community compared with NH. In what concerns micronutrients intake, the only significant differences between the two settings were observed for vitamin A and folates, which were higher among NH residents (Table 2).
Energy, macronutrients and micronutrients intake by setting, weighted for socio-demographic characteristics of NH residents
(Mean values and 95 % confidence intervals)
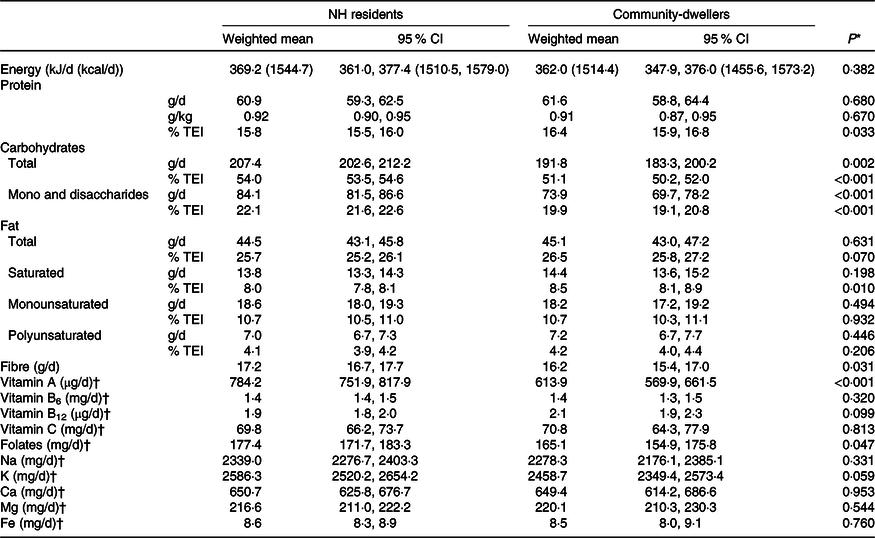
NH, nursing home; %TEI, % of total energy intake.
* Model effects (Wald F test) to compare weighted means between groups.
† Geometric mean.
Dietary intake and nutritional status by setting
Among NH residents, a higher energy intake was significantly associated with lower odds of being at risk of malnutrition or malnourished (OR = 0·66, 95 % CI 0·50, 0·86), even after adjusting for socio-demographic characteristics (sex, age, education), self-reported health and loneliness feelings (model 2, Table 3). In the community, the same inverse association with total energy was observed, but only significant in the crude model (model 0; OR = 0·53, 95 % CI 0·34, 0·83).
Association of energy and macronutrients intake (divided by the standard deviation) with nutritional status (MNA), weighted for socio-demographic characteristics of NH residents
(Odds ratios and 95 % confidence intervals)
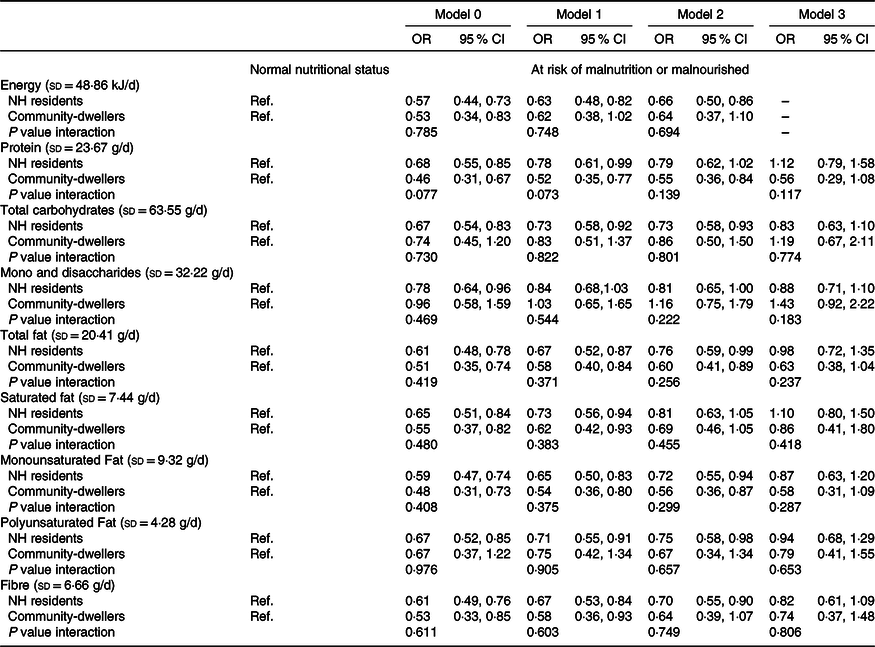
MNA, Mini Nutritional Assessment; NH, nursing home; Ref., reference category.
Model 0: Crude.
Model 1: Adjusted for sex, age and education.
Model 2: Adjusted for variables in model 1 plus loneliness feelings and self-reported health.
Model 3: Adjusted for variables in model 2 plus total energy intake.
Among NH residents, higher intakes of total carbohydrates (OR = 0·73, 95 % CI 0·58, 0·93), total fat (OR = 0·76, 95 % CI 0·59, 0·99), monounsaturated fat (OR = 0·72, 95 % CI 0·55, 0·94), polyunsaturated fat (OR = 0·75, 95 % CI 0·58, 0·98) and fibre (OR = 0·70, 95 % CI 0·55, 0·90) were significantly associated with lower odds of being at risk of malnutrition or malnourished, after adjusting for socio-demographic characteristics, loneliness and self-reported health (model 2, Table 3). In community-dwellers, protein (OR = 0·55, 95 % CI 0·36, 0·84), total fat (OR = 0·60, 95 % CI 0·41, 0·89) and monounsaturated fat (OR = 0·56, 95 % CI 0·36, 0·87) intake was also inversely and significantly associated with malnutrition risk (model 2, Table 3). After further adjustment for total energy intake, the magnitude of most associations remained similar but lost statistical significance.
In what concerns micronutrients, a higher intake of vitamin B6, folates, and Ca among community-dwellers was significantly associated with lower odds of risk of malnutrition/malnutrition, after adjusting for socio-demographic variables, loneliness feelings and self-reported health (model 2, Table 4). Additionally, vitamin C intake in NH residents and Na, K and Mg intake in both settings were also significantly associated with malnutrition risk. However, in the energy adjusted model only Na (OR = 0·46, 95 % CI 0·24, 0·88) and Mg (OR = 0·30, 95 % CI 0·11, 0·80) intake in community-dwellers remained significantly associated with malnutrition risk.
Association of micronutrients intake (divided by the standard deviation) with nutritional status (MNA), weighted for socio-demographic characteristics of NH residents
(Odds ratios and 95 % confidence intervals)
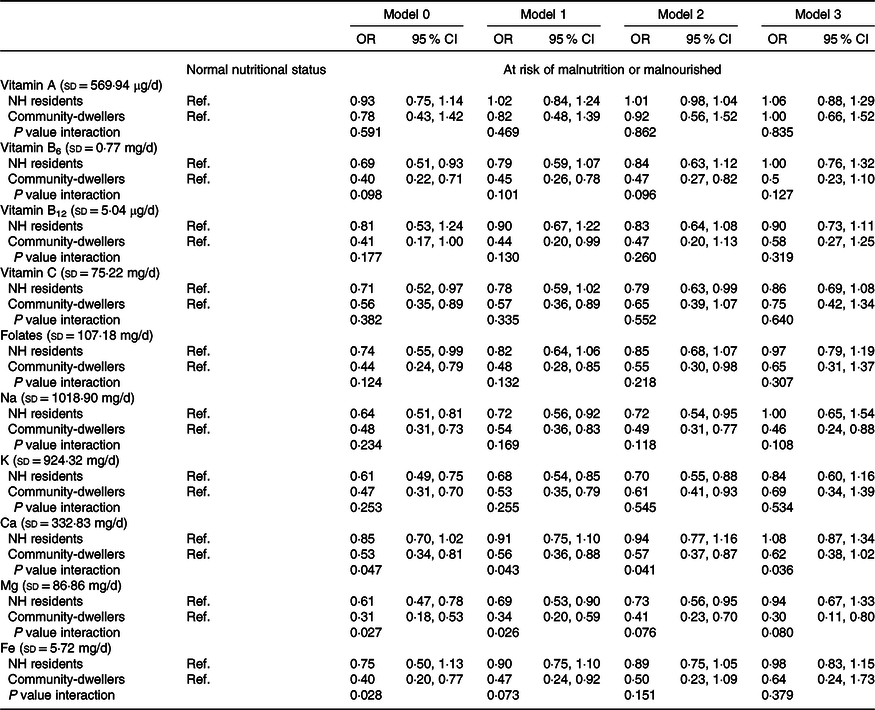
MNA, Mini Nutritional Assessment; NH, nursing home; Ref., reference category.
Model 0: Crude.
Model 1: Adjusted for sex, age, and education.
Model 2: Adjusted for variables in model 1 plus loneliness feelings and self-reported health.
Model 3: Adjusted for variables in model 2 plus total energy intake.
In the crude model, a significant interaction effect of the living setting was observed for the associations between Ca (P value interaction = 0·047), Mg (P interaction = 0·027), Fe intake (P value interaction = 0·028) and nutritional status. After adjustment (model 2), the effect was statistically significant only for Ca (P value interaction = 0·041).
Inadequate nutrients intake
The prevalence of inadequate intake was generally higher (lower for Na and saturated fat) among those at risk of malnutrition or malnourished, but its magnitude varied greatly between nutrients, sex and living setting (Tables 5 and 6). Conversely, the proportion of NH residents reporting a protein intake below the recommendations was slightly higher in the ‘normal nutritional status’ group. Also, for carbohydrates, the percentage of community-dwellers below 45 % of TEI was considerably higher in the ‘normal status’ v. ‘malnutrition risk’ group (29·5 % v. 9·4 %).
Prevalence of inadequate macronutrients intake by sex and nutritional status (MNA), weighted for socio-demographic characteristics of NH residents
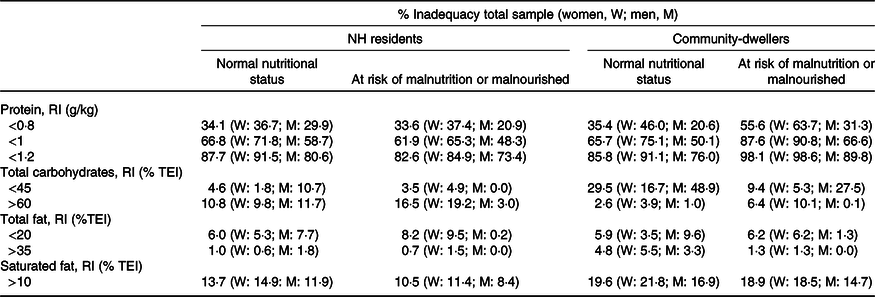
W, women; M, men; NH, nursing home; RI, reference intake; %TEI, % of total energy intake.
Prevalence of inadequate micronutrients intake by sex and nutritional status (MNA), weighted for socio-demographic characteristics of NH residents
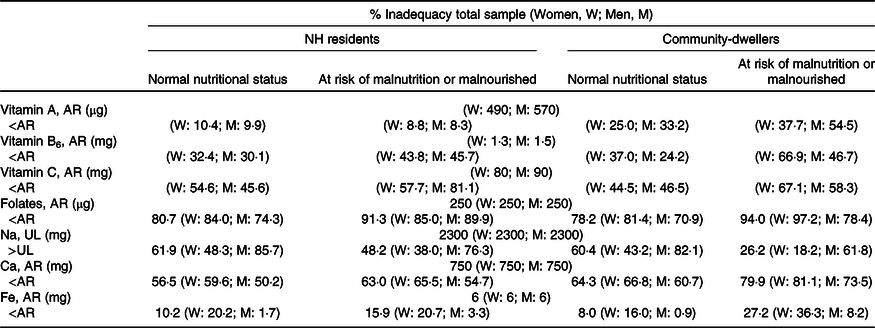
W, women; M, men; NH, nursing home; AR, average requirement; UL, tolerable upper intake level.
Altogether, about one-third of the studied population had a protein intake <0·8 g/kg, and around two-thirds below 1·0 g/kg. These proportions raised to 55·6 and 87·6 % (respectively) in community-dwellers at malnutrition risk. Moreover, in the community setting, almost 20 % had a saturated fat intake above the recommended level (10 % of TEI). Regarding micronutrients, inadequacy was especially high for folates, Na (in men) and also for Ca in the community setting.
The prevalence of inadequacy of macro and micronutrients was similar in both settings, except for carbohydrates, protein and vitamin A. Among those presenting a normal nutritional status, the prevalence of carbohydrates intake below 45 % TEI was higher in community-dwellers (29·5 % v. 4·6 %). Considering those ‘at risk of malnutrition or malnourished’ the proportion of individuals above 60 % TEI of carbohydrates was higher among NH residents (16·5 % v. 6·4 %), while protein inadequacy was higher in community-dwellers.
Additional analyses were conducted for fibre, vitamin B12, K and Mg, for which the available Dietary Reference Value is an AI. Findings for these nutrients were inconclusive, because in every case the mean value was below the AI.
Discussion
Summary of findings
This study examined the association between energy/nutrients intake and malnutrition, and characterised intake inadequacy by nutritional status in a nationally representative sample of older adults living in NH or in the community. In line with other studies(Reference Cereda, Pedrolli and Klersy2,Reference Vetrano, Collamati and Magnavita36,Reference Gordon, Franklin and Bradshaw37) , and as expected, there were proportionally more women in the NH setting, participants were generally older, received less formal education and had a lower income than their community-dwelling counterparts. Consistently, NH residents reported limitations to perform instrumental activities of daily living and loneliness feelings more frequently, as well as poorer health and worse nutritional status. Considering the aforementioned differences, the weighting procedure used here allowed for having more comparable groups from the two living settings when studying their dietary intake and nutritional status.
In the present study, a higher energy intake decreased the odds of risk of malnutrition or malnutrition in both settings, but the association was no longer significant among community-dwellers after adjusting for sex, age and education. Moreover, in the adjusted models, higher intakes of carbohydrates, polyunsaturated fat, fibre, vitamin C (in NH residents), protein, vitamin B6, folates, Ca (in the community), total and monounsaturated fat, Na, K and Mg (in both settings) were significantly associated with lower odds of malnutrition risk. After further adjustment for energy intake, similar magnitudes of most of these associations were observed, but only Na and Mg intake in the community setting remained significantly associated with malnutrition risk.
The prevalence of inadequate nutrient intake was generally higher among those at risk of malnutrition or malnourished compared with those presenting a normal nutritional status (except for carbohydrates and protein), with greater differences between these categories in the community setting. Inadequacy was especially high for folates, Na (in men) and Ca (in the community). Furthermore, inadequacy prevalence was similar in the two living settings, except for carbohydrates (<45 % TEI), protein and vitamin A for which it was higher in the community.
Interpretation of findings
Globally, the present findings support the expected inverse relationship between dietary intake and malnutrition among institutionalised and non-institutionalised older adults. In the NH setting, total energy intake seems to be particularly important to nutritional status. The role of total energy intake in the aetiology of malnutrition is clearly established(Reference John, Bullock and Brenner7,Reference Cederholm, Bosaeus and Barazzoni38) , and even the influence of the other (macro)nutrients seems to be via energy. Among community-dwellers (living in their own home or at relatives’), protein intake and some micronutrients appear to have a more significant impact on malnutrition. The intake of vitamin A, B12 and Fe was not associated with malnutrition risk even in the crude models. There is no specific explanation for these findings, especially for B12 and Fe, as they are mainly present in foods that are high in protein, a key nutrient in ageing-related malnutrition(Reference Volkert, Beck and Cederholm35).
In this study, after weighting for age, sex and education, a significant interaction effect of the living setting was not observed in the adjusted models (except for Ca), supporting a similar relation between dietary intake and nutritional status in both settings. Nevertheless, there are some factors that influence food intake, such as personal (e.g. chewing abilities, emotional state), food-related (e.g. food availability) and environmental (e.g. meal ambiance, support) characteristics, that most probably diverge between the two settings and should be noted when interpreting these results(Reference Nieuwenhuizen, Weenen and Rigby6,Reference Bartali, Salvini and Turrini39,Reference van der Meij, Wijnhoven and Lee40) . For example, the availability of several meals every day that are planned, prepared and assisted by trained NH staff probably influences the dietary intake of NH residents. However, even though nutritious food may be offered in NH, which can be protective, a poorer health, psychological and functional status may limit the ability to eat. Especially in this context, total energy intake seems to be a good indicator of nutritional status, with carbohydrate-rich foods that are easier to eat having a greater contribution to energy intake. In the community, where most persons still live independently, choosing and preparing their food, protein, B6, folates, Ca and Mg intake do distinguish those at malnutrition risk from those that have a good nutritional status.
In the present study, the prevalence of inadequate nutrient intake was generally higher for the ‘at risk of malnutrition/malnutrition’ group, as expected. However, this was not the case for total carbohydrates intake, which may be related to the fact that many carbohydrates food sources are easier to accept, access, prepare and eat by more vulnerable older adults with worse nutritional status. Greater differences in the prevalence of inadequacy between ‘normal nutritional status’ and ‘malnutrition risk’ were found in the community setting, probably because in NH food intake is more homogeneous. Moreover, this study found an unexpected higher prevalence of inadequate protein intake among NH residents (but not within community-dwellers) with a ‘normal nutritional status’ compared with those in the ‘at risk of malnutrition/malnutrition’ group. In the regression models, one can observe that NH residents’ protein intake was no longer associated with malnutrition risk when models were adjusted for health status and loneliness, suggesting that other factors may be playing a greater role in terms of nutritional status. One hypothesis is that MNA does not distinguish subjects according to protein adequacy, at least in some settings like NH, where total energy intake seems to have higher impact than individual nutrients.
In terms of protein intake, the proportion of older adults that did not meet European Food Safety Authority recommendations for persons aged ≥ 18 (0·8 g/kg body weight) was relatively high, but it more than doubled when considering the European Society for Clinical Nutrition and Metabolism recommendations that are specific for older adults (minimum 1 g/kg for healthy individuals), and the picture got even worse when looking at those at risk of malnutrition or malnourished. There is accumulated evidence that protein requirements increase with age, considering that 0·8 g/kg is probably not enough to preserve muscle mass and functional status in advanced age(Reference Coelho-Júnior, Milano-Teixeira and Rodrigues41,Reference McGrath, Stastny and Casperson42) . The observation that protein inadequacy was even higher in the community setting may be related to the food choices of independently living older adults, in terms of their preferences, abilities (to buy, cook, eat) and literacy(Reference Visser, Hung and Verbeke43), compared with the food that is made available for the NH residents.
Comparison with existing literature
As already mentioned, literature on this topic is scarce, and mainly based on bivariate, non-adjusted statistical analyses. One survey conducted among Turkish NH residents (n 554) found that energy, nutrients intake and diet quality were higher for older people who had a normal nutritional status compared with those at risk or malnourished, similarly to what was found here(Reference Ongan and Rakıcıoğlu9). Additionally, a study combining data from five Finnish nutritional studies (n 900) showed that energy and most nutrients intake were significantly higher in the normal nutritional status group(Reference Jyväkorpi, Pitkälä and Puranen8). In contrast, carbohydrates, sugars and Ca intake was higher in the malnourished group from Finland. Studies describing the nutrients intake of older adults by setting are also very rare. Similarly to what was observed here, a small study conducted in Lebanon (n 200) reported a non-significant difference in energy intake between settings, but a higher %TEI from protein in the community compared with NH(Reference Sibai, Zard and Adra44).
In terms of macronutrients inadequacy, high rates of inadequate protein intake have also been identified by other authors, even in the ‘normal nutritional status’ group(Reference Jyväkorpi, Pitkälä and Puranen8,Reference Rodríguez-Rejón, Ruiz-López and Artacho45) , although they vary greatly between studies and countries, as demonstrated by a recent meta-analysis(Reference Hengeveld, Boer and Gaudreau46). The high prevalence of Na inadequacy, especially in men, is consistent to what has been observed in the general European population(Reference Powles, Fahimi and Micha47) and in the general Portuguese population(Reference Lopes, Torres and Oliveira15). High Na intake is associated with cardiovascular events and mortality(Reference Mente, O’Donnell and Rangarajan48). Older adults should also be a target of public health policies to reduce salt consumption, with a special focus on maintaining foods’ palatability to avoid a decrease in food intake in vulnerable subgroups. The public health concern about folate insufficiency in advanced age is also supported by the present study. Folate, which is mainly present in legumes, green leafy vegetables and some fruits, plays a key role in the breakdown of homocysteine, a substance that has been implicated in the pathophysiology of several diseases, such as stroke, dementia and cancer(Reference Martí-Carvajal, Solà and Lathyris49–Reference Hu, Juan and Sahyoun51). Also, the high inadequate Ca intake (in the community) has been often reported(Reference Ter Borg, Verlaan and Hemsworth52,Reference Beasley, Rillamas-Sun and Tinker53) and may be related to a low consumption of dairy products. Sufficient Ca intake is needed for preserving bone health, but it also has a role in other diseases, such as colorectal cancer(Reference Weaver, Gordon and Janz54,Reference Larsson, Bergkvist and Rutegård55) . Although the micronutrients of highest concern are not the same even in neighbour countries(Reference Aparicio-Ugarriza, Luzardo-Socorro and Palacios56), vitamin A, B6, folates and Ca intakes are frequently the most problematic in studies including older community-dwelling and/or NH residents(Reference Jyväkorpi, Pitkälä and Puranen8,Reference Ter Borg, Verlaan and Hemsworth52,Reference Beasley, Rillamas-Sun and Tinker53,Reference Aparicio-Ugarriza, Luzardo-Socorro and Palacios56,Reference Volkert, Kreuel and Heseker57) .
Limitations and strengths
This study has some potential limitations that should be considered. First, its cross-sectional design implies that no conclusions can be drawn about the temporal order of the associations. Second, data were self-reported (except for anthropometric measures), thus depending on participants’ memory and willingness to respond with accuracy. In order to minimise the inclusion of unreliable data, older adults that were severely physical or mentally impaired and those whose cognitive function was compromised were excluded from the present study. Additionally, face-to-face interviews through standard procedures applied by trained nutritionists and using European harmonised methodology for dietary assessment support the quality of data. Even though dietary misreporting (under and over reporting) may always be present, it appears to be less critical in older adults, and severe outliers were removed from the present analyses(Reference Ferrari, Slimani and Ciampi58). A more uniform food offer in NH may also influence residents’ diet and its associations with malnutrition. However, residents can choose between and beyond the food offered at the NH, emphasising the need to study individuals’ actual intake as performed in this study.
Inadequacy estimations may also come with some flaws, because groups with different intake distributions were compared, and some groups might be too small (e.g. malnourished in the community). In the specific case of protein, Dietary Reference Value is expressed as grams per body weight, and here actual weight was used. Some studies recommend using adjusted body weight, because in overweight persons the weight in excess is mainly fat mass, resulting in an overestimation of protein requirements(Reference Hengeveld, Boer and Gaudreau46,Reference Berner, Becker and Wise59) . However, the choice and definition of the ‘healthy’ weight to adjust the protein needs may also be problematic and introduce some error.
The representativeness of the sample could also be an issue to discuss. Compared with those that were excluded from the present study, there was a higher proportion of men among participants, they were younger, received more formal education and had better cognitive function and nutritional status. In addition, the participation rate in the community setting was low (23 %), though in line with other dietary surveys including older adults. Non-participants from the community setting were slightly more illiterate and less obese (BMI ≥ 30 kg/m2), but reported similar consumption of fruits and vegetables and the presence of diseases requiring regular healthcare(Reference Lopes, Torres and Oliveira17). Altogether, the present samples probably represent a somehow healthier group. Therefore, one can hypothesise that the prevalence of malnutrition may be underestimated. Moreover, considering that most community-dwellers that participated were able to attend two interviews at the primary care unit, it is possible that this sample is healthier than the general population, which may amplify the real differences between NH residents and community-dwellers. However, the use of the aforementioned propensity score minimised the possible bias in the comparisons between settings.
This study is innovative in characterising the association between energy/nutrients intake and nutritional status, as well as the prevalence of nutrient inadequacy by nutritional status in NH residents and community-dwellers aged 65 or over (no upper age limit). Moreover, it included nationally representative samples of both settings that were weighted to be comparable.
Conclusions
In NH, but not in the community, energy intake is inversely associated with malnutrition (assessed by MNA) even when socio-demographic, health and psychosocial factors are taken into account. In general, nutritional intake is also inversely associated with malnutrition in both institutionalised and non-institutionalised older adults after adjusting for those factors, but not when total energy is additionally considered. Globally, the associations are similar in the two settings, although nutritional status seems to be more influenced by carbohydrates intake in NH and by protein intake in the community. The present findings also support that inadequate intake is generally more frequent in those that are at risk of malnutrition or malnourished. Still, inadequacy is frequent even in persons with a normal nutritional status, being especially high for protein.
This study supports the potential for setting-specific nutritional interventions and guidelines in optimising dietary intake and, consequently, older adults’ nutritional status. Nevertheless, nutritional interventions and policies should not focus on food alone but also consider health-related and psychosocial factors that are certainly influencing intake and nutritional status.
Acknowledgements
The authors acknowledge the PEN-3S research team, the IAN-AF team, the interviewers who collected the data, the staff from nursing homes and primary healthcare units, and all study participants.
The project PEN-3S (136SI5) was granted by the Public Health Initiatives Programme (PT06), financed by EEA Grants Financial Mechanism 2009–2014. T. M. is supported by a PhD Scholarship (SFRH/BD/117884/2016) from Fundação para a Ciência e a Tecnologia (FCT) through national funds (MCTES). The funding sources had no involvement in the conduct of the research nor in the preparation of the article.
T. M., M. S., D. C., C. L. and J. G. C. contributed to the study design. T. M. and C. L. coordinated the data collection. M. S. and D. C. advised on the statistical analyses. T. M. wrote the first draft of this manuscript. All authors critically revised the manuscript and approved its final version.
The authors declare that they have no conflict of interest.


