


1. Introduction
Human hand abilities for manipulating carried objects and tools in unstructured environments are of great interest to scientists and engineers. The real-time dexterity and perception required to control objects and tools blindly make it even more challenging and beyond imagination. Despite the current level of advancement in the creation of dexterous grippers and human-like fingers by robotics manipulators, grasped objects and tools still require more stable and precise grasping. Improvements in tactile sensing and perception allow us to address such challenges with advanced feedback control strategies, enabling adjustments to grip force. However, one of the main difficulties that crucially hinders the development of superior tactile sensing is detecting an object’s slip early. In the literature, numerous engineered tactile sensors have been proposed to approximate human abilities in tactile sensing and slip perception [Reference Kappassov, Corrales and Perdereau1–Reference Yousef, Boukallel and Althoefer3].
The slip phenomenon in robotics occurs when external forces acting on an object (e.g., weight and dynamics) exceed the frictional gripping force at the contact point, causing relative displacement between the gripper and the object. This slip phenomenon, causes relative displacements, is a critical area of interest within the fields of robotics, grasping, instrumentation, and measurement. Such fields focus on detecting, measuring, monitoring, and controlling slips. These relative displacements are necessary conditions for slips and can be detected and quantified through direct and indirect measurement techniques.
Figure 1 presents a categorization of the popular relative-displacement-based techniques reported in the literature. Direct displacement measurements include displacement, velocity, and acceleration, while indirect measurements focus on detecting mechanical or electrical changes. Mechanical changes involve variations in temperature due to friction, force or torque, pressure, and acoustic waves at the contact surfaces. On the other hand, electrical changes encompass variations in capacitance, impedance, magnetic field, and optical properties induced by the contact surfaces [Reference Li, Kroemer, Su, Veiga, Kaboli and Ritter2–Reference Ohka and Sagawa8].
Current slip detection popular methods.

Some robotic manipulator gripper designs are equipped with optical tactile sensors (OTS) to sense the conditions of the objects being grasped. OTS technologies utilize variations in light properties to detect object displacements, including reflection, refraction, diffraction, interference, dispersion, and polarization. Generally, OTSs utilize optical receptors to detect variations in specific light properties emitted from a light source or transmitter toward a tactile medium. These optical receptors can be single modules or arranged in arrays, similar to those found in cameras. Depending on applications and requirements, vision-based OTS engineering designs employ frame and event cameras. On the other hand, well established engineered-shaped tactile medium materials are used to interact directly with the object during grasping. These tactile materials are designed to harness the light properties of optical receptors, such as markers, patterns, flexible membranes, and guided waves [Reference Xiong, Huang, Yin, Zhang and Song6, Reference Zhang, Chen, Guo, Wang, Sun, Xu, Sun, Yang and Fang9–Reference Li, Liu and Yao11].
Many novel and popular neuromorphic vision-based tactile sensors have been developed and extensively studied for their attractive capabilities in fast perception, slip detection, and object manipulation. Such sensors include, but are not limited to, GelSight [Reference Yuan, Dong and Adelson12], TacTip [Reference Chorley, Melhuish, Pipe and Rossiter13], NeuroTac [Reference Ward-Cherrier, Pestell and Lepora14], Tactigraph [Reference Sajwani, Ayyad, Alkendi, Halwani, Abdulrahman, Abusafieh and Zweiri15], Kumagai sensor [Reference Shimonomura16], FingerVision [Reference Yamaguchi and Atkeson17], and Evetac [Reference Funk, Eberhardt, Chalvatzaki, Calandra and Peters10].
Currently, many vision-based tactile sensors are limited to detecting incipient slip without quantifying the amount of slip displacement or the slip rate for grasped objects. Real-time active grasping force control requires slip displacement estimation or the degree of slip as feedback signals to adjust the pressing force on the object. In the literature, three popular strategies are used to estimate the degree of object slips in tactile sensors: the stick/slip region-based method, the friction estimation-based method, and the micro-element resultant (MER) force-based incipient slip degree evaluation method [Reference Sui, Zhang, Huang, Li and Jiang18]. These strategies are based on contact mechanics approaches [Reference Johnson19] and depend heavily on the object's material type and properties.
Vision-based robotic tactile sensors operate in data-based, model-based, or hybrid modes. In model-based tactile sensors, tactile sensors use mathematically generated models (i.e., using physical and engineering principles) to map or interpret sensor input readings (e.g., from a camera or force sensors) into information about the object in contact, such as press and slip, force distribution, shape, or texture. In contrast, data-driven methods rely on extensive multi-scenario training datasets. In particular, model-based tactile sensors with event cameras provide a mathematical framework for reconstructing contact features by mapping image intensities or deformation data to contact-related phenomena, such as object slip. Both approaches can be used in Artificial Intelligence (AI), but the model-based approach appears to have advantages over the data-based approach. Flexibility, higher accuracy, reduced reliance on extensive training data, and compatibility with controller design are among the significant benefits offered by the model-based approach [Reference Müller, Nguyen and Veit20].
This work presents a novel model-based approach to vision-based robotic tactile sensors. A newly developed in-house, novel neuromorphic event-based tactile sensor demonstrates how a model-based approach can provide fast, rich output and AI-enabled data. The sensor’s ability to estimate slip displacement and the degree of pressing force on grasped objects gives it an advantage over many other neuromorphic event-based tactile sensors. Furthermore, understanding the sensor’s mathematical model facilitates comprehension of its operations and limitations, particularly during a robotic manipulator’s grasping for an action event. Furthermore, this model will provide a framework for implementing predictive and adaptive control-based models to improve the forecasting of robotic grasping strategies.
Finally, the proposed model-based approach is verified experimentally using an in-house-developed neuromorphic tactile sensor setup on an industrial robotic manipulator to demonstrate its ability to detect and quantify the objects translational slips and the degree of pressing force at an early stage. Such a slip-displacement estimate, which is needed as a feedback signal for most controllers, is computed as the weighted centroid of the sensor’s marker strip region of interest (ROI). Although many researchers used the marker’s centroid feature for translational and rotational slip detections, it was estimated only within a force field [Reference Zhang, Chen, Guo, Wang, Sun, Xu, Sun, Yang and Fang9, Reference Hameed, Rajkumar, Dongming, Yahya and Lakmal21, Reference Dong, Danielczuk and Rodriguez22]. In contrast, the proposed tactile sensor does not rely on a force field generated by the markers; instead, it uses variations in the markers' strip aperture areas. During pressing or slip actions, the strip deformation results in variations in the aperture area (i.e., the trackable feature) and enables centroid variations that are easily mapped to slip-rate estimates, in contrast to full n-dimensional field computations.
The novelty of the used sensor lies in its bioinspired, flexible-skin design, featuring protruding markers that mimic the ridges of human fingerprints, which are associated with heightened tactile sensitivity in humans. Unlike conventional tactile sensors, which commonly use flat or internally embedded markers, our sensor’s protruding markers enable detection of low contact forces and incipient slip. Furthermore, these markers are integrated with an event-based neuromorphic vision sensor that captures their deformations. Unlike frame-based cameras, this enables high temporal resolution and low-latency detection of tactile events such as pressing and slipping. Finally, the sensor’s flexible skin is fabricated using readily accessible, low-cost 3D-printing technology (TPU: Ninjaflex). This fabrication method reduces complexity and cost while enabling rapid customization and prototyping.
This paper’s layout begins with an overview of slip theory. Then, it introduces the novel, in-house-designed neuromorphic vision-based tactile sensor with its event camera. A mathematical model of the sensor is derived and verified experimentally using a robotic manipulator. Finally, experimental results, discussions, and conclusions are presented.
2. What is slip?
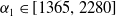
Classical mechanics models slip using Coulomb’s principle, which states that frictional forces are proportional to normal forces. To illustrate the slip/slide phenomenon from the physical point of view, consider a body slipping or sliding over another body surface in the presence of friction, which is depicted in Figure 2. It should be clear that even for rigid bodies, the contact area is deformable on the microscopic level with consequential effects for the teeth in the contact area to experience adhesion, breaking-off points, pull-away effects, and interlocking effects with vibration. On the other hand, additional effects, such as stiction, may occur for deformable objects. Nevertheless, slipping and sliding displacement occurs when the applied force exceeds the tangential static frictional force.
Two bodies’ magnified surface.

When a constant applied force $P$
generates enough work to displace an object and overcome the resultant tangential frictional force F
t
, it accelerates the body until it reaches a constant velocity
$P$
generates enough work to displace an object and overcome the resultant tangential frictional force F
t
, it accelerates the body until it reaches a constant velocity $v$
, (i.e., dynamical equilibrium occurs at
$v$
, (i.e., dynamical equilibrium occurs at $t_{1}$
). Taking the energy balance between two time instances
$t_{1}$
). Taking the energy balance between two time instances $t_{1}$
and
$t_{1}$
and $t_{2}$
, where
$t_{2}$
, where $t_{2}\gt t_{1} $
gives
$t_{2}\gt t_{1} $
gives $W_{\textit{force}}-W_{\textit{friction}}={\unicode[Arial]{x0394}} KE$
, which may be used to model all these effects as shown by the following equation:
$W_{\textit{force}}-W_{\textit{friction}}={\unicode[Arial]{x0394}} KE$
, which may be used to model all these effects as shown by the following equation:
 \begin{equation}\frac{1}{2}mv_{1}^{2}+PS-F_{t}S'=\frac{1}{2}mv_{2}^{2}\end{equation}
where $F_{t}=\mu _{k}N$
is the frictional tangential force,
$F_{t}=\mu _{k}N$
is the frictional tangential force, $\mu _{k}$
is the kinetic friction coefficient,
$\mu _{k}$
is the kinetic friction coefficient, $N$
is the normal force,
$N$
is the normal force, $P$
is the constant external applied force,
$P$
is the constant external applied force, $v_{1}=v_{2}=v$
for a constant speed,
$v_{1}=v_{2}=v$
for a constant speed, $S$
is the planned theoretical object displacement, while
$S$
is the planned theoretical object displacement, while $S'$
is the actual or tangible displacement of an object.
$S'$
is the actual or tangible displacement of an object.
Finally, according to Coulomb’s principle, the tangential frictional forces remain constant during the object’s displacement. But depending on the object’s surface finish quality, some of the object’s Kinetic energy is transformed into other forms of internal energy, $\mu _{k}N(S-S')$
, such as thermal, vibration, and acoustic. Consequently, these internal energy effects enabled researchers and engineers to use indirect measurement techniques for object slips in robotics applications [Reference Inman23–Reference Marín, Alhama and Moreno25]. One popular modeling technique of these frictional effects is to use an internal equivalent damping effect that is proportional to the slip change rate (i.e.,
$\mu _{k}N(S-S')$
, such as thermal, vibration, and acoustic. Consequently, these internal energy effects enabled researchers and engineers to use indirect measurement techniques for object slips in robotics applications [Reference Inman23–Reference Marín, Alhama and Moreno25]. One popular modeling technique of these frictional effects is to use an internal equivalent damping effect that is proportional to the slip change rate (i.e., $v(t)$
), that is
$v(t)$
), that is $ F_{t}(t)=CdS'/dt$
, where C is an equivalent damping coefficient. However, this work considers only the actual, tangible (i.e., directly measurable) displacement as a measure of slip quantification.
$ F_{t}(t)=CdS'/dt$
, where C is an equivalent damping coefficient. However, this work considers only the actual, tangible (i.e., directly measurable) displacement as a measure of slip quantification.
In the literature, some researchers model incipient slips by monitoring changes in the object-gripper contact area [Reference Romeo and Zollo5]; however, this approach does not provide useful information on displacement slips or slip rates. In contrast, the energy-based modeling of slip, as shown in Eq. (1), is favored.
3. Neuromorphic model-based tactile sensors
Neuromorphic vision-based tactile sensors offer spatial, temporal, and AI-enabled advantages for a diverse range of robotic grasping applications. Subsequent subsections present an overview of these sensor types, and an in-house-designed neuromorphic vision-based tactile sensor is introduced to illustrate a novel model-based approach that reduces reliance on massive training data. Unlike data-driven methods, model-based approaches can be effective without requiring extensive training datasets and offer the potential for high accuracy and flexibility. Physical models can accurately represent deformation and force distribution and could be adapted to different sensor types and applications. Finally, the model-based approach offers better control compatibility by enabling model-based controller design, which is far superior to modeless controller design approaches [Reference Hameed, Rajkumar, Dongming, Yahya and Lakmal21].
3.1. Neuromorphic dynamic vision sensors
Recently developed neuromorphic event-based dynamic vision sensors (DVS) use event cameras with patented technology that mimics the human retinal response. First, light is reflected from surrounding objects and enters through the cornea (i.e., the aperture), pupil, and lens, ultimately hitting the retina. The photoreceptor cells in the retina respond to light, converting its energy into an electrical signal. Furthermore, this signal travels through the human optic nerve to the brain, where it is finally converted to portray the images of objects [Reference Levin, Kaufman and Hartnett26, Reference del Río and Betancourt27].
Neuromorphic DVS integration of the recently developed cameras enables them to capture detailed visual information about objects’ spatial properties, dynamics, and environmental interactions. Both frame and event cameras are used in designing state-of-the-art neuromorphic DVS for robotic grasping applications [Reference Shimonomura28, Reference Atkeson and Yamaguchi29].
Neuromorphic event-based cameras generate asynchronous events triggered by significant changes in brightness intensity at individual pixels. This on-demand operation offers advantages in the design of robotics tactile sensors over frame-based cameras, such as high temporal resolution, low energy consumption, fast response, and a broad dynamic range [Reference Gallego, Delbrück, Orchard, Bartolozzi, Taba, Censi, Leutenegger, Davison, Conradt, Daniilidis and Scaramuzza30].
3.2. A novel-designed neuromorphic dynamic vision sensor
Figure 3 illustrates our in-house, bio-inspired, neuromorphic vision-based sensor that uses event-based vision technology to rapidly detect tactile interactions. This novel neuromorphic sensor is designed to emulate the high tactile sensitivity of human fingerprint ridges, featuring protruding markers that detect the slightest touch or minimal contact. These markers, alongside the sensor’s backbone skin, are printed using Ninjaflex material. The sensor’s entire assembly is encased in a PLA-based 3D-printed housing, and internally, a DVXplorer Mini neuromorphic event camera is secured to capture real-time, dynamic deformations of the sensor’s markers and strips under various contact scenarios. The sensor’s actual dimensions are 40 × 50 × 40 mm. The complete design and fabrication of this sensor are described in ref. [Reference Gallego, Delbrück, Orchard, Bartolozzi, Taba, Censi, Leutenegger, Davison, Conradt, Daniilidis and Scaramuzza30].
Novel neuromorphic dynamic vision sensor.

This sensor is designed to detect early slips in robotic grasping applications. Embedding this sensor within a robotic manipulator’s end-effector will measure data on pressing and slipping with rigid and moderately soft objects. During initial grasping, the sensor’s markers will be partially axially pushed, causing changes in brightness through the aperture holes and giving data about the pressing operation. If the grasped object starts to slip, causing relative displacement, the sensors’ marker strips will bend proportionally, altering the aperture area and brightness (i.e., marker strips). The red arrow in Figure 3 illustrates the optical path for the tactile sensor, starting from the external light source, being reflected through the aperture area of the marker strips, and ending at the event camera as a change in intensity.
Figure 4 illustrates the generated light diffractions through the aperture and the detection by the DVXplorer Mini event camera [Reference Faris, Awad, Awad, Zweiri and Khalaf31]. The used event camera reports time-stamped relative logarithmic changes in the light intensity on the pixel level in the form of occurring events $\{+1, -1\}$
based on predefined ON/OFF thresholds. Positive indicates an increase, while negative suggests a decrease in logarithmic intensity, and no changes in logarithmic intensity will be reported.
$\{+1, -1\}$
based on predefined ON/OFF thresholds. Positive indicates an increase, while negative suggests a decrease in logarithmic intensity, and no changes in logarithmic intensity will be reported.
 \begin{equation}\textit{Event}=sgn\left(log \!\left(\frac{I(x,y,t+{\unicode[Arial]{x0394}} t)}{I(x,y,t)}\right)\right)\end{equation}
where $\textit{Event}\in \{+1, -1\}$
are the reported events of a pixel that is located at
$\textit{Event}\in \{+1, -1\}$
are the reported events of a pixel that is located at $(x,y)$
,
$(x,y)$
, $I(x,y)$
is the pixel’s intensity states, which occurred at a time
$I(x,y)$
is the pixel’s intensity states, which occurred at a time $t$
and at the time
$t$
and at the time $t+{\unicode[Arial]{x0394}} t$
, respectively.
$t+{\unicode[Arial]{x0394}} t$
, respectively.
Event camera change in intensity.

Event cameras do not send their captured high-definition images at a fixed frame rate, unlike conventional frame-based cameras. Instead, only events that occur when movement or change happens in the scene are produced, significantly reducing power consumption, data rate, and computational requirements. Even ultrafast cameras are designed for demanding applications in robotics, motion analysis, aerospace, AR/VR, and autonomous vehicles [32].
A DVS-generated event is documented using the address event representation (AER) format: E = [x, y, t, p], which records the pixel address (x, y), the time at which the address was reported, t, and the polarity of the brightness change (i.e., increase or decrease).
For the proposed model-based approach, we must establish a mathematical relationship between the event camera parameters and the sensor used in this work. In optometry, the viewable area that the camera lens can capture is referred to as the field of view (FOV), while the strength of the lens’s focus (i.e., convergence) or the divergence of light is referred to as the focal length (f). The FOV determines the portion of the object that is cast onto the camera’s sensor. This enables correlating the object’s physical area, which can be imaged and modeled as a horizontal or vertical FOV in millimeters, or as an angular FOV specified in degrees. Referring to Figure 5 and using mathematical geometry, the following equation relates the sensor’s marker strips aperture area to the camera sensor array’s vertical size [32]:
 \begin{equation}H=\frac{f}{\delta }FOV\end{equation}
 \begin{equation}A_{p}=l_{2}^{\,2}\theta\end{equation}
where H is the camera sensor vertical size, f is the used camera focal length, and 3.6 mm lens, $\delta$
is the strip object setup distance that is the distance from the strip object to the camera after calibration, FOV is the strip object’s FOV,
$\delta$
is the strip object setup distance that is the distance from the strip object to the camera after calibration, FOV is the strip object’s FOV, $A_{p}$
is the marker strip opening area,
$A_{p}$
is the marker strip opening area, $l_{2}$
is the sensor dome radius, and
$l_{2}$
is the sensor dome radius, and $\theta$
is the marker strip angular displacement. Figure 5 illustrates the overall light optical path, the event camera parameters, and the relationship between FOV, sensor size H, and
$\theta$
is the marker strip angular displacement. Figure 5 illustrates the overall light optical path, the event camera parameters, and the relationship between FOV, sensor size H, and $\delta$
for a given angular FOV (AFOV).
$\delta$
for a given angular FOV (AFOV).
Object and captured image correlation.

3.3. The proposed neuromorphic DVS sensor modeling
The sensor’s markers and strips are made of Ninjaflex, a material that is rubber-like in it's flexibility and damping. To simplify the model without compromising accuracy, the strips will be modeled using spring and damper elements, as shown in Figure 6. The markers pressing action will be physically modeled using linear stiffness and damping, represented by K1 and B1, respectively. In contrast, the fixed-end marker strips will undergo rotational motion during the slip action, which will be physically modeled using linear and rotational stiffness and damping coefficients, K2 and B2, respectively. Finally, the inertial effects of the markers and strips will be neglected due to their small masses and low slipping rates.
Tactile sensor markers strip sensor physical modeling.

In robotic applications, objects are first secured in a stable grip but may suffer undesired slips due to dynamic effects during motion, which can propagate to a complete object slip. The initial gripping action will push the sensor’s markers axially, causing a small angular displacement $\theta _{0}$
of the markers’ strips. However, a slip will cause the markers to bend and cause further angular displacement of the markers’ strips that is proportional to the object’s slipping displacement.
$\theta _{0}$
of the markers’ strips. However, a slip will cause the markers to bend and cause further angular displacement of the markers’ strips that is proportional to the object’s slipping displacement.
As mentioned earlier, the mathematical modeling of the sensor’s actions, pressing and slipping, will be treated in two steps. Referring to Figures 6 and 7, first consider a robotic action that requires an external force $P $
, which may be decomposed into two force components
$P $
, which may be decomposed into two force components $P_{1}\ \text{and}\ P_{2}$
. Consequently, the dynamical equilibrium is given by
$P_{1}\ \text{and}\ P_{2}$
. Consequently, the dynamical equilibrium is given by
Single-marker detailed model.

 \begin{equation}\sum F_{i}(t)=m_{s}\ddot{x}(t)=0\end{equation}
 \begin{equation}P_{1}(t)=B_{1}\dot{x}(t)+K_{1}x(t)\end{equation}
Now, for the slipping action, the analysis from the pressing initial position is performed, and the following equations model the object’s slip.
 \begin{equation}\sum T_{j}(t)=J_{s}\ddot{\theta }(t)=0\end{equation}
 \begin{equation}T(t)=B_{2}\ \dot{\theta }(t)+K_{2}\ \theta (t)\end{equation}
For a rectangular beam in torsion, the maximum stress occurs at the center of the fixed ends of the beam, and the angle of twist of the beam is given as [32]:
 \begin{equation}\theta (t)=\frac{2T\!(t)w_{2}}{\beta bt_{2}^{3}G}=\alpha T(t)\end{equation}
where $\beta$
is a constant that depends on
$\beta$
is a constant that depends on $b/t_{2}$
ratio, b, and t
2 are the marker’s strip width, respectively; G is the material rigidity; T(t) is an induced torque: T(t) =
$b/t_{2}$
ratio, b, and t
2 are the marker’s strip width, respectively; G is the material rigidity; T(t) is an induced torque: T(t) = $P_{2}(l_{1}+l_{2}+l_{3})$
, and
$P_{2}(l_{1}+l_{2}+l_{3})$
, and $ \alpha =\frac{2w_{2}}{\beta bt^{3}G}$
is a constant.
$ \alpha =\frac{2w_{2}}{\beta bt^{3}G}$
is a constant.
The adopted physical model mathematically demonstrates that the marker’s strip angle behaves as a first-order system (FOS) with the applied force and the time constant $\tau$
. Consequently, the corresponding transfer functions for the press and slip actions are given as follows:
$\tau$
. Consequently, the corresponding transfer functions for the press and slip actions are given as follows:
 \begin{equation}\text{Press}\colon X(S)=\frac{1}{B_{1}S+K_{1}}F(S)=\frac{\alpha _{1}}{S+1/\tau _{1}}F(S)\end{equation}
 \begin{equation}\text{Slips}\colon \theta (S)=\frac{\frac{1}{t_{1}}}{B_{2}S+K_{2}}F(S)=\frac{\alpha _{2}}{S+1/\tau _{2}}F(S)\end{equation}
The sensor’s markers undergo two types of force-generated displacements: axial and bending of the marker strips. Figure 7 illustrates the displacements of bending marker strips (i.e., those on the light optical path) modeled as cantilevered beams. Using basic beam theory, the beam’s bending profile (i.e., elastica curve) may be correlated to the aperture area, A.
The length of the deflected part of the beam $l_{b}$
varies depending on the degree of pressing axial force
$l_{b}$
varies depending on the degree of pressing axial force $P_{1}$
on the grasped object. On the other hand, the lateral force
$P_{1}$
on the grasped object. On the other hand, the lateral force $P_{2}$
causes the marker to bend, and the maximum deflection
$P_{2}$
causes the marker to bend, and the maximum deflection $y_{max}$
is given from the cantilevered beam theory as
$y_{max}$
is given from the cantilevered beam theory as
 \begin{align}y_{max}=\frac{P_{2}l_{b}^{\,3}}{3EI}=\frac{P_{2}\left(l-x_{c}\right)^{3}}{3EI} \\[-25pt] \nonumber \end{align}
 \begin{align}\quad P_{1}=K_{1}x_{c} \\[2pt] \nonumber \end{align}
where $x_{c}$
is the beam end point ‘C’ displacement,
$x_{c}$
is the beam end point ‘C’ displacement, $l_{b}$
is the beam’s cantilevered length, l is the beam’s total length, E is the material modulus of elasticity of the marker, and I is the moment of inertia for the marker’s rectangular cross-section. Consequently, the marker object slipping force
$l_{b}$
is the beam’s cantilevered length, l is the beam’s total length, E is the material modulus of elasticity of the marker, and I is the moment of inertia for the marker’s rectangular cross-section. Consequently, the marker object slipping force $P_{2}$
will cause the marker strip to bend and vary the aperture area in front of the event camera.
$P_{2}$
will cause the marker strip to bend and vary the aperture area in front of the event camera.
 \begin{equation}{\unicode[Arial]{x0394}} A_{p}=l_{2}^{\,2} {\unicode[Arial]{x0394}} \theta =\frac{l_{2}^{\,2}}{l_{b}} y_{max}\end{equation}
 \begin{equation}{\unicode[Arial]{x0394}} A_{s}=w_{s}{\unicode[Arial]{x0394}} H=w_{s}\frac{\hspace{1pt}f\hspace{1pt}}{\delta } {\unicode[Arial]{x0394}} FOV=w_{s}\frac{2f}{\delta } {\unicode[Arial]{x0394}} y_{max}\end{equation}
where ${\unicode[Arial]{x0394}} A_{p}$
is the marker strip, a small change in the aperture area,
${\unicode[Arial]{x0394}} A_{p}$
is the marker strip, a small change in the aperture area, $\Delta H$
is the corresponding affected vertical pixel array in the camera sensor, and
$\Delta H$
is the corresponding affected vertical pixel array in the camera sensor, and $w_{s}$
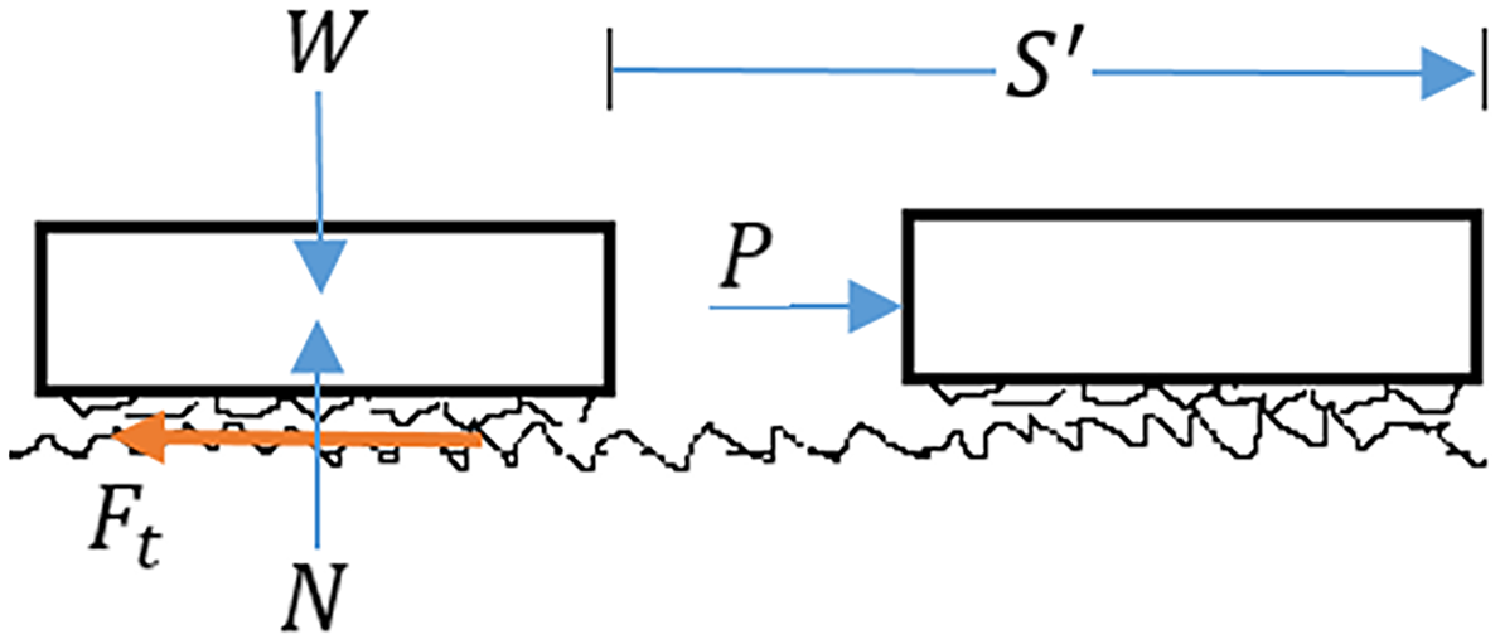
is the fixed sensor marker strip aperture window width. The pixel array has a resolution of 640 × 480 and measures 640 pixels × 9 μm/pixel = 5.76 mm wide and 480 pixels × 9 μm/pixel = 4.32 mm high. Figure 8 illustrates the integration of all previous equations in block diagram form, where an input pressing force results in a change in aperture area on the sensor, which is recorded by the event camera.
$w_{s}$
is the fixed sensor marker strip aperture window width. The pixel array has a resolution of 640 × 480 and measures 640 pixels × 9 μm/pixel = 5.76 mm wide and 480 pixels × 9 μm/pixel = 4.32 mm high. Figure 8 illustrates the integration of all previous equations in block diagram form, where an input pressing force results in a change in aperture area on the sensor, which is recorded by the event camera.
Sensor block diagram equations summary.

4. Experimental work
4.1. Experiment description
The following laboratory experiment demonstrates the operation and testing of a novel model-based neuromorphic dynamic vision sensor. Figure 9 illustrates the integration of the sensor with an end-effector on a UR10 Robotic Manipulator. The robot’s end-effector and sensor will press against a dummy target plate to simulate a gripped object. The selected target plate is rigid, flat, and has a smooth surface finish, fabricated from PLA material using 3D printing techniques. The robot’s end-effector will move at a constant speed to simulate a wide range of tactile interactions with its slips. The interaction starts by moving the robot from a start home position and placing the sensor at an arbitrary reference position close to the target plate (i.e., approaching). Then, the robot manipulator is instructed to perform the pressing by advancing the robot manipulator’s prespecified displacement amounts. Finally, the robot will move vertically, mimicking a slip for a predefined displacement, then release the press and return to the home position. Performing all experiments from a home position with constant robot speed and selecting prespecified displacements guarantees repeatability of the pressing force experiments, which is given as $P=B\frac{dx}{dt}+K{\unicode[Arial]{x0394}} x$
, function of speed and displacement.
$P=B\frac{dx}{dt}+K{\unicode[Arial]{x0394}} x$
, function of speed and displacement.
Experimental tactile sensor setup.

The experiment design is engineered to provide different levels of applied pressing forces against the target plate. The selected force levels are labeled as light, small, small medium, medium, small, big, and big pressing levels. Four experimental trial groups were carried out, and each trial consisted of twelve different extents of applied pressing forces on the sensor markers.
Finally, the robot operating system establishes as accurate and synchronized experimental datasets as possible. It enabled the control of the UR10 robot to precisely execute robotic actions such as approaching, pressing, sliding, and releasing while simultaneously managing data acquisition from the DVXplorer event-based camera. This ensures seamless synchronization between the robot’s movements and sensor data, providing accurate and repeatable experimental conditions.
4.2. Experimental results modeling
Three sets of raw data generated by neuromorphic tactile sensors are captured and depicted at the top of Figure 10. The three curves represent three degrees of applied force: small, medium, and big. A 20 ms of accumulated raw events are used to identify four distinct regions corresponding to the robotic manipulator’s actions. The first region represents the robotic manipulator as it approaches the target plate. The second region represents a pressing action against the target object, while the third region shows the object slipping action. Finally, the last region represents the object’s release action. The bottom graph in Figure 10 illustrates the same data in a filtered form, where moving averages are used to filter and smooth the data, allowing the four action regions to be clearly identified.
Three datasets of event tactile sensor raw data visualization.

The regions of pressing and slipping behavior portrayed in Figure 10 clearly validate the first-order system (FOS) derived mathematically in Eqs. (10) and (11). Figure 11 depicts two grasping axial pressing force contact levels applied on the sensor, “low” and big” contacts. The left graph shows the low-contact pulse-pressing axial force response, which represents a typical FOS behavior for the pressing action. In contrast, due to the nonlinear behavior of the Ninja flex material, the right-hand graph’s “big” contact force response exhibits a higher level of nonlinear, unmodeled dynamics. Considering only the linear FOS behavior and using an exponential unit pulse input, the FOS curve fitting may be given as follows:
 \begin{equation}x(t)=\left\{\begin{array}{cc} \alpha _{1}(1-e^{-t/{\tau _{1}}}) & 0\leq t\lt T\\[5pt] \alpha _{1}(e^{-(t-T)/{\tau _{1}}}-e^{-t/{\tau _{1}}}) & t\geq T \end{array}\right\}\end{equation}
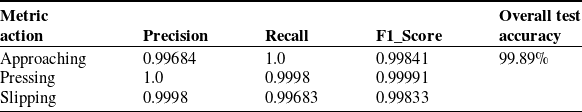
where $\alpha _{1}\in [1365, 2280]$
and
$\alpha _{1}\in [1365, 2280]$
and $\tau _{1}\approx 300 $
ms. The red curves in Figure 11 represent the fitted FOS linear model with a Pearson correlation coefficient of R = 0.983138, which was used as training data for the AI classifier.
$\tau _{1}\approx 300 $
ms. The red curves in Figure 11 represent the fitted FOS linear model with a Pearson correlation coefficient of R = 0.983138, which was used as training data for the AI classifier.
Unit step input force model fitting for the pressing FOS.

Figure 12 shows the slip action of the experimental and fitted models for a unit-ramp input. The FOS response may be captured using the following equation:
 \begin{equation}\theta (t)=\alpha _{2}\Big(\frac{1}{\tau _{2}}t-1+e^{-t/{\tau _{2}}}\Big)\end{equation}
where $\propto _{2}\approx 1615$
and
$\propto _{2}\approx 1615$
and $\tau _{2}\approx 325$
ms. The FOS model is fitted with a correlation coefficient of R = 0.999762.
$\tau _{2}\approx 325$
ms. The FOS model is fitted with a correlation coefficient of R = 0.999762.
Unit ramp input force model fitting for the slipping FOS.

4.3. Experimental results visualization
The sensor actions' experimental data may be visualized as an image. Spatially visual-mapped camera frames are constructed by mapping event coordinates onto a 2D grid corresponding to the sensor’s camera resolution of 480 by 640. The frames are segmented by dividing the event stream into frames based on an accumulation time delta. Furthermore, noise suppression and reduction in accumulated frames (i.e., salt-and-pepper noise) were achieved using a median filter.
Figure 13 shows the picture frame, which displays the sensor’s markers and strip displacement during a slip action. These highlighted rectangular areas are used as a ROI in subsequent analysis.
Slip frame picture visualization, deformed markers.

4.4. Experimental pressing raw results
The raw data events comprise positive and negative polarities; positive marks increase in event intensity, while negative marks represent a decrease in event intensity. Consider a medium-pressure force action, as shown in Figure 14, which exhibits this dual behavior. During the pressing action, two interrelated changes in intensity occur. The sensor markers block ambient light and lower their intensity as they are pressed. On the other hand, the pressing action opens the marker strips further, resulting in increased intensities in the camera’s vicinity. To decouple these interrelated effects, one can find the difference between these events, shown in the blue curve.
Pressing events polarity issues example.

Furthermore, quantifying the amount of pressing force (i.e., “light,” “small,” “small medium,” “medium,” “small big,” and “big”) is characterized by the increased number of sensor-reported events. One way to quantify the pressing amount is to use the area under the designated pressing region as portrayed in Figure 10. Consequently, Figure 15 depicts the strong correlation between the degree of pressing and the computed area in the selected region.
Pressing force qualitative extent.

5. Data analysis
The classification analysis stage starts after collecting, conditioning, and accumulating the sensor’s data. This work considers two types of sensor event data classifications: Temporal and spatial–temporal long short-term memory (LSTM) classifications. Figure 16 is a flowchart diagram summarizing the data analysis process used to classify the robotic manipulator and sensor actions, namely, approaching, pressing, and slipping.
Data analysis proposed process.

A recurrent neural network (RNN) is widely used in deep learning to classify events or actions qualitatively. It may be trained to recognize previously presented robotic manipulator actions depicted in Figure 10. Unfortunately, the nature of the experimentally collected data is spatial, temporal, and sequential, making it difficult for conventional RNN algorithms to process classifications over long-term dependencies. Another variation of RNN capable of processing long-term dependencies needed for sequential predictions is the LSTM network. LSTM incorporates feedback connections, enabling it to process entire data sequences rather than just individual data points. This makes it highly effective at understanding and predicting patterns in sequential data, such as time series. A complete description and review of the LSTM network operations may be viewed in reference to ref. [Reference Morrow and Kokernak33].
The neural network architecture comprised five layers: an input layer, a single LSTM layer with hidden units to capture temporal dependencies, a fully connected layer, a Softmax layer, and a classification layer. Despite the architecture’s simplicity, the LSTM layer effectively learned the sensor’s FOS patterns from tactile sequences, enabling accurate classification of the approaching, pressing, and sliding actions.
5.1. Temporal LSTM classification
Model-based LSTM classification can be utilized to leverage the previously identified FOS behavior. This work generated four experimental trials based on the derived model, which were used to train the LSTM neural networks. Each trial consisted of twelve applied pressing forces with different grasping force severities or extents. The experimentally identified FOS dynamical model is used to generate experimentally trained data for the spatial–temporal dynamical LSTM neural nets. The identified model is used to generate numerous FOS training trajectories for neural network training, using a diverse set of random robotic actions and their corresponding initial conditions.
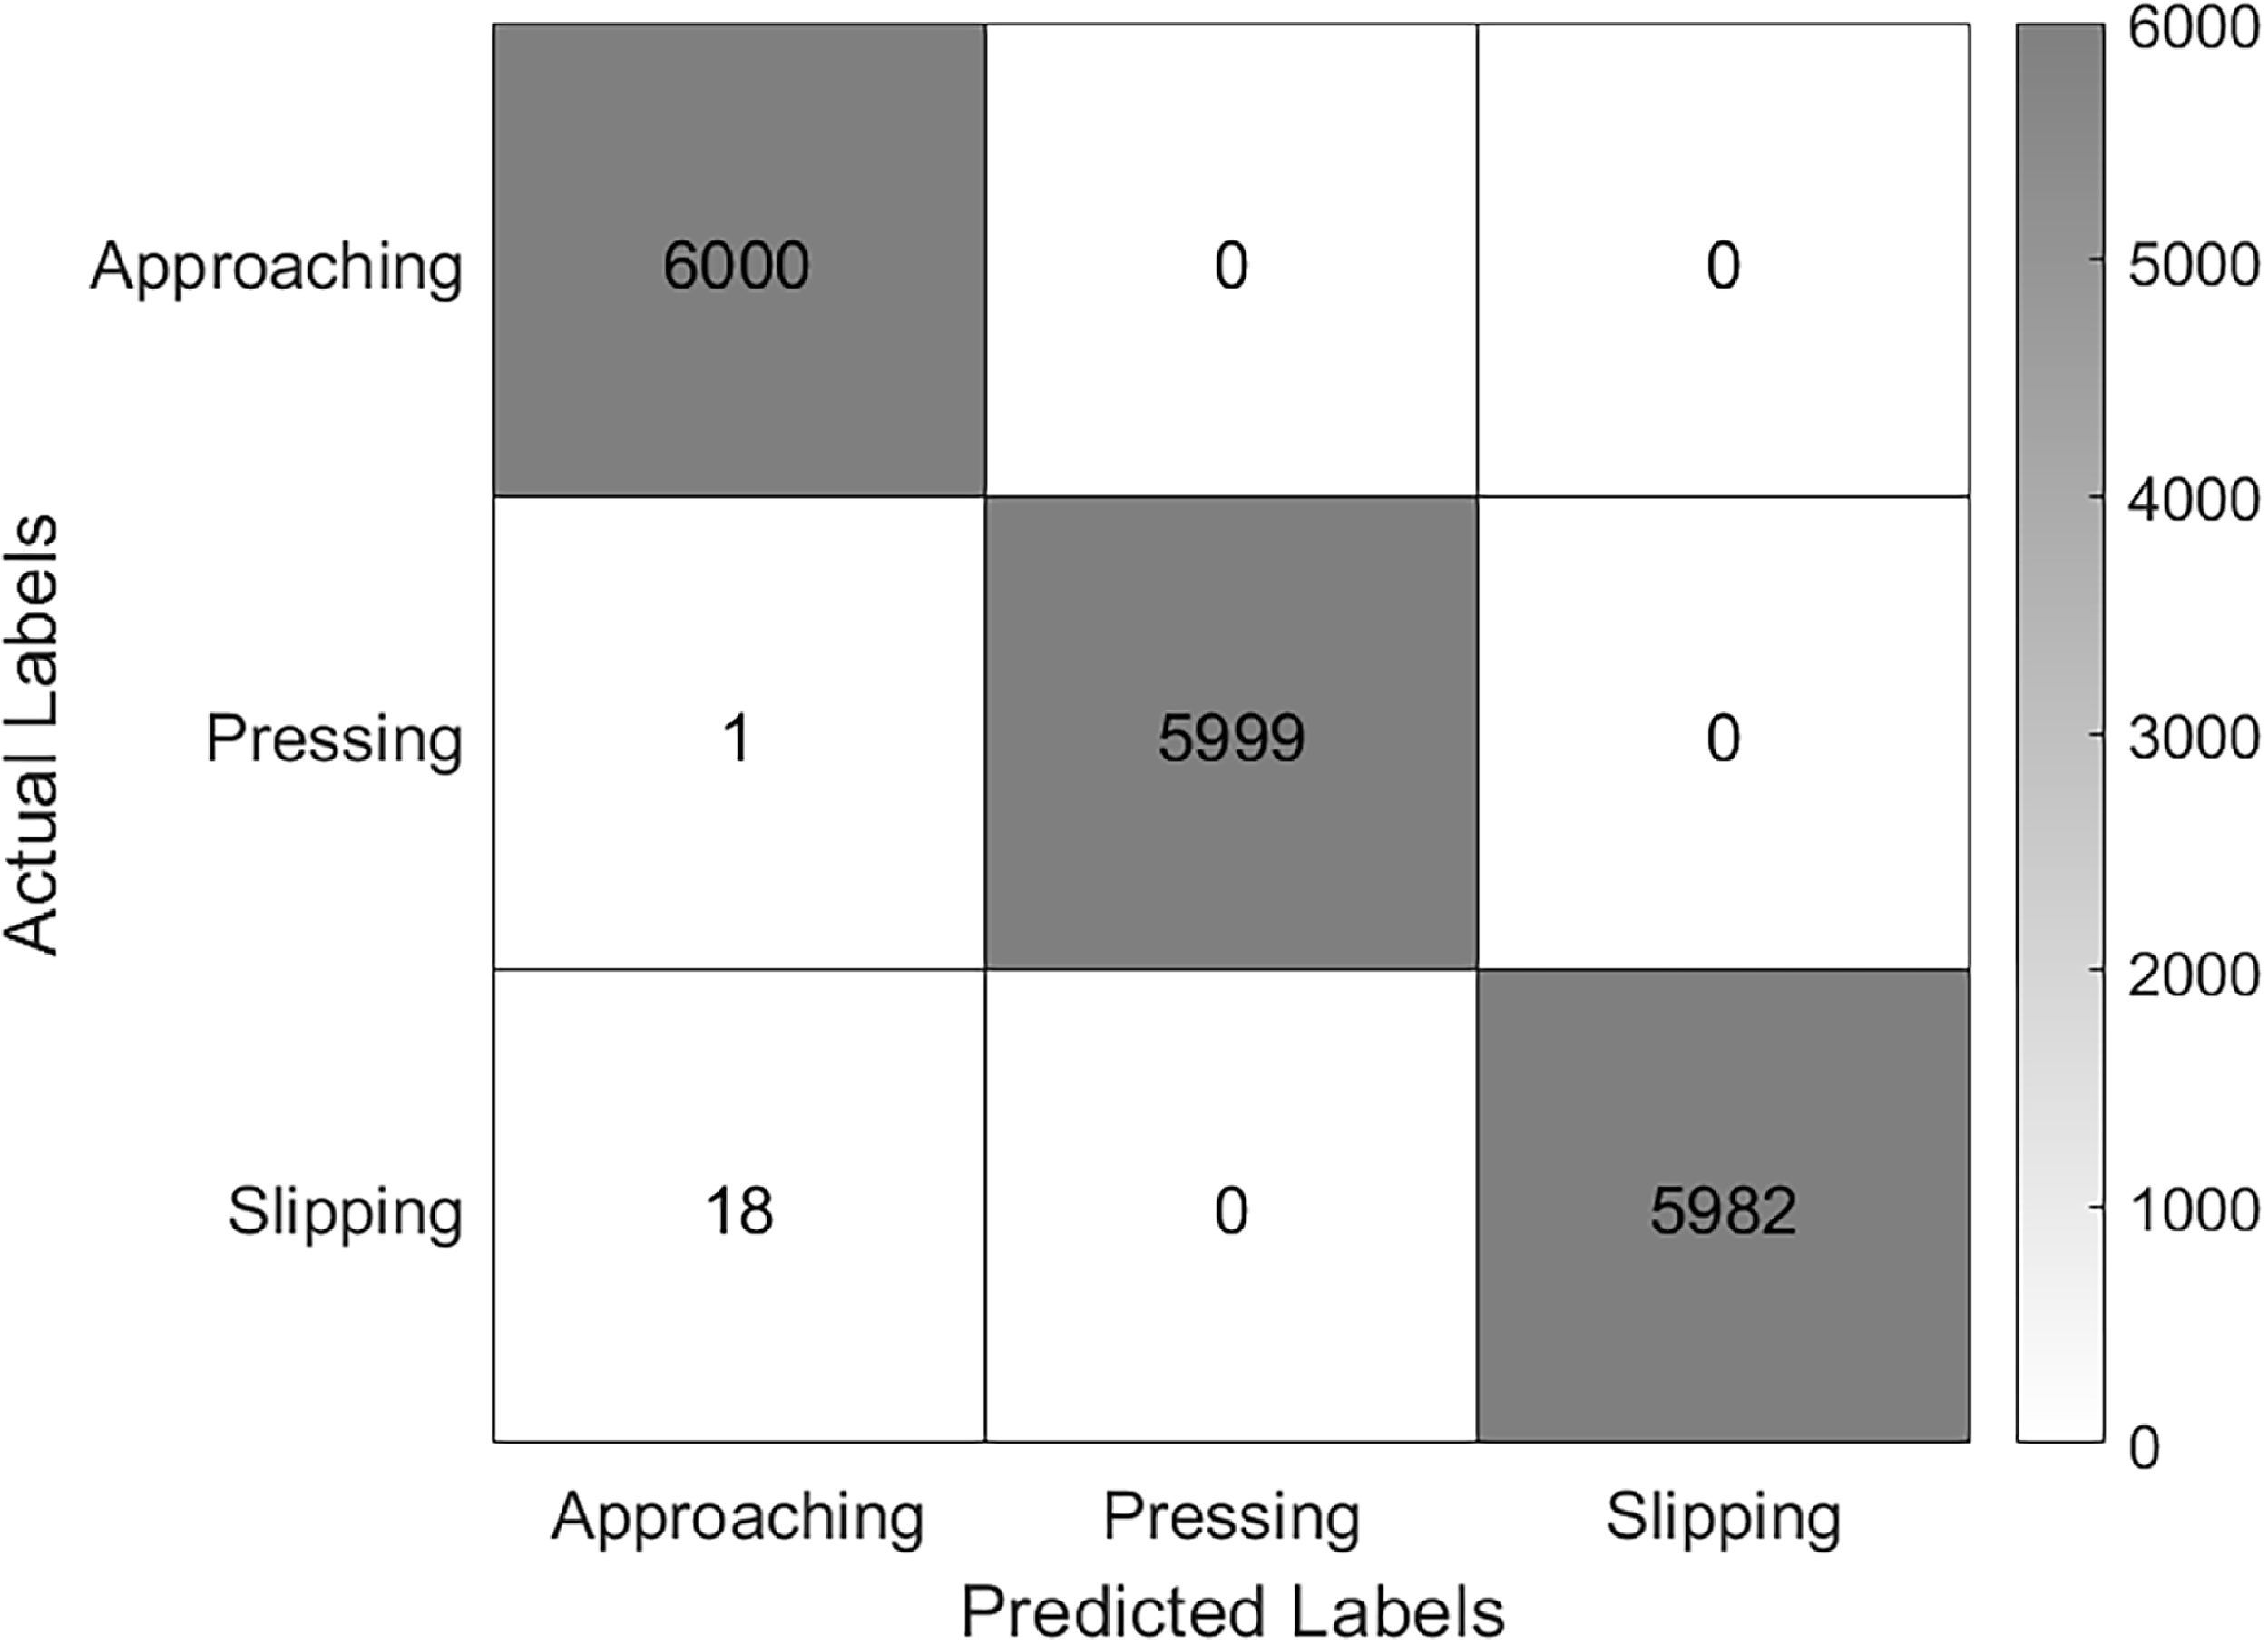
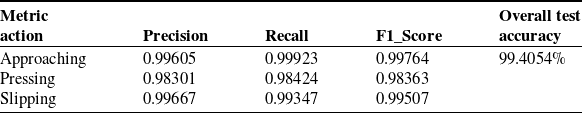
Referring to Figure 16, the data analysis process diagram, the first step is to qualitatively classify the robot’s action type using a temporal LSTM network. The second step estimates the extent of the pressing force qualitatively using a fuzzy logic (FL) classifier. The LSTM results are shown in Table I, and the corresponding confusion matrix is shown in Figure 17.
Temporal LSTM classifications results.

Temporal LSTM confusion matrix.

5.2. Spatial–temporal LSTM classification
A model-based LSTM classification approach using the weighted centroid feature is applied similarly to the temporal LSTM training, with four model-based experimental trials generated to train the spatial–temporal LSTM neural nets. Each experimental trial consisted of twelve applied pressing forces with different grasping force severities or extents.
Referring to the Figure 16 data analysis process diagram, the first step is to qualitatively classify the robot’s action type using the spatial–temporal LSTM based on the weighted centroid estimations of the ROI. The second step estimates the extent of the pressing force qualitatively using a FL classifier.
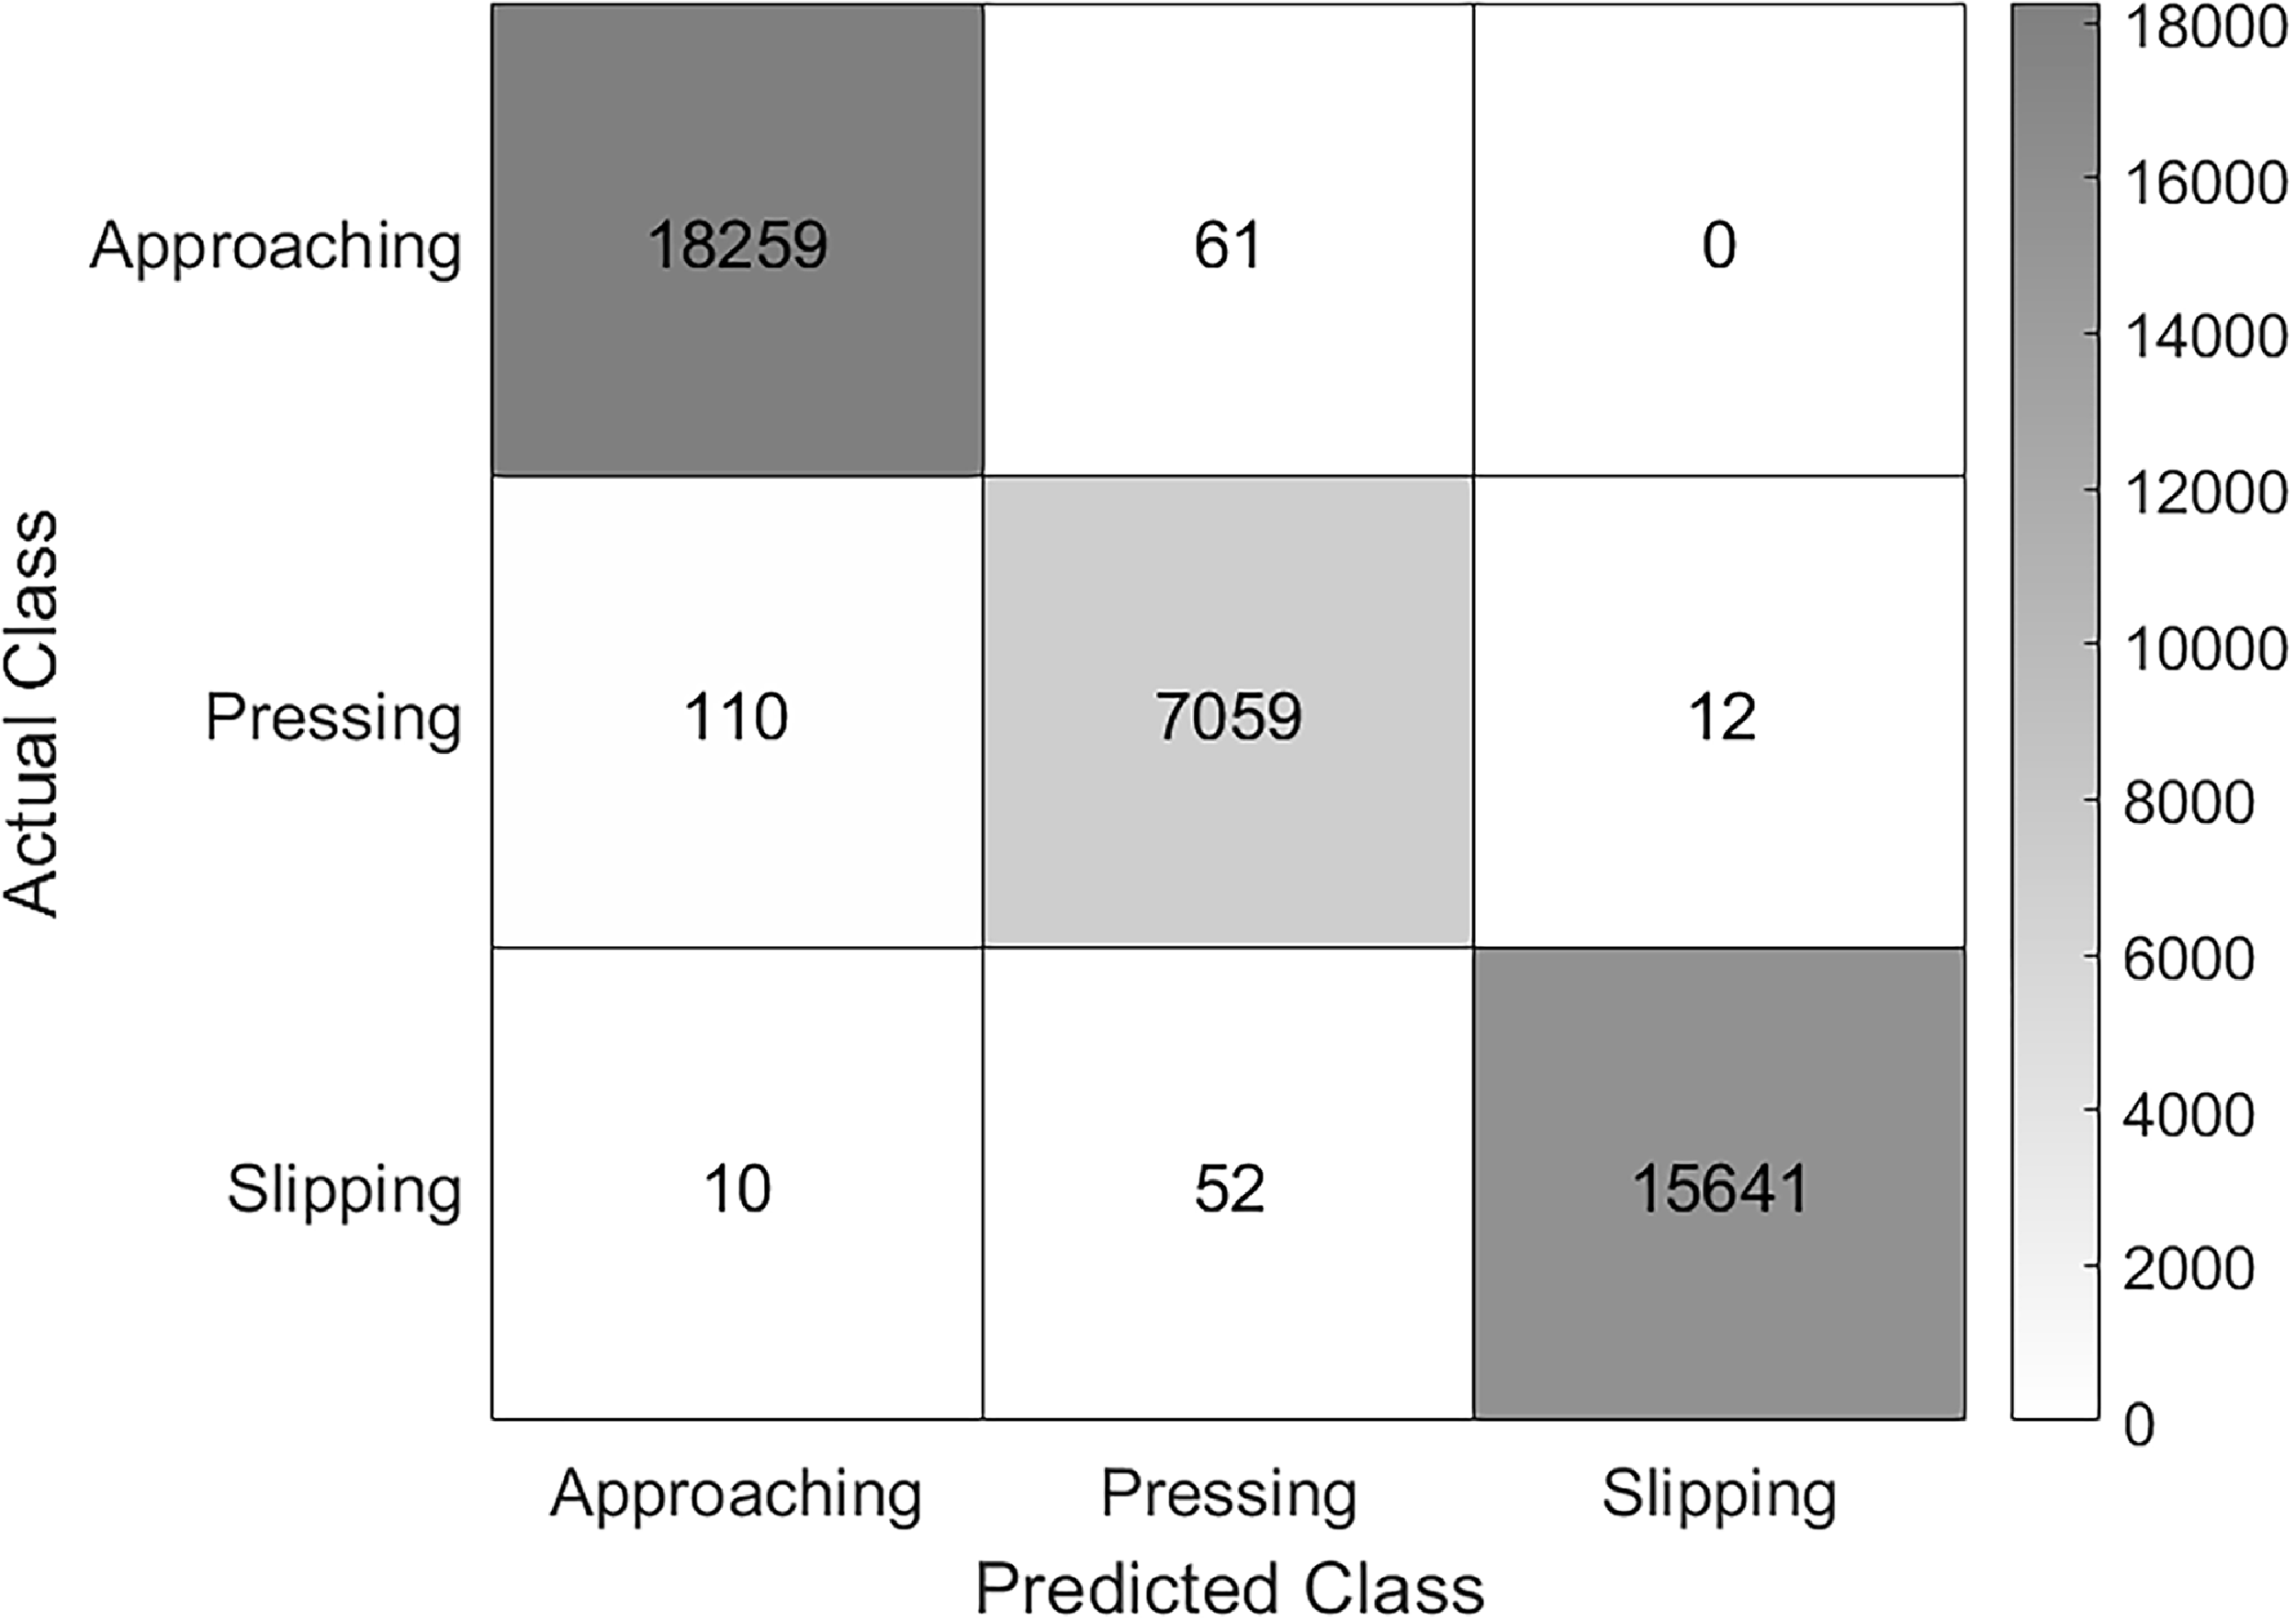
Finally, the weighted centroid dynamics is used to calculate the slip rate and compute the traveled displacement in $\Delta t$
time. The spatial–temporal LSTM classification results are shown in Table II, and the corresponding confusion matrix is shown in Figure 18.
$\Delta t$
time. The spatial–temporal LSTM classification results are shown in Table II, and the corresponding confusion matrix is shown in Figure 18.
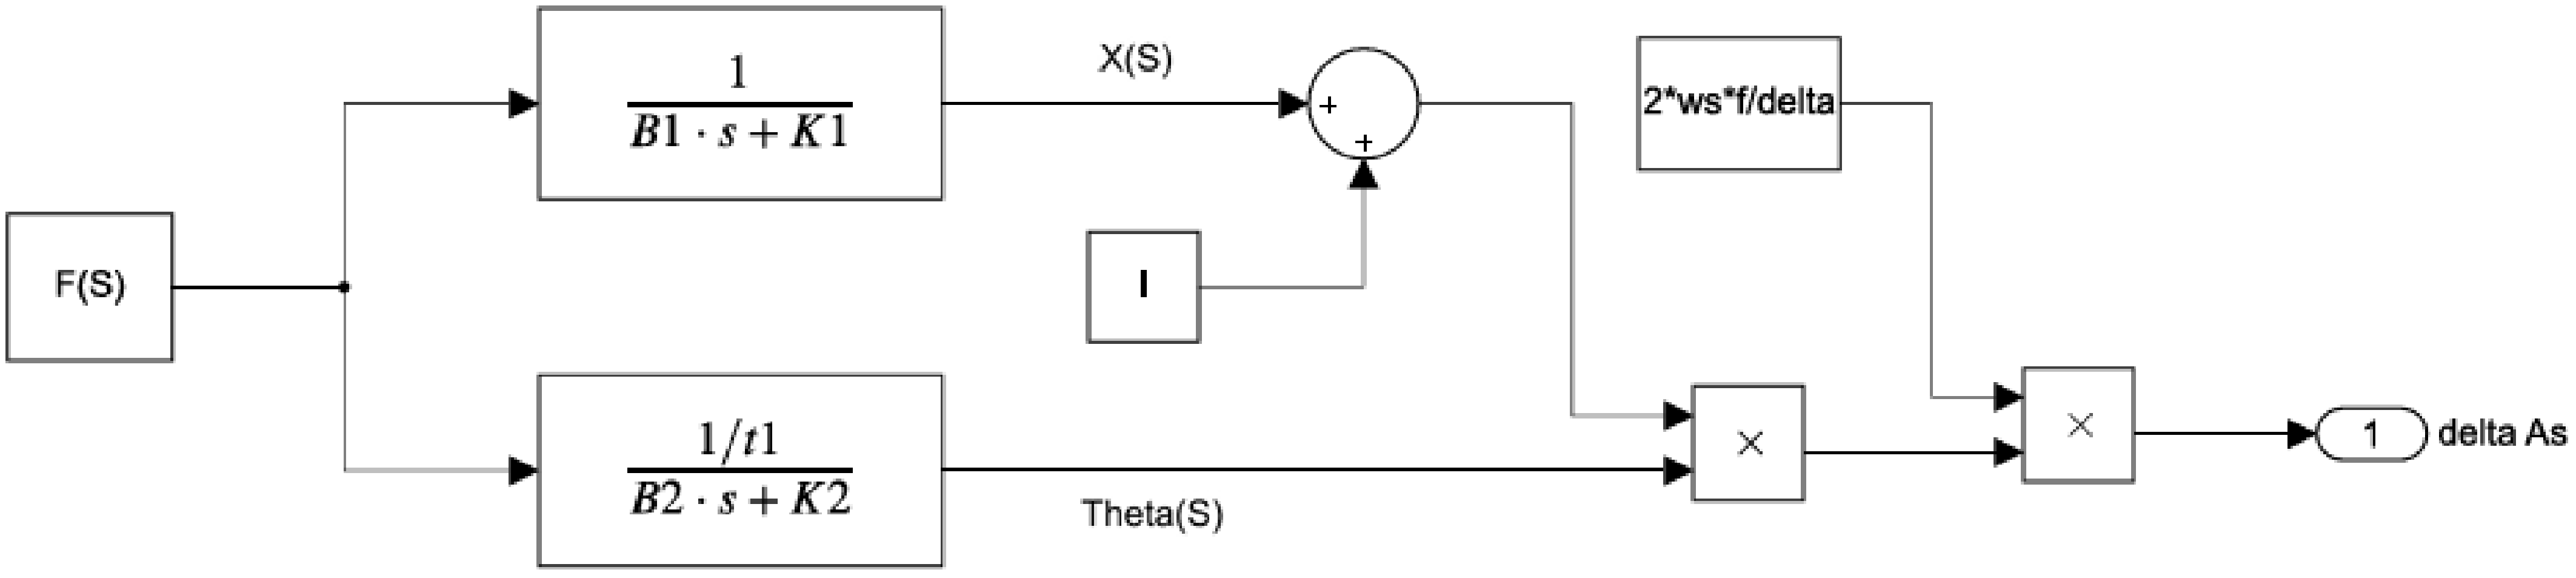
Spatial–temporal LSTM classifications results.

Spatial–temporal LSTM confusion matrix.

5.3. Fuzzy logic pressing force estimation
The estimation of the extent of the pressing force is achieved using a FL-based classifier. The proposed FL classifier comprises four key steps: fuzzification of all crisp inputs, a rule base for classification rules, inference for decision-making, and defuzzification for the outputs. Figure 19 illustrates the structure of the proposed FL classifier [Reference Houdt, Montero and Nápoles34].
Fuzzy logic pressing force estimation.

The fuzzification and defuzzification of the input and output linguistic variables and their corresponding interval ranges are captured using the fuzzy membership functions illustrated in Figures 20 and 21, respectively. The overlaps between the membership functions are embedded to account for boundary values and induce continuous, smoother transitions, allowing for multiple rules to fire [Reference Abdalla, Musa and Jafar35].
FL input fuzzification.

FL output fuzzification.

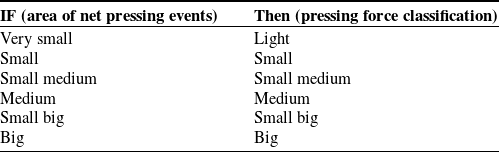
The pressing force classifier rule base is simple in structure yet effective. Table III summarizes the simple rules used in the classifier. Each rule is evaluated using the If–Then statement. To illustrate the operation of the FL classifier, Figure 22 is used for illustration. Considering a pressing force action classification, where two adjacent rules are fired simultaneously (i.e., due to input overlap), the corresponding output areas are aggregated to produce their centroid.
FL rule base.

FL rules firing and inference example.

Ultimately, a thorough analysis reveals that the weighted centroid feature effectively represents events and regional concentrations. The weighted centroid of the ROI correlates with the object’s slip action. Hence, by continuously evaluating the centroid feature over time, we can estimate the slip velocity profile, enabling us to calculate the slip displacement at any instant. Spatial–temporal tracking of the centroids over time is used to analyze movement patterns within each ROI.
 \begin{equation}RoI=\left\{\left(x_{i} ,y_{j}\right) \colon i, j\in \textit{corners}\ of\ RoI\right\}\end{equation}
Using the events intensities as weights, we shall use a weighted centroid to account for the varying intensities within the ROI.
 \begin{equation}\overline{x}=\frac{\sum x \ I(x,y)}{\sum I(x,y)} , \overline{y}=\frac{\sum y\ I(x,y)}{\sum I(x,y)}\end{equation}
where $I(x,y) $
is the intensity at the pixel
$I(x,y) $
is the intensity at the pixel $(x,y)\in RoI $
after performing data filtering.
$(x,y)\in RoI $
after performing data filtering.
Finally, the object’s slip displacement may be estimated from the centroid’s rate of change by implementing numerical integration. The integration acts as a low-pass filter, reducing the effects of high-frequency noise.
 \begin{equation}\vec {v}(t)=\frac{1}{{\unicode[Arial]{x0394}} t}\left(\overline{x}(t) \ \hat{\! i}+\overline{y}(t)\ \hat{\!j}\right)\end{equation}
 \begin{equation}\vec {d}(t)=\int _{t_{1}}^{t_{2}}\vec {v}(t)\, dt\end{equation}
The change in the centroid coordinates in the ROI $(\overline{x}, \overline{y})$
provides information about the object’s slipping trajectory at its contact point. In this work, only translational information is reported by the tactile sensor. Consequently, only the
$(\overline{x}, \overline{y})$
provides information about the object’s slipping trajectory at its contact point. In this work, only translational information is reported by the tactile sensor. Consequently, only the $\overline{y}\_ \textit{coord}$
is used to estimate the object’s slip displacement. Figure 23 illustrates the linear behavior of the
$\overline{y}\_ \textit{coord}$
is used to estimate the object’s slip displacement. Figure 23 illustrates the linear behavior of the $\overline{y}\_ \textit{coord}$
as the object is slipping for a medium grasping force extent, and the negative slope is from the orientation of the pixel grid (i.e., during the slip, the object falls while markers move up) as shown in Figure 13. The slope of the linear regression line should represent the speed of the slip, which reflects the robotic manipulator end-effector speed. The estimated average slope for the experimental trials is approximately 0.005 m/s, while the robotic manipulator end-effector speed is 0.004 m/s. This demonstrates the sensor’s ability to estimate the object’s slipping speed and displacement.
$\overline{y}\_ \textit{coord}$
as the object is slipping for a medium grasping force extent, and the negative slope is from the orientation of the pixel grid (i.e., during the slip, the object falls while markers move up) as shown in Figure 13. The slope of the linear regression line should represent the speed of the slip, which reflects the robotic manipulator end-effector speed. The estimated average slope for the experimental trials is approximately 0.005 m/s, while the robotic manipulator end-effector speed is 0.004 m/s. This demonstrates the sensor’s ability to estimate the object’s slipping speed and displacement.
Centroid vertical trajectory.

6. Conclusions
A novel model-based approach for neuromorphic event camera-based sensors is presented and discussed. The mathematical model of the neuromorphic sensor and its event camera are derived and successfully correlated, relating the amount of slip and pressing force to the event camera’s output aperture area. Experimental data from a robotic manipulator-based experiment were used to validate the derived mathematical model. The first-order dynamical behavior of the sensor was verified and validated over its operational dynamical range. However, nonlinear behavior is also observed during the sensor’s saturation range, which is primarily attributed to the design limitations of the markers and the use of highly flexible, nonlinear Ninjaflex material. Additionally, the experimental work verified that the proposed sensor could effectively report dynamical information about the three preassigned robotic manipulator actions: approaching, pressing, and slipping.
Temporal and spatial–temporal model-based analysis features were successfully used to train LSTM neural networks to classify the first three preassigned robotic actions: approaching, pressing, and slipping. Once an incipient slip is identified, and with the aid of the newly proposed weighted centroid feature reported by the camera events located in the sensor’s ROI, it is possible to estimate the object’s slip rate. Using the centroid changing rate, one can easily calculate the centroid displacement, which is a direct measure of the object’s slip displacement. This instantaneous slip estimation can be used as a feedback signal for various gripper controller types, enabling precise control commands to secure grip stability and maintain the object’s safety.
Finally, for both the LSTM temporal and the spatial–temporal model based, once the pressing action is identified, a FL-based classifier was successfully used to qualitatively categorize the pressing force extent as “very small,” “small,” “small medium,” “medium,” “small big,” and “big”. Estimating the dynamic information of this pressing force is essential for advanced robotic gripper control strategies.
Acknowledgments
The authors acknowledge and appreciate the assistance provided by the Advanced Research and Innovation Center team at Khalifa University, especially Hussain Sajwani, for his support in setting up the experimental platform.
Author contributions
Murana Awad carried out Conceptualization, Formal analysis, Software Coding/visualization, and Writing – original draft, Review/editing. Musa Abdalla performed Conceptualization, Formal analysis, Mathematical model derivation, Writing – original draft, and Review/editing. Mohammad I. Awad performed Project administration and review. Yahya Zweiri performed Technical advising and writing, including Review/editing. Kinda Khalaf, Project manager, Funding acquisition, and Writing – review/editing.
Financial support
This work was supported by Khalifa University of Science and Technology under Award No. CIRA-2021-106 and by the Advanced Research and Innovation Center (ARIC), jointly funded by Khalifa University of Science and Technology and STRATA Manufacturing PJSC (a Mubadala company).
Competing interests
The authors declare that they have no conflicts of interest.
Ethical approval
Not applicable.
Use of AI
None.


 Open access