

There is convincing evidence that higher intakes of the marine long-chain n-3 PUFA (LC n-3 PUFA) EPA and DHA, are beneficial to cardiovascular and cognitive health, acting through a number of biological mechanisms, and that the concentration of EPA and DHA present in blood and tissue lipids is correlated positively with these effects( Reference Calder 1 – Reference Calder 5 ). Oily fish are a good source of EPA and DHA; therefore, national and international authorities recommend regular consumption of oily fish such as salmon, mackerel, kippers, sardines, herring, trout and fresh tuna, in order to provide approximately 500 mg EPA+DHA per d( 6 ), with higher intakes of LC n-3 PUFA recommended for those with diagnosed CVD( Reference Kris-Etherton, Harris and Appel 7 ). However, the associations between intake and blood and tissue status, and therefore physiological benefits, are highly variable( Reference Browning, Walker and Mander 8 ), and the factors influencing this heterogeneity are not well understood. Greater knowledge of determinants of LC n-3 PUFA status could lead to the development of more robust, and perhaps subgroup specific, recommendations for EPA and DHA intake.
In addition to intake of the specific LC n-3 PUFA and their precursors, the heterogeneity in habitual EPA, DPA and DHA concentrations may be influenced by differences in fatty acid metabolism between sexes; females are reported to synthesise EPA, DPA and DHA from shorter chain n-3 fatty acids more readily than males( Reference Bakewell, Burdge and Calder 9 – Reference Giltay, Gooren and Toorians 13 ). Lipid metabolism alters with age and becomes dysregulated in obesity, and EPA and DHA concentrations have been reported to be affected by increasing BMI( Reference Thifault, Cormier and Bouchard-Mercier 12 , Reference Chouinard-Watkins, Conway and Minihane 14 ) as well as with age( Reference Crowe, Skeaff and Green 10 – Reference Thifault, Cormier and Bouchard-Mercier 12 ). APOE genotype is associated with altered lipid metabolism and transport, with differential responses in APOE4 carriers relative to non-carrier groups( Reference Thifault, Cormier and Bouchard-Mercier 12 , Reference Chouinard-Watkins, Conway and Minihane 14 ). Recent reports highlight the importance of APOE genotype in the response of EPA and DHA to supplementation and have indicated interactions between genotype and BMI( Reference Chouinard-Watkins, Conway and Minihane 14 ). In addition, the concentrations of LC n-3 PUFA in individual lipid pools within the blood (and in other tissues) differs( Reference Hodson, Skeaff and Fielding 15 ). However, despite these insights from the published literature, the influence of oily fish intake, along with sex, age, BMI and APOE genotype on EPA, DPA and DHA concentrations in different plasma pools has not been examined systematically. Using samples from the FINGEN study( Reference Caslake, Miles and Kofler 4 ), where participants were prospectively recruited based on a number of these variables (sex, age and APOE genotype), we have conducted such an analysis in a large number of participants to evaluate the independent and interactive impact of a number of potential determinants (oily fish intake, sex, age, BMI and APOE genotype) on EPA, DPA and DHA concentrations in the main plasma lipid fractions.
Methods
The FINGEN study was a multi-centre trial conducted at the Universities of Glasgow, Newcastle, Reading and Southampton in the UK. In all, 312 participants were recruited prospectively on the basis of APOE genotype (eighty-seven were APOE2 homozygotes or APOE2/APOE3, 111 were homozygous for APOE3, and 114 were APOE4/APOE3 or APOE4 homozygotes), sex (149 male and 163 female) and age (20–71 years, with approximately equal numbers in each of the five decades)( Reference Caslake, Miles and Kofler 4 ). Data from 306 participants were included in the present analysis, with the numbers in each subgroup detailed in the online Supplementary Tables S1 and S2. Exclusion criteria included: diagnosed endocrine dysfunction including diabetes or fasting glucose concentration >6·5 mmol/l, myocardial infarction in the previous 2 years, the use of medication that may interfere with lipid metabolism, fasting total cholesterol (TC) of >8·0 mmol/l or TAG of >3·0 mmol/l, a BMI of <18·5 or >36·0 kg/m2, or currently following a weight loss diet. Individuals taking n-3 fatty acid supplements were also excluded. The study was approved by the research ethics committee at each of the participating centres and written informed consent was obtained from all subjects before participation.
Study design
The FINGEN study was a randomised double-blind, placebo-controlled, cross-over study testing two doses of fish oil compared with placebo( Reference Caslake, Miles and Kofler 4 ). Here we evaluate the association of oily fish intake, sex, age, BMI and APOE genotype with fasting concentrations of EPA, DPA and DHA in plasma phosphatidylcholine (PC), NEFA, cholesteryl esters (CE) and TAG at baseline, before intervention. Habitual oily fish intake was estimated by FFQ, using self-reported portions completed at baseline. Oily fish was defined as salmon, herring, mackerel, fresh tuna, sardines, kippers and trout.
Fatty acid analysis
The fatty acid composition of the plasma fractions was determined by GC. Dipentadecanoyl PC, heneicosanoic acid, cholesteryl heptadecanoate and tripentadecanoin internal standards were added to the plasma. Total plasma lipid was extracted using chloroform–methanol (2:1, v/v) containing butylated hydroxytoluene (50 mg/l) as described by Folch et al.( Reference Folch, Lees and Sloane 16 ), and PC, NEFA, CE and TAG fractions were separated and isolated by solid-phase extraction on aminopropyl silica cartridges. CE and TAG were eluted in a combined fraction with the addition of chloroform. PC was then eluted from the cartridge with the addition of chloroform–methanol (60:40, v/v). NEFA were eluted from the cartridge with the addition of chloroform–methanol–glacial acetic acid (100:2:2, by vol.). CE and TAG were separated on hexane primed aminopropyl silica cartridge with the addition of hexane to elute CE, and the addition of hexane–methanol–ethyl acetate (100:5:5, by vol.) to elute TAG. The fatty acids within the resulting lipid fractions were methylated by the addition of methanol in 2 % (v/v) sulphuric acid at 50°C for 2 h to produce fatty acid methyl esters (FAME)( Reference Fisk, West and Childs 17 ). FAME were extracted into hexane and separated in a BPX-70 fused silica capillary column (30 m×0·25 mm×25 μm; SGE Analytical Science) using an Agilent 6890 series gas chromatograph equipped with flame ionisation detection (Agilent Technologies). The FAME were identified by comparison with retention times of thirty-seven FAME and menhaden oil standards run alongside the samples and quantified with the use of the internal standards using ChemStation software (Agilent Technologies) and Microsoft Excel (Microsoft Corporation). Fatty acid composition data are expressed as absolute concentrations (µg/ml plasma) and as relative concentrations (g/100 g total fatty acids (%)).
Statistics
Here we report baseline data obtained as part of the previous FINGEN trial( Reference Caslake, Miles and Kofler 4 ). Characteristics of participants included in the baseline analysis are detailed in the online Supplementary Tables S1 and S2.
Results for the relative (%) and absolute concentrations (µg/ml) of fatty acids are reported for 303–306 and 292–306 participants in the four plasma lipid fractions. Data were checked for normality by plotting distributions of residuals obtained from general linear model (GLM) analysis of the data and were analysed appropriately with a univariate GLM following log10 transformation. All variables were included in the univariate model with individual associations analysed using ‘main effects’ and interaction between age and BMI, age and fish intake, and sex and APOE analysed using ‘interaction’ analysis options within the model. P values were corrected for multiple analyses using Bonferroni post hoc analysis resulting in a significance value of P=0·006 for whole group analysis and P=0·008 for analyses where males and females were analysed separately. All statistical analyses were conducted using SPSS software (version 21; SPSS Inc.). Results are expressed as means with their standard errors or medians and 25th, 75th percentiles.
Results
The group (n 306) mean age and BMI were 45·1 (sem 0·7) years and 25·2 (sem 0·2) kg/m2, respectively.
Male and female participants were well matched for age, but males had a significantly higher average BMI (P<0·001, online Supplementary Tables S1 and S2). There were no sex differences in the proportion of total dietary energy consumed from fat, SFA, MUFA or PUFA (data not shown). The average oily fish intake was 1·0 portion/week with no association of sex with the oily fish intake.
For all three LC n-3 PUFA, the greatest concentrations were evident in the PC fraction, with median absolute concentrations (µg/ml) of 15·1, 11·9 and 44·1 for EPA, DPA and DHA, respectively. The median values for EPA, DPA and DHA for the whole group and P values for the association of oily fish intake, sex, age, BMI and APOE with the plasma concentrations of these fatty acids in the four lipid fractions are presented in Table 1. The data according to oily fish intake are shown in the online Supplementary Fig. S1–S4, whereas data according to age and BMI are shown in Table 2 and online Supplementary Tables S3–S5, and those according to APOE genotype×sex in Fig. 1–3.
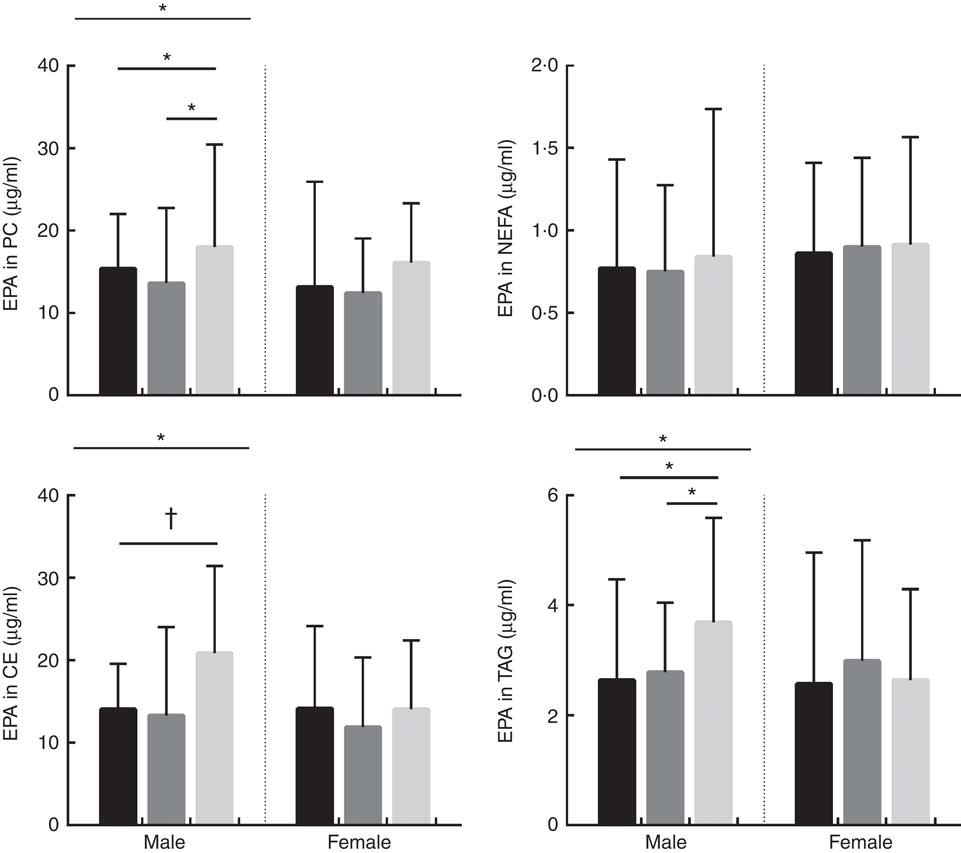
Absolute concentrations (µg/ml) of EPA in phosphatidylcholine (PC), NEFA, cholesteryl esters (CE) and TAG lipid fractions in male and female subjects according to APOE genotype. Distribution of participants in each APOE allele group are as follows; PC: males: E2/E2=1, E2/E3=32, E3/E3=40, E3/E4=51 and E4/E4=2, total: 126. PC: females: E2/E2=3, E2/E3=39, E3/E3=44, E3/E4=43 and E4/E4=10, total: 139. NEFA: males: E2/E2=2, E2/E3=29, E3/E3=45, E3/E4=50 and E4/E4=2, total: 128. NEFA: females: E2/E2=3, E2/E3=42, E3/E3=44, E3/E4=45 and E4/E4=10, total: 144. CE: males: E2/E2=2, E2/E3=33, E3/E3=50, E3/E4=52 and E4/E4=2, total: 139. CE: females: E2/E2=3, E2/E3=44, E3/E3=48, E3/E4=49 and E4/E4=10, total: 154. TAG: males: E2/E2=2, E2/E3=32, E3/E3=50, E3/E4=53 and E4/E4=2, total: 139. TAG: females: E2/E2=3, E2/E3=45, E3/E3=49, E3/E4=48 and E4/E4=10, total: 155. ![]() , APOE2;
, APOE2; ![]() , APOE3;
, APOE3; ![]() , APOE4. * P<0·050. † P=0·053. P values were obtained using log10 data in univariate general linear model (GLM) analysis controlling for covariates (age, BMI and oily fish intake). Where there was a significant association with APOE genotype, significance between specific APOE alleles was assessed using parameter estimates obtained from the GLM results.
, APOE4. * P<0·050. † P=0·053. P values were obtained using log10 data in univariate general linear model (GLM) analysis controlling for covariates (age, BMI and oily fish intake). Where there was a significant association with APOE genotype, significance between specific APOE alleles was assessed using parameter estimates obtained from the GLM results.
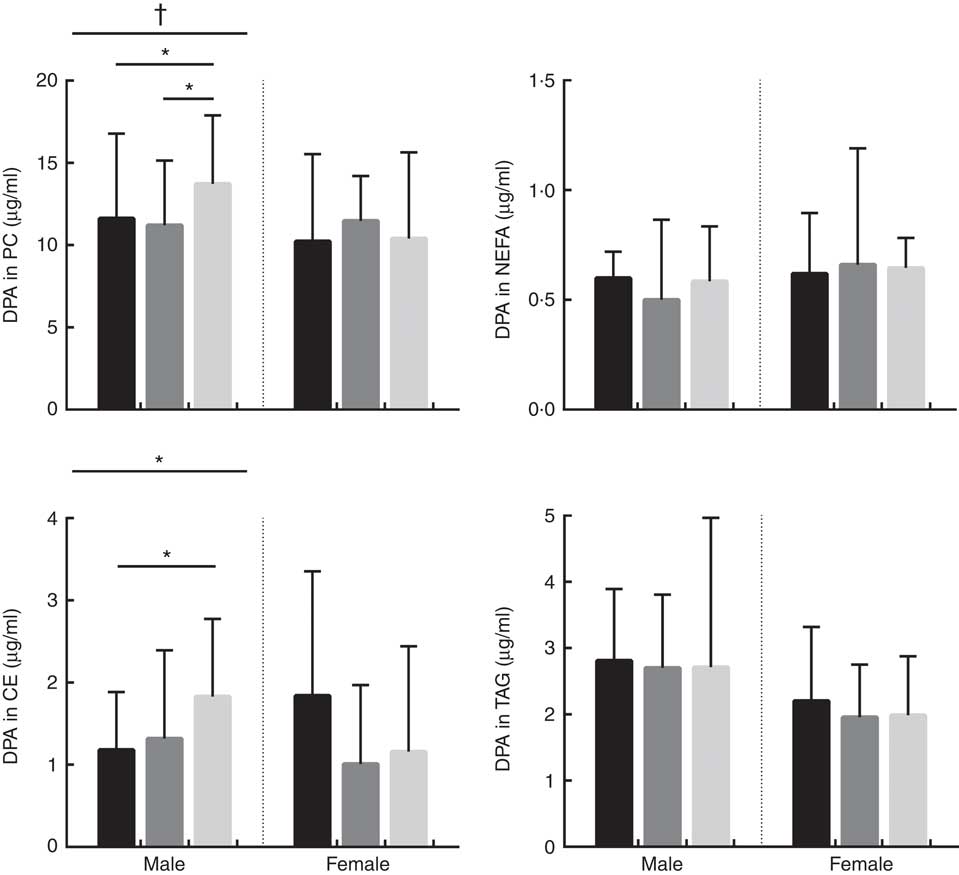
Absolute concentrations (µg/ml) of DPA in phosphatidylcholine (PC), NEFA, cholesteryl esters (CE) and TAG lipid fractions in male and female subjects according to APOE genotype. Distribution of participants in each APOE allele group are as follows; PC: males: E2/E2=1, E2/E3=32, E3/E3=40, E3/E4=51 and E4/E4=2, total: 126. PC: females: E2/E2=3, E2/E3=39, E3/E3=44, E3/E4=43 and E4/E4=10, total: 139. NEFA: males: E2/E2=2, E2/E3=29, E3/E3=45, E3/E4=50 and E4/E4=2, total: 128. NEFA: females: E2/E2=3, E2/E3=42, E3/E3=44, E3/E4=45 and E4/E4=10, total: 144. CE: males: E2/E2=2, E2/E3=33, E3/E3=50, E3/E4=52 and E4/E4=2, total: 139. CE: females: E2/E2=3, E2/E3=44, E3/E3=48, E3/E4=49 and E4/E4=10, total: 154. TAG: males: E2/E2=2, E2/E3=32, E3/E3=50, E3/E4=53 and E4/E4=2, total: 139. TAG: females: E2/E2=3, E2/E3=45, E3/E3=49, E3/E4=48 and E4/E4=10, total: 155. ![]() , APOE2;
, APOE2; ![]() , APOE3;
, APOE3; ![]() , APOE4. * P<0·050. † P=0·053. P values were obtained using log10 data in univariate general linear model (GLM) analysis controlling for covariates (age, BMI and oily fish intake). Where there was a significant association with APOE genotype, significance between specific APOE alleles was assessed using parameter estimates obtained from the GLM results.
, APOE4. * P<0·050. † P=0·053. P values were obtained using log10 data in univariate general linear model (GLM) analysis controlling for covariates (age, BMI and oily fish intake). Where there was a significant association with APOE genotype, significance between specific APOE alleles was assessed using parameter estimates obtained from the GLM results.
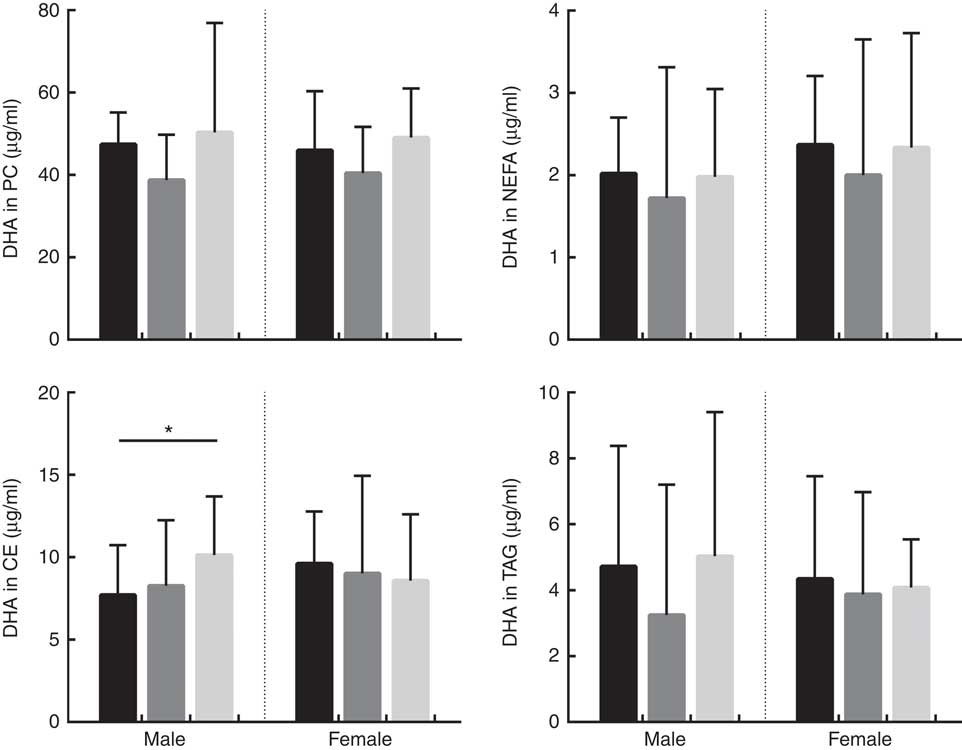
Absolute concentrations (µg/ml) of DHA in phosphatidylcholine (PC), NEFA, cholesteryl esters (CE) and TAG lipid fractions in male and female subjects according to APOE genotype. Distribution of participants in each APOE allele group are as follows; PC: males: E2/E2=1, E2/E3=32, E3/E3=40, E3/E4=51 and E4/E4=2, total: 126. PC: females: E2/E2=3, E2/E3=39, E3/E3=44, E3/E4=43 and E4/E4=10, total: 139. NEFA: males: E2/E2=2, E2/E3=29, E3/E3=45, E3/E4=50 and E4/E4=2, total: 128. NEFA: females: E2/E2=3, E2/E3=42, E3/E3=44, E3/E4=45 and E4/E4=10, total: 144. CE: males: E2/E2=2, E2/E3=33, E3/E3=50, E3/E4=52 and E4/E4=2, total: 139. CE: females: E2/E2=3, E2/E3=44, E3/E3=48, E3/E4=49 and E4/E4=10, total: 154. TAG: males: E2/E2=2, E2/E3=32, E3/E3=50, E3/E4=53 and E4/E4=2, total: 139. TAG: females: E2/E2=3, E2/E3=45, E3/E3=49, E3/E4=48 and E4/E4=10, total: 155. ![]() , APOE2;
, APOE2; ![]() , APOE3;
, APOE3; ![]() , APOE4. * P=0·021. P values were obtained using log10 data in univariate general linear model (GLM) analysis controlling for covariates (age, BMI and oily fish intake). Where there was a significant association with APOE genotype, significance between specific APOE alleles was assessed using parameter estimates obtained from the GLM results.
, APOE4. * P=0·021. P values were obtained using log10 data in univariate general linear model (GLM) analysis controlling for covariates (age, BMI and oily fish intake). Where there was a significant association with APOE genotype, significance between specific APOE alleles was assessed using parameter estimates obtained from the GLM results.
EPA, DPA and DHA in the plasma lipid fractions and statistical significance (P) of the association of oily fish intake, sex, age and BMI on absolute and relative concentrations of these LC n-3 PUFAFootnote * (Medians and 25th, 75th percentiles)
PC, phosphatidylcholine; CE, cholesteryl esters.
* P values obtained using log10 data in the univariate general linear model analysis. Individual associations were investigated for by the addition of all other variables as covariates, controlling for any associations between confounding variables that may influence the dependent variable. The resulting P values are therefore reflective of the sole association between the variable of interest and the dependant variable.
† Oily fish intake: 0 portions/week, 0·1–0·99/week, 1·0–1·99/week and 2+/week. Oily fish defined as: salmon, herring, mackerel, fresh tuna, sardines, kippers and trout.
‡ Age: 20–29, 30–39, 40–49, 50–59 and 60+ years.
§ BMI: normal weight=18–25 kg/m2, overweight=25·1–30 kg/m2 and obese=30·1–46 kg/m2.
Statistical significance (P) of the associations between oily fish intake, sex, age, BMI and long-chain (LC) n-3 PUFA in males and femalesFootnote *
PC, phosphatidylcholine; CE, cholesteryl esters.
* P values obtained using log10 data in the univariate general linear model analysis. Individual associations were investigated for by the addition of all other variables as covariates, controlling for any associations between confounding variables that may influence the dependent variable. The resulting P values are therefore reflective of the sole association between the variable of interest and the dependent variable.
† Oily fish intake: 0 portions/week, 0·1–0·99/week, 1·0–1·99/week, and 2+/week. Oily fish defined as: salmon, herring, mackerel, fresh tuna, sardines, kippers and trout.
‡ Age: 20–29, 30–39, 40–49, 50–59 and 60+ years.
§ BMI: normal weight=18–25 kg/m2, overweight=25·1–30 kg/m2 and obese=30·1–46 kg/m2.
Plasma EPA, DPA and DHA in the group as a whole
EPA
The concentration of EPA in plasma CE and TAG was positively associated with oily fish intake (P≤0·004), with evidence for positive association in plasma PC also (P=0·018) (Table 1). There was evidence for a positive association between EPA and age in plasma PC, CE’s and TAG (P=0·021, 0·019 and 0·034, respectively) and for the concentration of EPA in CE to differ by sex (P=0·055), (Table 2). A higher concentration of EPA in CE was observed in males (Table 2), and the concentration of EPA in TAG was associated with an APOE×sex interaction (P=0·044, data not shown).
DPA
The concentration of DPA was positively associated with oily fish intake in plasma TAG (P=0·006), with evidence for positive association in plasma PC also (P=0·022) (Table 1). DPA in TAG was positively associated with BMI (P=0·006) (Table 1), and there was evidence for the positive association of DPA in NEFA and CE with age (P=0·031 and 0·007, respectively, Table 1). The concentration of DPA significantly differed by sex with a higher concentration of DPA observed in plasma TAG in males (P≤0·001), with a trend in PC also (P 0·031) (Table 1). There was also a significant APOE×sex interaction for the concentration of DPA in CE (P≤0·005, data not shown).
DHA
The concentration of DHA in all plasma lipid fractions was positively associated with oily fish intake (P≤0·001). There was evidence for a positive association of DHA in TAG with BMI (P=0·020) (Table 1) and with age in PC, CE and TAG (P=0·037, 0·039 and 0·050, respectively, Table 1).
Overall in PC, NEFA, CE, and TAG, the highest oily fish consumers (2+ portions of oily fish per week) had 55, 42, 52 and 119 % higher EPA+DHA, respectively, compared with those reporting no oily fish intake (online Supplementary Fig. S4).
Due to the significant evidence for the association of sex and APOE×sex interactions, subgroup analysis was performed in males and females separately.
Subgroup analysis of plasma EPA, DPA and DHA according to sex
Significance data (P) are reported for EPA, DPA and DHA in Table 2 and median data are reported for EPA, DPA and DHA in the online Supplementary Tables S3–S5, respectively.
EPA (Table 2, online Supplementary Table S3)
The concentration of EPA in plasma TAG was positively associated with oily fish intake in both males and females (P≤0·008), whereas the concentration of EPA in PC was positively associated with oily fish intake in females only (P≤0·004). EPA concentration in TAG was positively associated with age and BMI in females (P=0·006), whereas EPA in TAG differed by APOE genotype in males (P=0·002), with evidence for this in CE also (P=0·019), (Fig. 1). A greater concentration of EPA in TAG was observed in male APOE4 carriers (P=0·002) with evidence for this in PC and CE also (P=0·019 and 0·053, respectively), (Fig. 1).
DPA (Table 2, online Supplementary Table S4)
The concentration of DPA in plasma TAG was positively associated with oily fish intake in females (P=0·008). There was evidence for DPA concentration in PC and CE to differ with APOE genotype in males (P≤0·053 and 0·030, respectively; Fig. 2) with further analysis revealing evidence for higher concentrations of DPA in PC in APOE4 allele carriers (P=0·032, Fig. 2).
DHA (Table 2, online Supplementary Table S5)
The concentration of DHA was positively associated with oily fish intake in plasma PC, NEFA, and TAG in females (P≤0·002) and plasma PC in males (P≤0·003), (Table 2). There was evidence for DHA in plasma NEFA to be associated with BMI in females (P=0·010, Table 2), and for DHA in CE to differ by APOE genotype in males. Further analysis revealed evidence for a higher concentration of DHA in CE in APOE4 carriers (P=0·021, Fig. 3).
Discussion
EPA and DHA have been widely reported for their beneficial effects on cardiovascular and cognitive health( Reference Calder 1 – Reference Caslake, Miles and Kofler 4 , Reference Calder 18 ) but a high level of variation in associations between intake and blood and tissue status has been observed( Reference Browning, Walker and Mander 8 ). The present analysis aimed to identify factors associated with concentrations of EPA, DPA and DHA in major lipid fractions in plasma from individuals consuming their usual diet in order to identify sources of variation in these concentrations. Identification of the contribution that oily fish intake, sex, age, BMI and APOE genotype make to EPA, DPA and DHA status is important for two reasons. First it will highlight the sources of the heterogeneity in the status of these fatty acids, contributing to a better understanding of the use of fatty acid profiles as a measure of dietary intake amongst different population subgroups. Second, it may allow the development of subgroup-specific recommendations for LC n-3 PUFA intake.
The present study reports associations for multiple confounding variables with the relative and absolute concentrations of EPA, DPA and DHA in different plasma lipids. The relative concentration allows investigation of LC n-3 PUFA concentrations in relation to all other fatty acids within the plasma pool (% unit changes), whereas the absolute concentration allows investigation of µg/ml unit changes in LC n-3 PUFA independently of any other fatty acid within the plasma pool. Both ways of expressing the data are useful and informative and both are used in the literature in the field. The absolute concentration of a fatty acid within any plasma lipid fraction will be influenced by the total concentration of that fraction. The absolute concentration of a particular fatty acid may differ between individuals or between subgroups while the relative concentration of that fatty acid may not be different between those individuals or subgroups. Conversely, the relative concentration could be different, but the absolute concentration may not be. Plasma lipids are involved in the transport of fatty acids between tissues where they have different actions depending upon their structure. Hence, the absolute concentration of a fatty acid in a plasma lipid reflects the exposure of tissues to that fatty acid and hence is likely to be a meaningful way of reporting the fatty acid. Conversely, fatty acids often compete with one another for metabolism or for function and hence the relative concentration of each fatty acid (i.e. %) is also likely to be meaningful.
Quantitatively, PC is the main plasma LC n-3 PUFA pool and the present study reports a greater relative concentration of EPA+DHA in plasma PC (online Supplementary Fig. S4) in individuals consuming 2+ portions of oily fish a week compared with those who reported not consuming oily fish, as well as positive associations between EPA, DPA and DHA in other plasma lipid fractions and oily fish intake. Positive associations for oily fish intake and EPA and DHA are reported for plasma phospholipids( Reference Andersen, Solvoll and Drevon 19 – Reference Visioli, Rise and Marangoni 21 ) which are confirmed by data from the present analysis which shows 55 % higher EPA+DHA in plasma PC in those consuming two portions of oily fish (each 150 g) per week compared with those reporting no oily fish consumption. Two portions of oily fish supply about 4–5 g of EPA+DHA per week, equivalent to 600–700 mg/d( Reference Calder 22 , Reference Lee, O’Keefe and Lavie 23 ). Previous studies report comparable increases of 81 % in plasma phospholipid EPA+DHA, and 8·8 and 8·5 µg/ml in total plasma EPA and DHA, respectively, following 16-week consumption of oily fish providing 485 mg EPA+DHA per d( Reference Harris, Pottala and Sands 20 ) and 6-week consumption of oily fish providing 927 mg EPA+DHA per d, respectively( Reference Visioli, Rise and Marangoni 21 ). Overall, the findings of the present analysis support existing reports that oily fish intake is associated with, and at a population level is the main determinant of, LC n-3 PUFA in all major blood lipid pools, which may, therefore, be used as biomarkers of oily fish intake( Reference Caslake, Miles and Kofler 4 , Reference Andersen, Solvoll and Drevon 19 , Reference Arab 24 , Reference Harris, Sands and Windsor 25 ). Our analysis does not clearly indicate which plasma lipid fraction would best reflect dietary intake of EPA and DHA, as, in general all four plasma lipid fractions showed dose-dependent increases in EPA and DHA concentration (both absolute and relative) with increasing frequency of oily fish consumption.
There is some evidence that age influences the concentration of EPA and DHA in various plasma fatty acid fractions( Reference Crowe, Skeaff and Green 10 ), which has been attributed in part to the higher habitual fish intake with increasing age. Oily fish intake was controlled for in the present statistical analysis, allowing clearer attribution of any observed associations of age with EPA, DPA and DHA concentrations to altered metabolism and not to dietary differences in intakes of oily fish. Any influence of APOE group distribution was also ruled out as, despite a greater number of individuals aged 50–59 years being included in the present analysis, there was no significant difference in the distribution of APOE2, E3 and E4 genotypes between age groups (data not shown). A 28-d stable isotope tracer study in young (mean age 27 years) v. older (mean age 77 years) adults reported a 1- to 2-fold greater enrichment of 13C-DHA in plasma phospholipids and CE in the older age group, suggesting a medium-term age-related difference in DHA homoeostasis associated with accumulation of DHA in the circulation in older people( Reference Plourde, Chouinard-Watkins and Vandal 26 ). The findings of the present analysis support reports of increased plasma DHA with increasing age( Reference Walker, Browning and Mander 11 , Reference Rees, Miles and Banerjee 27 , Reference Cunnane, Chouinard-Watkins and Castellano 28 ) and we further also report positive associations between age and EPA and DPA, suggesting LC n-3 PUFA accumulate in plasma pools during aging. However, this may in part be due to an increase in circulating cholesterol and CE with age (Table 3). Evidence of positive associations of plasma TC with age dates back to the late 1970s( 29 ), and these have been reported in both males and females( Reference Schaefer, Lamon-Fava and Cohn 30 ). Increased circulating LDL (Table 3) may be reflected in higher absolute total PC and CE concentrations with age (P=0·008 and 0·018, age 20–29 v. 60+ years for PC and CE, respectively, data not shown) and we observed that TC and LDL-cholesterol concentrations were significantly positively correlated with LC n-3 PUFA concentrations in PC (TC, P=<0·001, 0·003, 0·027; LDL-cholesterol P=<0·001, <0·001, 0·003, absolute EPA, DPA and DHA, respectively, data not shown), and that TC, LDL-cholesterol and HDL-cholesterol concentrations were positively correlated with LC n-3 PUFA in CE (TC, P=<0·001, 0·002 absolute EPA and DHA, respectively, LDL, P=<0·001, 0·046, 0·055 absolute EPA, relative DPA and DHA, respectively, HDL-cholesterol, P=0·046 relative DPA, data not shown). These data suggest CE levels may play a significant role in the association of age with LC n-3 PUFA reported in this analysis.
Blood cholesterol (mmol/l) concentration according to sex, age, BMI, APOE genotype and oily fish intake (Mean values with their standard errors)
TC, total cholesterol.
* P values obtained from one-way ANOVA model.
† P values obtained from Pearson’s correlation model.
‡ BMI: normal weight=18–25 kg/m2, overweight=25·1–30 kg/m2 and obese=30·1–46 kg/m2.
§ APOE genotype: E2 (E2/E2 and E2/E3), E3 (E3/E3) and E4 (E3/E4 and E4/E4).
|| Oily fish defined as: salmon, herring, mackerel, fresh tuna, sardines, kippers and trout.
Insulin has a role in the regulation of genes involved in whole body lipid homoeostasis including in the removal of lipids from the circulation( Reference Stahl, Evans and Pattel 31 ); in cases of insulin resistance, such removal can be compromised. The occurrence of insulin resistance is reported to rise with increasing age and BMI and despite individuals with diabetes or a fasting glucose concentration >6·5 mmol/l being excluded from the present analysis, differences in fasting glucose were still evident between age and BMI groups (glucose positively correlated with age and BMI; P<0·001 both, data not shown). Thus, insulin resistance may contribute to the higher EPA and DPA concentrations in plasma lipid pools observed with increasing age and BMI.
Increasing body fatness and obesity influence many aspects of fatty acid and lipid metabolism and contribute to disease states such as hypertriglyceridemia, diabetes, and fatty liver disease( Reference Thifault, Cormier and Bouchard-Mercier 12 , Reference Sorci-Thomas, Babiak and Rudel 32 ); loss of insulin sensitivity with increasing adiposity results in adipose tissue lipolysis and associated higher plasma NEFA concentrations( Reference Sorci-Thomas, Babiak and Rudel 32 – Reference Jensen, Haymond and Rizza 34 ). In the present analysis, there was no correlation between total NEFA concentrations and BMI (data not shown); however, significant, but complex, associations between BMI and LC n-3 PUFA were evident in plasma TAG, with an overall trend towards lower relative concentrations of EPA and DHA with increasing BMI, which is consistent with previous observations( Reference Micallef, Munro and Phang 33 , Reference Klein-Platat, Drai and Oujaa 35 ). Increased β-oxidation of DHA associated with increased BMI may in part explain lower proportions of LC n-3 PUFA in TAG( Reference Plourde, Chouinard-Watkins and Rioux-Perreault 36 ) although altered TAG synthesis and/or selective tissue uptake and partitioning in obesity may also be involved. We observed no association of BMI with absolute plasma concentrations of LC n-3 PUFA and suggest the lower relative concentrations (i.e. %) of EPA and DHA are likely to be offset by increases in total TAG concentrations with increasing BMI.
The proteins encoded by the APOE gene play a major role in the transport and metabolism of lipids via interaction with LDL receptors (LDLR). Two common polymorphisms (rs7412 and rs429358) of the APOE gene in humans result in three protein isoforms, APOE2, E3 and E4. APOE2 and APOE3 are found in the circulation mainly on HDL whereas APOE4 is found preferentially on VLDL with lower concentrations residing on HDL( Reference Gregg, Zech and Schaefer 37 ). The APOE4 allele has been associated with reduced longevity( Reference Soerensen, Dato and Tan 38 ) and enhanced the risk of CVD( Reference Bennet, Di Angelantonio and Ye 39 ) and Alzheimer’s disease( Reference Bertram, McQueen and Mullin 40 ). Although centrally involved in fatty acid transport and handling in plasma and tissues (and in particular within the brain where APOE is almost the only apo present), the impact of APOE genotype on these processes, and the contribution of dysregulated EPA and DHA metabolism to disease risk is unknown. However, 13C-DHA labelling studies provide evidence that DHA metabolism is disturbed in those who are APOE4 carriers( Reference Chouinard-Watkins, Rioux-Perreault and Fortier 41 ).
In the present analysis, APOE4 carriers had significantly higher concentrations of TC and HDLC, and lower concentrations of LDL-cholesterol (Table 3); however, sex×APOE genotype interactions were evident and in male APOE4 carriers we observed significantly higher concentrations of LDL-cholesterol as well as of total CE (data not shown). One advantage of investigating associations in individual plasma lipid classes as opposed to total lipid is that possible effects of APOE and lipoprotein transport and metabolism may be more easily identified. If the associations between APOE and LC n-3 PUFA are seen to occur in lipid pools which are predominantly related to LDL and VLDL particles, they may reflect the dysregulation in lipoprotein handling in people with the E4 allele. However, if the associations between LC n-3 PUFA and APOE genotype are seen to occur across all lipid pools, they may be indicative of alternative mechanisms. Further subgroup analysis indicated higher EPA, DPA and DHA concentrations in CE, EPA and DPA in PC, and EPA in TAG in male APOE4 carriers relative to the non-carrier groups. The higher EPA and DHA may reflect higher overall CE and PC concentrations; however, the lack of association between APOE genotype and fatty acid concentrations in females is suggestive of a sex-specific association independent of CE and PC metabolism.
Interestingly, we have previously reported APOE genotype mediated differences in the response of plasma EPA and DHA to a fish oil supplement given over 8 weeks in males, with lower enrichment in total lipid and phospholipid EPA and DHA in APOE4 carriers relative to the wild-type APOE3/E3 genotype, but only in overweight participants( Reference Chouinard-Watkins, Conway and Minihane 14 ). The aetiology of these associations with LC n-3 PUFA metabolism is currently unknown. As with the association with age, higher plasma LC n-3 PUFA in APOE4 carriers may reflect reduced tissue uptake and DHA accumulating in the circulation. Although lower overall concentrations of APOE were observed in APOE4 carriers (data not shown) no difference in plasma APOE concentrations were evident between sexes, which potentially could have contributed to the differential associations of APOE genotype with EPA, DPA and DHA concentrations. The preferential binding of VLDL by APOE4 and possible associations of APOE genotype with PC and CE synthesis and cellular uptake of EPA and DHA via the LDLR family, LDLR concentrations and specific LC PUFA transporters such as the MFSD2A transporter in the brain( Reference Nguyen, Ma and Shui 42 ) may be involved, and are worthy of future investigations. Associations between sex and the activity of these transporters and receptors would also be of interest, along with sex and APOE associations with FADS and ELOVL genes which encode desaturation and elongation enzymes required for the synthesis of LC n-3 PUFA. Differential synthesis of EPA and DHA has been reported between sexes; Pawlosky et al. report greater ability of females to convert ALA to DHA through increased conversion of DPA to DHA compared with males when consuming a beef-based diet. These results were not observed when consuming a fish based diet in which the capacity to convert DPA to DHA was equal between males and females. These findings suggest LC n-3 PUFA metabolism in females may be more sensitive to dietary alterations or may be affected by hormonal regulation( Reference Pawlosky, Hibbeln and Lin 43 ). Indeed there is evidence for up-regulation of the desaturase–elongase pathway via oestrogenic actions resulting in the increased conversion of ALA to EPA( Reference Andersen, Solvoll and Drevon 19 , Reference Katan, Deslypere and van Birgelen 44 , Reference Childs, Kew and Finnegan 45 ) and DHA( Reference Walker, Browning and Mander 11 , Reference Giltay, Gooren and Toorians 13 , Reference Childs, Romeu-Nadal and Burdge 46 ) indicating significant effects of female sex hormones on the metabolism of LC n-3 PUFA. Consistent with these observations, there is evidence for an increase in DHA in relation to EPA and DPA at baseline and response to EPA+DHA intake in females compared with males( Reference Metherel, Armstrong and Patterson 47 , Reference Patterson, Chalil and Aristizabal Henao 48 ). The present analysis further reports lower concentrations of both DPA (−36 % lower absolute concentration in TAG) and EPA (20 % lower absolute concentration in TAG) in females but does not report higher concentrations of DHA in females or find a significant effect of sex on the ratio of DPA: DHA (P>0·50, data not shown). However, these results are also in contrast to other reports describing increased concentrations of EPA and DHA in females( Reference Andersen, Solvoll and Drevon 19 , Reference Katan, Deslypere and van Birgelen 44 , Reference Childs, Kew and Finnegan 45 ). These data from the present analysis suggest investigation into associations between sex, APOE, and fatty acid synthesis enzymes and transporters would be of worthwhile to understand further the mechanisms by which these associations occur.
In conclusion, we report concentrations of EPA, DPA and DHA to vary across APOE genotype and that sex is an important factor to consider when evaluating LC n-3 PUFA concentrations in these genotypic subgroups. Our results also confirm that concentrations of EPA, DPA and DHA in plasma pools are suitable population markers of oily fish consumption and show that age and sex are important contributors to the variation in EPA, DPA and DHA concentrations in plasma lipids independent of APOE genotype. These variables should be considered when interpreting LC n-3 PUFA concentrations as a marker of dietary intake and when suggesting dietary LC n-3 PUFA recommendations to ensure benefits are achieved across population subgroups. The investigation into the handling of supplemental EPA and DHA in these subgroups is to be addressed in a further publication and could provide the basis for more detailed advice. However, the aetiology and physiological significance of the interaction between sex and APOE genotype and its association with EPA, DPA and DHA status still requires further investigation.
Acknowledgements
The authors thank Christine Williams and Muriel Caslake for study design contributions, and Dorothy Bedford, Josephine Cooney, Frances L. Napper, Lesley Farrell, Christine Gourlay, Jilly P. Grew, Elaine McDonald, Elizabeth Murray, Julie Stannard, Grace Stewart, May Stewart, Philip Stewart, Elli Vastardi and Jan Luff for technical assistance.
Supported by grant no: RRD7/N02/A from the UK Food Standards Agency, and by Ocean Nutrition, which donated the oil capsules used in the study.
The authors’ responsibilities were as follows: G. L., C. K. A., J. C. M., C. J. P., P. J. C. and A. M. M. (the study management group) were responsible for designing the original FINGEN study and supervising all aspects of the reported work; E. A. M., B. M. K., P. J. C. and C. K. A. recruited and screened volunteers, carried out the intervention, collected the blood samples and collected the anthropometric, questionnaire and compliance data; H. L. F. conducted the laboratory analysis reported herein and wrote the draft of the manuscript; H. L. F. and M. I. conducted statistical analysis; all authors contributed to the final version of the manuscript.
P. J. C. is an advisor to Pronova BioPharma, Aker Biomarine, Smartfish, Sancilio, Solutex, Dutch State Mines, Cargill and Danone/Nutricia. None of the authors has any conflicts of interest to declare.
Supplementary material
For supplementary material/s referred to in this article, please visit https://doi.org/10.1017/S000711451800106X


