

Methods of dietary monitoring in Finland
The three main levels of aggregation of dietary information are national food availability, household food availability and individual food consumption. In dietary monitoring, the individual food consumption may be further divided into quantitative measurements obtained in food consumption and dietary surveys as well as semiquantitative or qualitative measurements describing dominant food choices and behaviour-related measures obtained by questionnaires or interviews. In Finland, all these sources of information have been used for dietary monitoring purposes. The long-term trends of food consumption and nutrient intake have shown many notable changes in Finnish diet during the last decades.
National food availability data
Data on available food commodities, per capita consumption, have been compiled annually since the crop year 1949/1950 and since 1970 based on the calendar year in the form of food balance sheets. The Statistical Group of the Information Centre at the Ministry of Agriculture and Forestry (Tike) is the official authority responsible for collating the agricultural statistics in Finland and it publishes the food balance sheets(1). These data provide essential information on the national food system, including domestic supply (production, imports and exports), domestic utilisation (use of the commodity for feed, seed, processing, waste and food), and per capita values for the supply of all commodities (kg/person per year).
The information presented in the balance sheet is mainly compiled from the statistics of the Information Centre of the Ministry of Agriculture and Forestry, Finnish Food and Drink Industries’ Federation, the National Board of Customs and the Finnish Game and Fisheries Research Institute. The Balance Sheet for Food Commodities summarises the production, domestic use and consumption of eleven food product groups (cereals, potato, sugar, legumes, vegetables, fruit and berries, meat, eggs, fish, milk products, fats) and beverages. Consumption of food commodities is presented on a national level and as an average per person. In addition, nutritional content of food, i.e. protein, fat and energy, is also analysed. The food balance sheet is compiled in accordance with the classification structure of the FAO of the United Nations. Food availability, however, is a crude measure that does not take into account the amount of food that goes unconsumed.
The food balance sheet data have shown the major consumption changes in the Finnish diet since 1950, i.e. a major decrease of cereal and potato consumption between 1950 and 1975, a tripling vegetable consumption starting in the early 1970s as well as a quadruple increase in fruit consumption throughout the years 1950–1990 (Fig. 1). Milk consumption was very high, at about 1 l/person per day (about 350 kg/person per year) in the 1950s, but has decreased to half at the end of the 1950s, and then again at the end of the 1970s (Fig. 2). Conversely, the consumption of cheese has more than doubled during the last 30 years. The changes in butter and milk consumption have substantially accounted for the changes in fat consumption and quality in Finland, although the reduction of fat intake from milk and butter has been partly balanced by increased cheese consumption.
Selected trends of food availability in 1950–2007 according to food balance sheets: ![]() , cereals;
, cereals; ![]() , potato;
, potato; ![]() , fats;
, fats; ![]() , meat;
, meat; ![]() , fish;
, fish; ![]() , fruits and berries;
, fruits and berries; ![]() , vegetables
, vegetables

Consumption of liquid milk products 1950–2006 according to food balance sheets: ![]() , whole milk (used on farms);
, whole milk (used on farms); ![]() , whole milk;
, whole milk; ![]() , low-fat milk;
, low-fat milk; ![]() , skimmed milk;
, skimmed milk; ![]() , sour milk;
, sour milk; ![]() , yoghurt;
, yoghurt; ![]() , liquid milk, total
, liquid milk, total

Household budget surveys
Statistics Finland has collected food purchase data of households from the household budget surveys between 1966 and 1998, as amounts, and in 2006 as consumption expenditure of specific foods. The 2006 data has been further divided by the corresponding unit prices to produce comparable data for consumption trends. Altogether seven surveys have been carried out in 40 years and the trend results published recently(Reference Viinisalo, Nikkilä and Varjonen2). In these studies, the consumption of foods includes foods purchased from shops to take home and self-produced or collected foodstuffs. However, it does not include information concerning eating outside the home, or take-away meals. The food expenditure data have been classified according to the COICOP-HBS classification in which the number of food classes was over 250(Reference Viinisalo, Nikkilä and Varjonen2). The results are presented by household type, age group, region and socio-economic group.
The results from the household budget surveys show in part trends of the same kind as the food balance sheet data, e.g. decreased consumption of milk, potatoes and cereals, and increased consumption of fruit and soft drinks (Fig. 3). The household budget survey data show also that the consumption of bread (about 35 kg/person per year) has not changed during the last 40 years, but consumption of flour and cereals has decreased to less than one third its previous level, from 57 kg to 15 kg, indicating decreased baking and preparation of cereal foods at homes. Consumption of sugar has also decreased to a third of its level in the 1960s according to the household budget survey data. The food balance sheet data, on the other hand, shows similar sugar consumption levels between the 1950s and the early 2000s. These data are indications of a fall in the acquisition of ingredient type of foods and increased consumption of processed food, which is in accordance with the decreased food and meal preparation at homes during the past decades. The purchases of preserved and prepared foods have grown between 1966 and 2006, according to the household budget surveys, from about 6 kg to 29 kg (person/year). Purchases of ingredient type of foods were greater in older age groups than younger ones. The consumer expenditure on eating outside the home was larger in younger age groups compared with older ones. Popular foods in the more urban metropolitan area were cheese, greenhouse vegetables, fruit, pastry and cakes, pasta, pizza and mineral water, and less popular foods were milk, potatoes, sausage, wheat flour, sugar and fat spreads, compared with the other areas of the country. Geographical differences were also indicated(Reference Viinisalo, Nikkilä and Varjonen2).
Selected trends of food consumption in 1966–2006 according to household budget surveys: ![]() , flour flakes;
, flour flakes; ![]() , bread;
, bread; ![]() , sweet bakery products;
, sweet bakery products; ![]() , fresh fruit and berries;
, fresh fruit and berries; ![]() , fruit juice;
, fruit juice; ![]() , potatoes and potato products;
, potatoes and potato products; ![]() , sugar and syrup;
, sugar and syrup; ![]() , soft drink (I)
, soft drink (I)

Questionnaires related to dietary behaviour
Postal surveys of health behaviour were first carried out in Finland biannually in North Karelia during the beginning of the project period in 1972–1977. Since 1978, this approach has been widened to cover the whole of Finland, and the health behaviour and health among the Finnish adult population surveys have been conducted annually from a random sample of the adult population between 15 and 64 years of age(Reference Helakorpi, Paavola and Prättälä3). Each year the sample size has been about 5000. Since 1985, a similar approach was adopted for the elderly population, aged 65–79 (later 84) years. These postal surveys have been carried out every second year for a stratified random sample of 1800 (since 1993, 2400) persons(Reference Laitalainen, Helakorpi and Uutela4).
Both these surveys have included self-administered questions on diet and eating habits. The main aim has been to gather information on eating habits such as frequency of eating and snacking, eating places, use of worksite restaurants and catering services; and also information on food choices, such as type of fat used in cooking, type of milk or bread spread usually consumed, drinking habits and use of food supplements. These surveys have also included short food frequency questionnaires on the most common food items.
These repeated measures have enabled the observation of the changes in food habits, at population level that have resulted from active nutrition policies, legislative changes, recommendations and programs. As an example, illustrated in Fig. 4, the 35-year trends in dietary habits (eating vegetables daily, drinking skimmed milk or milk with 1 % fat and using butter on bread) are presented from the health behaviour and health among the Finnish adult population surveys(Reference Helakorpi, Paavola and Prättälä3).
Proportion (%) of those eating vegetables daily, drinking skimmed or 1 % milk (1 % fat) and using butter on bread among 15–64-year-old population in Finland in 1978–2008: ![]() , butter on bread;
, butter on bread; ![]() , vegetables daily;
, vegetables daily; ![]() , skimmed or 1% milk
, skimmed or 1% milk

Health examination surveys including dietary surveys
Different population-based surveys on diseases, risk factors and related health behaviours have been carried out in Finland regularly since late 1960s. The first large-scale study was the Finnish Mobile Clinic Health Examination Survey during 1966–1972 (baseline study) with over 51 000 participants over 15 years of age, arranged by the Social Insurance Institution(Reference Hasunen, Pekkarinen and Koskinen5). Food consumption of 10 054 participants was assessed using a dietary history interview(Reference Järvinen6). The reexamination study of the Finnish Clinic Health Examination Survey was conducted during 1973–1976 with over 17 000 participants. The aim of the present study was to assess comprehensively the health status and functional capacity of the Finnish adult population. The cohort was also followed up in 1973–1976. Later there were similar large studies, first the Mini-Finland study from 1977 to 1981 with 7200 participants over 30 years of age(Reference Aromaa, Heliövaara and Impivaara7, Reference Seppänen and Karinpää8), and more recently the Health 2000 survey, carried out in years 2000 and 2001, with a representative sample of about 10 000 participants aged over 18 years(Reference Montonen, Männistö and Sarkkola9). The Mini-Finland study included a short questionnaire on dietary factors, whereas the Health 2000 survey included both questionnaires on dietary behaviours and a validated food frequency questionnaire with 128 food items to measure the subject’s diet as a whole(Reference Heistaro10).
Cross-sectional population surveys mainly concerning cardiovascular risk factors have been carried out in Finland since 1972 at 5-year intervals. These surveys that were established to evaluate the effects of the North Karelia project(Reference Puska, Salonen and Nissinen11), later served the purposes of the WHO MONICA project(12), and have recently been developed into a national risk factor monitoring approach, the National FINRISK study(Reference Peltonen, Harald and Männistö13, Reference Vartiainen, Laatikainen and Peltonen14). This health monitoring system, launched in the provinces of North Karelia and Kuopio in the east in 1972, now covers the regions of North Karelia, Northern Savo (former Kuopio province), Turku and Loimaa in the south-west, the capital area including Helsinki and Vantaa, and also provinces of Oulu and Lapland in the north. The survey sample of the adult population aged 25–64 (later 74) years has been stratified by area, sex and 10-year age groups, and has varied between 6000 and 13 500 in different survey rounds. All these surveys have included questions on dietary behaviour and also short food frequency questionnaires. More detailed information on diet has been collected in sub-studies of the National FINRISK study, such as the national FINDIET survey by diaries, recalls and laboratory samples.
The national dietary surveys
The national FINDIET surveys conducted by the National Institute for health and welfare (previously the National Public Health Institute) have followed the food consumption and nutrient intake among the Finnish adult population since 1982 (Table 1)(Reference Uusitalo, Pietinen and Leino15–Reference Paturi, Tapanainen and Reinivuo19). The FINDIET survey has been a part of the National FINRISK study, which monitors the risk factors of chronic diseases regularly every 5 years(Reference Peltonen, Harald and Männistö13, Reference Vartiainen, Laatikainen and Peltonen14). The dietary surveys have included about 30 % of those participants invited to participate in the National FINRISK study, i.e. 1300–2900 men and women per survey (Table 1). The participation rates have ranged from 60 % to 72 %. The design and methods used in the latest dietary survey in 2007 are described in more detail elsewhere in this issue(Reference Reinivuo, Hirvonen and Ovaskainen20).
Selected characteristics of the national dietary surveys of Finnish adults between 1982 and 2007
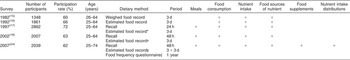
*For validation study (n 334).
†For validation study (n 336).
‡For validation study and nutrient intake distributions (n 912 and n 606, respectively).
§Three months later for those participated in the FINRISK survey (the DILGOM study, n 5024).
Three-day food records were used in the two earliest FINDIET surveys (Table 1). Portions were estimated first by weighing, and later by household measures and validated picture booklets. In the FINDIET 1997 survey, the method was changed into a 24 h recall approach to increase the participation rate. Furthermore, trained interviewers were able to increase the accuracy and reliability of the gathered information by asking targeted questions. In the two latest surveys, the 48 h recall method was used with additional 3–6 d estimated food record data collected in a subsample to enable habitual nutrient intake estimations and intake distribution modelling(Reference Reinivuo, Hirvonen and Ovaskainen20, Reference Pietinen, Paturi and Reinivuo21). Thus, the changes in the dietary methods should be taken into account when the trends of food consumption and nutrient intake are interpreted. Figure 5 shows favourable trends especially in total fat and saturated fat intake (E %) in Finland during the last decades based on the FINDIET survey data, which correspond to the trends of food balance sheet data on milk fat consumption. The main results of the recent FINDIET 2007 survey are described in detail elsewhere in this issue(Reference Pietinen, Paturi and Reinivuo21). The future challenges for dietary surveys include keeping the participation rates in dietary surveys at acceptable levels and controlling under/over-reporting of diet. It has been summarised in the literature that 2–85 % of participants under-reported and 1–39 % over-reported their energy intake (EI) depending on study population(Reference Maurer, Taren and Teixeira22). Data from a Swedish dietary survey showed that participants with an implausible low EI/BMR ratio (under-reporters) reported lower intake of fat (E %), saturated fatty acids (E %) and carbohydrate (E %), but higher intake of protein (E %)(Reference Becker, Foley and Shelley23). Instead, Irish data with more strict definition of under-reporters than the Swedish data found no differences between the intakes of macronutrients with and without under-reporters. It has also been shown that under-reporters had dietary habits closer to recommended levels, such as lower fat intake and higher fibre intake, than those with acceptable energy intakes(Reference Becker and Welten24). This was due to less frequent consumption, a larger proportion of non-consumers and smaller portion sizes. In Finland and in the United States, under-reporting has been found to be very similar between different kinds of food items, and the results seem to be comparable both with and without under-reporters(Reference Hirvonen, Männistö and Roos25, Reference Bailey, Mitchell and Miller26). In addition, when the results are presented per unit of energy (MJ) or as a percentage of total energy, the under-reporting issue is for the most part mastered.
The trends of total fat and fatty acid intakes (recommended levels in parenthesis) according to the national FINDIET surveys 1982–2007 in Finland: ![]() , total fat (∼30 E%);
, total fat (∼30 E%); ![]() , SFA (∼10 E%);
, SFA (∼10 E%); ![]() , MUFA (10–15 E%);
, MUFA (10–15 E%); ![]() , PUFA (5–10 E%)
, PUFA (5–10 E%)

The national FINDIET surveys include information on daily meals, average food consumption and nutrient intakes as well as food sources of nutrients (Table 1)(Reference Paturi, Tapanainen and Reinivuo19). The latest survey in 2007 also included some new features, such as participants aged 65–74 years and nutrient intake distributions. Furthermore, for the first time all participants who took part in the national FINRISK/FINDIET survey 2007 were invited 3 months later to participate in the second health examination of the DILGOM obesity cohort (dietary, lifestyle and genetic determinants of obesity and metabolic syndrome). During the second health examination, all participants filled in a food frequency questionnaire that measured the subject’s usual diet over the previous 12 months.
Monitoring of nutrient status
Monitoring of nutrient status in Finland has been restricted to some important nutrients. Urinary excretion of iodine was first investigated by Artturi I. Virtanen in the 1940s(Reference Lamberg27). Sodium intakes have been monitored by 24 h urinary excretion measurements in four risk factor surveys since the late 1970s(Reference Laatikainen, Pietinen and Valsta28). The low level of selenium in the Finnish soil and disturbingly low intakes of selenium were the reason for the enrichment of fertilisers with selenium in 1984, and the selenium status of different population groups have been monitored by a special monitoring programme since then(Reference Alfthan29). Since 1992, nutritional status has been monitored in smaller sub-samples of the National FINRISK Studies. The main nutrients of interest have been vitamin D, vitamin C, folate, iron and iodine(Reference Matilainen, Vartiainen and Puska30–Reference Lahti-Koski, Valsta and Alfthan33).
Challenges of dietary monitoring in the future
At the moment the dietary monitoring system as well as the other health monitoring systems in Finland cover the majority of the different aspects of diet and eating habits, and include most geographical areas in Finland and also widely different population groups including the elderly (Fig. 6). The main challenge is the lack of dietary data on children. The only national data source is the Annual National School Health Survey that covers children aged 15–18 years. These surveys are carried out anonymously and gathered self-reported data on health behaviours(34). There is no repeated national data source on younger children’s diet or eating habits. From some large cross-sectional and cohort studies, such as the Cardiovascular Risk in Young Finns Study (the LASERI study)(Reference Åkerblom, Viikari and Uhari35), and the Finnish Type 1 Diabetes Prediction and Prevention Project(Reference Virtanen, Kenward and Erkkola36), good data on children’s nutrition have, however, been obtained. Since 2006, the Child Health Monitoring Project (LATE) has developed a national system to collect health and health-related behavioural data on children directly from the child health-care and school health-care systems that in Finland cover almost 100 % of the target population aged 0–15 years(Reference Mäki, Laatikainen and Koponen37). However, this brings only a partial solution as assessment of diet during regular health checks is challenging and not usually possible except by some simple measures. More detailed assessment of dietary information requires special survey techniques.
Coverage of dietary monitoring targets and population groups by different currently conducted national monitoring approaches including dietary information in Finland

Recently, several international approaches have been established to harmonise health monitoring especially in Europe(Reference Tolonen, Koponen and Aromaa38). The European Union has launched several programmes on common indicators and monitoring approaches related to different health topics. This creates great challenges for the national monitoring systems. It is very important to get comparable data with other countries and to keep the national trends which are easily destroyed if the methodology is changed between surveys. There are also initiatives to harmonise nutrition monitoring in Europe. On the basis of the Finnish experience, combining the dietary monitoring with other health monitoring strategies has been a wise solution enabling the rich use of data.
Public health implications
These various regularly repeated monitoring approaches including different measures of diet and eating habits are nationally unique sources of dietary information. Data is widely used in monitoring the Finnish diet, influencing national policies and dietary recommendations, affecting and supporting the development of a public health supportive food industry as well as largely for research. The individual social security numbers of inhabitants in Finland enable the linkage of survey data to national administrative registers, thus survey participants can be followed-up and their disease and death endpoints can be recorded. This clearly increases the value of large population-based data sets for epidemiological research. Individual-based information also makes it possible to utilise data for more informative reporting, such as the production of regional maps on health promoting diet and related risk factors(Reference Similä, Taskinen and Männistö39). Reporting data in visually informative ways, e.g. taking advantage of the geographical information systems, serves the needs of policy and decision makers.


