

The metabolic syndrome, a combination of medical disorders, increases the risk of CVD and type 2 diabetes. Insulin resistance and visceral adiposity are the core features of the syndrome(Reference Cheal, Abbasi and Lamendola1). The interaction of both genetic and environmental factors contributes to its development. The type of dietary protein appears to be a crucial factor involved in lipid, glucose and energy metabolisms in experimental animals and human subjects. In this regard, several studies have demonstrated the anti-lipogenic and anti-hypertensive effects of soya protein. In addition, other health benefits of dietary soya protein, which include anti-diabetic effects improving glucose homeostasis and insulin sensitivity, have also been suggested(Reference Torres and Tovar2). In animal models of obesity(Reference Velasquez and Bathena3), soya protein ingestion limits or reduces weight gain and adiposity, and improves insulin resistance. Tovar et al. (Reference Tovar, Torre-Villalvazo and Ochoa4) have shown that dietary soya protein increases PPARγ mRNA expression and reduces sterol regulatory element-binding protein-1 expression in adipocytes of Zucker diabetic fatty fa/fa rats preventing their hypertrophy. In both dietary and genetically obese rodents, Aoyama et al. (Reference Aoyama, Fukui and Takamatsu5) have demonstrated that diets containing soya protein isolate and its hydrolysate reduce body fat content when compared with a casein diet. Moreover, it has been reported that Wistar rats fed soya protein in a high-fat diet gain less weight than those fed casein, partially due to an increase in the thermogenesis capacity of mitochondrial uncoupling protein-1(Reference Torre-Villalvazo, Tovar and Ramos-Barragán6). In normal Wistar rats fed a soya protein isolate, Nagasawa et al. (Reference Nagasawa, Fukui and Kojima7) have shown a decrease in the expression of adipose plasminogen activator inhibitor-1 and an increase in both the expression and plasma levels of adiponectin.
In rats in which stable dyslipidaemia, insulin resistance, moderate overweight and visceral adiposity developed by feeding them a sucrose-rich diet (SRD) for a long term (3–8 months), we have recently shown that the addition of dietary soya protein instead of casein normalised dyslipidaemia, reverts hepatic steatosis and substantially improves whole-body insulin sensitivity. Moreover, soya protein moderately decreases body-weight gain, limiting the accretion of visceral fat(Reference Oliva, Chicco and Lombardo8). In rats fed a SRD, in which casein was the source of protein, we have previously demonstrated that the hypertrophy of visceral adipose tissue was accompanied by both an alteration in adipocyte cell size distribution and an increase in the activities of several enzymes involved in de novo lipogenesis. In addition, adipocytes from the SRD-fed rats showed an increase in lipolysis and an impaired insulin-stimulated glucose uptake. Besides, a decrease in plasma levels and an increase in adipose tissue leptin storage without changes in their gene expression were observed(Reference Rossi, Lombardo and Chicco9–Reference Selenscig, Rossi and Chicco11). Interestingly, several of the metabolic abnormalities described in the SRD-fed rats are also present in the metabolic syndrome in human subjects.
The mechanisms whereby soya protein may exert its beneficial effects on visceral adiposity/overweight are not completely clear. Moreover, to the best of our knowledge, no study has been published focusing on the mechanisms by which soya protein improves overweight and visceral adiposity in SRD-fed rats. Given this information, we consider it worthwhile to assess whether or not the isoenergetic replacement of dietary casein by soya protein could be able to improve or even revert the morphological and metabolic abnormalities underlying the adipose tissue dysfunction in rats fed a long-term SRD. To test this hypothesis, the present study was designed to evaluate: (1) the number and volume of epididymal fat cells; (2) the activity of several enzymes involved in de novo lipogenesis; (3) in isolated adipocytes, basal lipolysis as an estimation of hormone-sensitive lipase and TAG lipase activities and the effect of insulin on lipolysis; (4) the protein mass expression of PPARγ, since some of the metabolic alterations that follow the hypertrophied fat cell growth in visceral adiposity/obesity are associated with the expression of this nuclear receptor(Reference Torres, Torre-Villalvazo and Tovar12); (5) the protein mass expression of the glucose transporter GLUT-4.
Materials and methods
Animals and diets
Male Wistar rats initially weighing 170–185 g and purchased from the National Institute of Pharmacology (Buenos Aires, Argentina) were maintained in the animal room under controlled temperature (22 ± 1°C), humidity and air flow conditions, with a fixed 12 h light–dark cycle (light 07.00–19.00 hours). They were initially fed a standard non-purified diet (Ralston Purina, St Louis, MO, USA). After 1 week of the acclimatisation period, they were randomly divided into two groups of rats (control and experimental) and were housed individually. The experimental group (n 48 rats) received a purified SRD containing by weight (g/100 g): 62·5 sucrose, 18 casein-free vitamins, 7 maize oil, 7·5 cellulose, 3·5 salt mixture (AIN-93M-MX), 1 vitamin mixture (AIN-93-VX), 0·2 choline chloride and 0·3 dl-methionine. The control group (n 24 rats) received the same purified diet but with sucrose replaced by maize starch (high-starch diet, control diet (CD)). Both groups received each diet for 4 months after which the SRD group of rats was randomly subdivided into two subgroups. The rats in the first subgroup continued on the SRD up to 8 months of feeding. The second subgroup, SRD with soya protein (SRD-S), received the SRD in which the source of protein (18 g casein/100 g) had been replaced by soya protein for the next 4 months. The control group was fed with the CD throughout the experimental period. In rats fed ad libitum a SRD for a long term (8–9 months), we have previously reported that after 4 months on the diet, the animals began to increase both food intake and body weight compared with age-matched controls fed a CD(Reference Oliva, Chicco and Lombardo8, Reference Rossi, Lombardo and Chicco9). Both parameters were significantly different at 6 months and remained so at least until 8–9 months of feeding the diet(Reference Oliva, Chicco and Lombardo8, Reference Rossi, Lombardo and Chicco9). A different picture emerged when, after 4 months on a SRD, casein was replaced by soya (SRD-S) as a source of dietary protein. In this group, body weight and the amount of food intake remained similar to those observed in the CD-fed group(Reference Oliva, Chicco and Lombardo8). Since in the above protocol the animals were fed ad libitum through the experimental period, there was a risk of uncontrollable bias associated with weight changes between the groups. Thus, in the present experimental design, both CD and SRD-S groups were offered the same amount of food, which was freely consumed daily by the SRD group throughout the feeding period. Details on the composition of the diets are given in Table 1. The preparation of the diets has been reported elsewhere(Reference Oliva, Chicco and Lombardo8). Diets were isoenergetic, providing approximately 16·3 kJ/g of food, and were prepared every week. The weight of each animal and the energy intake were recorded daily throughout the experimental time in all groups and subgroups of rats. At the end of the experimental period, food was removed at 07.00 hours (end of the dark period), and unless otherwise indicated, experiments were performed between 07.00 and 09.00 hours. At least six rats from the three dietary groups were used in each procedure. They were anaesthetised with intraperitoneal sodium pentobarbital (60 mg/kg body weight). Blood samples were obtained from the jugular vein and rapidly centrifuged. The plasma was either immediately assayed or stored at − 20°C. Epididymal adipose tissue was totally removed, weighed and immediately used for the preparation of isolated adipocytes as mentioned below, or frozen and stored at the temperature of liquid N2. Retroperitoneal adipose tissue was removed and weighed. The experimental protocol was approved by the Human and Animal Research Committee of the School of Biochemistry, University of Litoral, Santa Fe, Argentina.
Composition of the experimental diets (based on the AIN-93 diet)
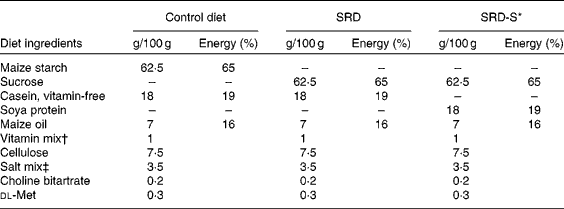
SRD, sucrose-rich diet; SRD-S, sucrose-rich diet with soya protein.
* Soya protein isolate (MP Biomedicals, Solon, OH, USA). Soya protein isolate composition (g/100 g): protein, 92·0; water, 6·0; ash, 4·1; fat, 0·8; fibre, 0·25; carbohydrate, 2·85; Ca, 0·15; P, 0·8; K, 0·05; Na, 1·3. Trypsin inhibitor, 4·0–7·3 mg/g.
† AIN-93-VX.
‡ AIN-93M-MX.
Analytical methods
Plasma TAG, NEFA and glucose levels were determined by spectrophotometric methods as previously described(Reference Chicco, Bernal and Soria13). Immunoreactive insulin was measured by the method proposed by Herbert et al. (Reference Herbert, Lau and Gottlierb14). The immunoreactive insulin assays were calibrated against rat insulin standard (Novo Nordisk, Copenhagen, Denmark). Plasma leptin was determined by an ELISA kit (Linco Research, St Charles, MO, USA).
Preparation of isolated adipocytes and determination of fat cell volume and number
Epididymal fat pads were removed, weighed and rinsed in isotonic saline solution at 37°C. Adipocytes were isolated according to the method of Rodbell with minor modifications as previously described(Reference Soria, D'Alessandro and Lombardo15). One fraction of washed cells was used for the determination of fat cell size and number as previously described(Reference Rossi, Lombardo and Lacorte10, Reference Soria, D'Alessandro and Lombardo15). The lipid weight of the average fat cell was calculated from mean cell volume assuming a lipid density of 0·95 (triolein density).
Determination of basal lipolysis
For the study of basal lipolysis, aliquots of diluted isolated epididymal fat cells (1 × 10⁵ cells/ml) were incubated in Krebs–Henseleit phosphate buffer (pH 7·0) containing 4 % of bovine serum albumin, essentially free of fatty acids, in a shaking Dubnoff water-bath (sixty cycles/min) at 37°C for 1 h under an atmosphere of 95 % O2–5 % CO2, as previously described(Reference Soria, D'Alessandro and Lombardo15). Under these conditions, there was a time-dependent increase in lipolysis for 60 min. Therefore, this time period was chosen for the incubation. Lipolysis was determined by measuring glycerol release over 1 h at 15 min intervals in aliquots of infranatant from each incubation mixture by the enzymatic method of Wieland(Reference Wieland and Bergmeyer16), as previously described(Reference Soria, D'Alessandro and Lombardo15).
Assay of the anti-lipolytic action of insulin
The anti-lipolytic action of insulin was performed in epididymal isolated adipocytes according to Soria et al. (Reference Soria, D'Alessandro and Lombardo15). Briefly, isoproterenol (10-7 m) and adenosine deaminase (1 U/ml) were added to the fat cell suspensions (1 × 10⁵ cells/ml), and incubations were conducted during 1 h at 37°C under an atmosphere of 95 % O2–5 % CO2, both in the absence or presence of insulin (purified porcine insulin; Novo Laboratory, Burien, WA, USA) at a final concentration of 2·0 nm. At the end of the incubation, three aliquots of the infranatant were removed from each incubation mixture, and the glycerol release was measured as described above. The anti-lipolytic action of insulin was expressed as the ratio of the value of insulin-inhibited lipolysis to that of isoproterenol-stimulated lipolysis in the absence of the hormone as a percentage.
Determination of tissue leptin content
Leptin content was determined in fresh epididymal adipose tissue samples according to Peyron-Caso et al. (Reference Peyron-Caso, Taverna and Guerre-Millo17), as previously described(Reference Selenscig, Rossi and Chicco11). Data are expressed as leptin concentration of epididymal adipose tissue as ng per total fat tissue weight.
Enzymatic activity assays
For the assay of acetyl-CoA carboxylase activity, the frozen fat pad (1 g) was homogenised with 3 vol. of phosphate–bicarbonate buffer (70 mm-KHCO3, 85 mm-K2HPO4, 9 mm-KH2PO4 and 1 mm-dithiothreitol (pH 7·0)). After centrifugation at 20 000 g, the fat cake was discarded, and the cytosolic fraction was obtained after centrifugation of the supernatant at 100 000 g for 1 h at 4°C. Acetyl-CoA carboxylase was measured by an NADH-linked assay(Reference Zimmermann, Haemmerle and Wagner18). The assay medium (56 mm-Tris–HCl (pH 8·0), 10 mm-MgCl2, 11 mm-EDTA, 4 mm-ATP, 52 mm-KHCO3, bovine serum albumin (0·75 mg/ml), 0·5 mm-NADH and 1·4 mm-phosphoenolpyruvate) was mixed with pyruvate kinase and lactate dehydrogenase (each 5·6 U/ml). The baseline was followed at 30°C until a constant slope was reached. For each 2·3 vol. of medium, 1 vol. of the activated homogenate was added, and the reaction was started with acetyl-CoA (final concentration 0·125 mm). For enzyme activation, 1 vol. of the homogenate was incubated with 1 vol. of activation buffer (20 mm-citrate, 100 mm-Tris–HCl (pH 8·0), bovine serum albumin (1·5 mg/ml), 20 mm-MgCl2 and 20 mm-GSH (pH 7·5)) for 15 min at 37°C. Fatty acid synthase activity was assayed on the cytosolic fraction of adipose tissue by measuring the malonyl-CoA-dependent oxidation of NADPH at 37°C, as previously described(Reference Rossi, Lombardo and Chicco9). Malic enzyme activity was measured in the aqueous supernatant fraction of adipose tissue samples by the spectrophotometric method of Wise & Ball(Reference Wise and Ball19). Adipose tissue glucose-6-phosphate dehydrogenase activity was measured according to Cohen et al. (Reference Cohen, Briller and Shafrir20), as described elsewhere(Reference Soria, Chicco and D'Alessandro21). Lipoprotein lipase (LPL) activity was analysed by the method of Martin Hidalgo et al. (Reference Martin Hidalgo, Hola and Belfrage22). Briefly, tissue samples were homogenised in 0·2 mm-hydroxymethyl aminomethane (Tris)–HCl, pH 8·2, at 4°C and delipidated with acetone–diethyl ether. LPL activity was assayed in triplicate in an assay medium containing triolein (5·7 μm), egg lecithin (0·3 mg/ml), bovine serum albumin (2 g%), Tris (pH 8·5) and 8 % heated rat serum in the absence or presence of 1 mm-NaCl (high salt). LPL activity was determined by subtracting non-LPL-dependent activity (high salt) from the total lipolytic activity. Enzyme activity was expressed as pmol of substrate transformed per second (pktal) per g of fresh tissue.
Carcass composition
Six rats from each dietary group were anaesthetised as mentioned above. The anaesthetised rats were shaved, and the visceral organs were removed. Carcasses were weighed, placed in plastic bags and frozen at − 20°C. Each frozen carcass was ground to a homogeneous mixture with a mill cooled with liquid N2, and the ground carcass was stored individually at − 20°C. Carcass water, ether-extractable fat and nitrogen determination as an estimation of protein content and ash content were performed in duplicate samples, as previously described(Reference Rossi, Lombardo and Lacorte10).
Western blot analysis of adipose tissue PPARγ
Frozen epididymal adipose tissue powder was homogenised as previously described(Reference Federice, Hribal and Perego23). Total protein samples (40 μg) were resolved on 10 % SDS-PAGE. Polyvinylidene fluoride-blocked membranes were incubated overnight with 1:400 specific polyclonal goat anti-PPARγ antibody (PPARγ; H-98; Santa Cruz Biotechnology, Inc., Santa Cruz, CA, USA) at 4°C, followed by anti-goat horseradish peroxidase-conjugated antibody (1:2000) at room temperature. PPARγ was visualised by chemiluminescent detection according to the manufacturer's instructions (Super Signal West Pico chemiluminescence substrate; Pierce Biotechnology, Rockford, IL, USA). The PPARγ expression was normalised to β-actin. The intensity of the bands was quantified by NIH imaging software. The correlation coefficient between the amount of protein (25–100 μg) and the enhanced chemiluminescence image intensity was 0·985. The relationship between the amount of sample subjected to immunoblotting and the signal intensity observed was linear under the conditions described above. The skeletal muscle tissue extract was employed as a PPARγ-positive control. Protein concentrations were quantified with the Bio-Rad Protein assay.
Western blot analysis of adipose tissue glucose transport (GLUT-4) at the start and at the end of the euglycaemic–hyperinsulinaemic clamp study
The euglycaemic–hyperinsulinaemic clamp technique as described earlier(Reference Oliva, Chicco and Lombardo8, Reference D'Alessandro, Lombardo and Chicco24) was used to analyse the adipose tissue GLUT-4 protein mass expression at the start (0 min) and at the end (120 min) of the clamp study. Immediately after the clamp, the rats were killed, and their epididymal adipose tissue was rapidly excised, cleaned of extraneous tissues and frozen in liquid N2. The adipose tissue was kept at − 80°C until further processing. GLUT-4 was measured according to Kamel et al. (Reference Kamel, Norgren and Strigård25). Briefly, approximately 1 g of adipose tissue was homogenised for 5 s in an ice-cold buffer (25 mm-HEPES, 250 mm-sucrose, 4 mm-EDTA, 0·2 mm-phenylmethylsulphonyl fluoride, 1 mm-leupeptin, aprotinin (1 U/ml) and 0·1 mm-sodium vanadate (pH 7·4)). Homogenates were centrifuged at 5000 g for 5 min at 4°C. To obtain the membrane fraction, the supernatant was centrifuged at 200 000 g for 90 min at 4°C. The pellet was dissolved in an ice-cold homogenisation buffer. Total protein samples (20 μg) were resolved on 10 % SDS-PAGE (Laemmli). Blocked membranes were incubated overnight with a 1:600 specific polyclonal goat anti-GLUT-4 antibody (GLUT-4, C-20; Santa Cruz Biotechnology, Inc, Santa Cruz, CA, USA) at 4°C, followed by an anti-goat horseradish peroxidase-conjugated antibody (1:2000) at room temperature. GLUT-4 was visualised by chemiluminescence detection as mentioned above. GLUT-4 expression was normalised to β-actin. The intensity of the bands was quantified by NIH imaging software. Preliminary studies showed linearity of Western blot assay from 15 to 100 μg of protein. The correlation coefficient between the amount of protein and the enhanced chemiluminescence image intensity was 0·97 for the GLUT-4 fraction. The relationship between the amount of the sample subjected to immunoblotting and the signal intensity observed was linear under the conditions described above. Protein concentrations were quantified with the Bio-Rad Protein assay.
Statistical analysis
Sample sizes were calculated on the basis of measurements previously made with rats fed either a CD or a SRD(Reference Rossi, Lombardo and Lacorte10, Reference Soria, D'Alessandro and Lombardo15, Reference Soria, Chicco and D'Alessandro21), considering an 80 % power. Data are expressed as means with their standard errors. Statistical comparisons were done transversely between different dietary groups. The statistical significance between groups was determined by one-way ANOVA, with one factor (diet) followed by the inspection of all differences between pairs of means by the Newman–Keuls test. Differences having P values lower than 0·05 were considered to be statistically significant(Reference Snedecor and Cochran26). In all cases, the interclass correlation coefficients were at least 0·73.
Results
Body-weight gain, energy intake, carcass weight and composition, adipose tissue cellularity and plasma metabolites and insulin levels
A comparable body-weight gain and energy intake were recorded in rats fed the CD or SRD during the first 4-month feeding period on their respective diets. The values were as follows: initial body weight was 184·0 (sem 5·4) g in rats fed a CD (n 24); 188·8 (sem 4·5) g in the SRD group (n 48). Body weight at 4 months was 422·0 (sem 0·8) g in rats fed a CD and 417·8 (sem 6·7) g in the SRD group. Energy intake initially to month 4 was 257·4 (sem 5·9) kJ/d in rats fed a CD and 255·0 (sem 6·3) kJ/d in the SRD group. From 4 to 8 months of the experimental period, rats fed a SRD showed a significant increase in body-weight gain and energy intake compared with both rats fed the CD and SRD in which soya protein replaced casein (SRD-S). Moreover, body-weight gain and energy intake were similar in both SRD-S- and CD-fed rats (Table 2). These data confirm a recent publication of our group(Reference Oliva, Chicco and Lombardo8).
(Mean values with their standard errors)

Mean values were significantly different from those of the CD and SRD-S: * P < 0·05, ** P < 0·01.
Mean values were significantly different from those of the CD: † P < 0·05.
‡ For details of procedures and diets, see Materials and methods section and Table 1.
§ n 24.
∥ n 6.
Rats fed a SRD during 8 months showed a significant increase in carcass weight and fat content with a decrease in water content when compared with the CD-fed group. Moreover, a significant reduction of both carcass weight and fat content and an increase in water content occurred when casein was replaced by soya protein from month 4 to 8 in the SRD group. However, values reached by the SRD-S group were still above those recorded in the age-matched control rats fed a CD (Table 2). Soya protein reduced the volume (hypertrophy) observed in adipocytes from the epididymal fat pad of the SRD-fed rats, although the values were still higher than those recorded in the CD-fed group. The values were as follows (six animals per group): cell volume was 275·2 (sem 16·6) pl in rats fed a CD; 851·5 (sem 13·3) pl in the SRD group and 552·8 (sem 11·2) pl in those fed the SRD-S (P < 0·001 SRD v. CD and SRD-S; P < 0·001 SRD-S v. CD). However, as shown in Table 2, there were no differences in total cell number when expressed as total fat pads in all dietary groups.
Plasma TAG, NEFA and glucose levels were higher in rats fed a SRD both at 4 months (data not shown) and at 8 months compared with age-matched control rats fed a starch diet. Moreover, when soya protein replaced casein from the last 4 months of the diet, a significant reversal of all parameters was observed, matching values to those of the control rats. At the end of the experimental period, no statistically significant differences in plasma insulin levels were recorded among all dietary groups (Table 2).
Fat pad weight and leptin content and plasma leptin levels
Table 3 shows a significant decrease in both the accretion of epididymal fat weight and leptin content when soya protein replaced casein as a dietary protein in the SRD-fed rats. However, these values were still significantly above those recorded in the CD-fed group. Besides, plasma leptin returned to the values recorded in age-matched controls fed a CD.
(Mean values with their standard errors, n 6)

Mean values were significantly different from those of the CD and SRD-S: ** P < 0·01, *** P < 0·001.
Mean values were significantly different from those of the CD: †† P < 0·01.
‡ For details of procedures and diets, see Materials and methods section and Table 1.
Glucose-6-phosphate dehydrogenase, fatty acid synthase, acetyl-CoA carboxylase, malic enzyme and lipoprotein lipase activities
As shown in Table 4, the activities of enzymes related to de novo lipogenesis were significantly increased in the epididymal fat pad of rats chronically fed a SRD compared with those fed a CD. A significant reduction of both glucose-6-phosphate dehydrogenase and fatty acid synthase activities was observed in the SRD-S group, which reached values similar to those recorded in the CD-fed rats. Moreover, the addition of soya protein significantly decreased malic enzyme and LPL activities, even though their values were still higher than those observed in the CD-fed rats. Besides, although no changes in acetyl-CoA carboxylase activity were observed when the enzyme was expressed as mU/mg of protein, a behaviour similar to that of the other enzymes was observed when the enzymatic activity was expressed as U/g of total fat (data not shown).
(Mean values with their standard errors, n 6)

Mean values were significantly different from those of the CD: * P < 0·05, ** P < 0·01, *** P < 0·001.
Mean values were significantly different from those of the SRD: † P < 0·05, †† P < 0·01.
Mean values were significantly different from those of the SRD-S: ‡ P < 0·05.
§ For details of procedures and diets, see Materials and methods section and Table 1.
Basal lipolysis and insulin-mediated inhibition of lipolysis of the fat cells
Table 5 shows the effect of dietary soya protein on basal lipolysis (as an estimation of both hormone-sensitive lipase and TAG lipase enzyme activities). It can be seen that the increased basal lipolysis observed in the enlarged epididymal fat cells of the SRD-fed rats was significantly decreased when dietary soya protein replaced casein in this group of animals during the last 4 months of treatment. In addition, the higher levels of plasma NEFA present in the rats on a SRD were completely normalised after soya protein administration. Animals fed on a SRD showed a decrease in adipocyte sensitivity to the anti-lipolytic action of insulin. The hormone was unable to inhibit β-agonist-stimulated lipolysis in the isolated epididymal fat cell as compared with the CD-fed rats. Moreover, the replacement of casein by dietary soya to the SRD completely restored the sensitivity of adipocyte to the anti-lipolytic action of insulin.
(Mean values with their standard errors, n 6)

Mean values were significantly different from those of the CD and the SRD-S: ** P < 0·01.
Mean values were significantly different from those of the CD: † P < 0·05.
‡ For details of procedures and diets, see Materials and methods section and Table 1.
§ The results are expressed as the ratio of the value of the insulin-inhibited lipolysis to that of the isoproterenol-stimulated lipolysis in the absence of insulin.
Protein mass expression of PPARγ
The immunoblotting of adipose tissue revealed a single 67 kDa band consistent with PPARγ. Each gel contained an equal number of samples from the CD, SRD and SRD-S group (Fig. 1(a)). After the densitometry of immunoblots, the PPARγ of the CD group was normalised to 100 %, and both SRD and SRD-S were expressed relative to this. Qualitative and quantitative analyses of Western blot showed that the relative abundance of PPARγ was significantly decreased in the epididymal fat pad of the SRD group when compared with rats fed a CD (Fig. 1(b)). Even though the replacement of casein with soya protein in the SRD during the last 4 months of the experimental period improved PPARγ protein mass expression, the values were still lower than those observed in the CD group.
Fat pad protein mass expression of PPARγ of rats fed a control diet (CD, ■), a sucrose-rich diet (SRD, ![]() ) or the SRD with soya protein (SRD-S, □). (a) Immunoblots of PPARγ of adipose tissue from the CD, SRD and SRD-S rats. Molecular marker is shown on the right. Lane 1, skeletal muscle tissue as a positive control; lane 2, CD; lane 3, SRD; lane 4, SRD-S. (b) Densitometric immunoblot analysis of PPARγ protein mass in adipose tissue of rats fed a CD, SRD or SRD-S. Values are means, with their standard errors represented by vertical bars (six animals per group), and expressed as percentage relative to the CD. ** Mean values were significantly different from those of the CD and SRD-S (P < 0·01). † Mean values were significantly different from those of the CD (P < 0·05).
) or the SRD with soya protein (SRD-S, □). (a) Immunoblots of PPARγ of adipose tissue from the CD, SRD and SRD-S rats. Molecular marker is shown on the right. Lane 1, skeletal muscle tissue as a positive control; lane 2, CD; lane 3, SRD; lane 4, SRD-S. (b) Densitometric immunoblot analysis of PPARγ protein mass in adipose tissue of rats fed a CD, SRD or SRD-S. Values are means, with their standard errors represented by vertical bars (six animals per group), and expressed as percentage relative to the CD. ** Mean values were significantly different from those of the CD and SRD-S (P < 0·01). † Mean values were significantly different from those of the CD (P < 0·05).

GLUT-4 protein mass expression of adipose tissue
The immunoblotting of adipose tissue revealed a single 45 kDa band consistent with GLUT-4. Each gel contained an equal number of samples from rats fed a CD, SRD and SRD-S at the start (0 min) and at the end (120 min) of the euglycaemic–hyperinsulinaemic clamp (Fig. 2(a)). After the densitometry of immunoblots, the GLUT-4 of the CD group at the start of the clamp was normalised to 100 %, and both SRD and SRD-S at the start as well as the three dietary groups at the end of the study were expressed relative to this. At the start of the clamp, the qualitative and quantitative analyses of Western blot showed no differences in the relative abundance of GLUT-4 between the three dietary groups. Under insulin stimulation (at the end of the clamp), the translocation to the plasma membrane of GLUT-4 protein mass expression significantly increased in rats fed either a CD or SRD-S, while no changes were observed in the SRD-fed group (Fig. 2(b)).
Fat pad protein mass expression of GLUT-4 at the start (0 min □) and under the insulin stimulation at the end (120 min ![]() ) of the clamp studies in rats fed a control diet (CD), a sucrose-rich diet (SRD) or the SRD with soya protein (SRD-S). (a) Immunoblot of GLUT-4 of adipose tissue from the CD, SRD and SRD-S. Molecular marker is shown on the right. Lane 1, CD 0 min; lane 2, CD 120 min; lane 3, SRD 0 min; lane 4, SRD 120 min; lane 5, SRD-S 0 min; lane 6, SRD-S 120 min. (b) Densitometric immunoblot analysis of GLUT-4 protein mass in adipose tissue of rats fed a CD, SRD or SRD-S at the start and at the end of clamp studies. Values are means, with their standard errors depicted by vertical bars (six animals per group), and expressed as percentage relative to the control diet at 0 min of the clamp. * Mean values were significantly different from those of the SRD rats at 120 min of the clamp v. CD and SRD-S rats at 120 min of the clamp (P < 0·05). † Mean values were significantly different from those of the CD and SRD-S rats at 120 min of the clamp v. CD and SRD-S rats at 0 min of the clamp (P < 0·05).
) of the clamp studies in rats fed a control diet (CD), a sucrose-rich diet (SRD) or the SRD with soya protein (SRD-S). (a) Immunoblot of GLUT-4 of adipose tissue from the CD, SRD and SRD-S. Molecular marker is shown on the right. Lane 1, CD 0 min; lane 2, CD 120 min; lane 3, SRD 0 min; lane 4, SRD 120 min; lane 5, SRD-S 0 min; lane 6, SRD-S 120 min. (b) Densitometric immunoblot analysis of GLUT-4 protein mass in adipose tissue of rats fed a CD, SRD or SRD-S at the start and at the end of clamp studies. Values are means, with their standard errors depicted by vertical bars (six animals per group), and expressed as percentage relative to the control diet at 0 min of the clamp. * Mean values were significantly different from those of the SRD rats at 120 min of the clamp v. CD and SRD-S rats at 120 min of the clamp (P < 0·05). † Mean values were significantly different from those of the CD and SRD-S rats at 120 min of the clamp v. CD and SRD-S rats at 0 min of the clamp (P < 0·05).

Discussion
Expanding our previous research(Reference Oliva, Chicco and Lombardo8), the present study provides new information concerning the cellular mechanisms behind the beneficial effects of dietary soya protein to improve and/or reverse the morphological and physiological abnormalities underlying the adipose tissue dysfunction, which develops in rats rendered dyslipidaemic and insulin resistant by chronically feeding a SRD.
The major new findings of the present study are the following: (1) soya protein markedly reduced body-weight gain, limited the accretion of visceral adiposity and improved adipose tissue cell volume without changes in total cell number. This was accompanied by a significant decrease in body fat content while maintaining body protein. (2) The relative abundance of PPARγ was significantly decreased in the hypertrophied visceral fat pad of the SRD-fed rats. Even though the presence of dietary soya protein in the SRD improved the protein mass expression of this nuclear receptor, the values reached were still lower than those recorded in the CD-fed rats. (3) Soya protein normalised and/or improved the activities of the enzymes involved in de novo lipogenesis in the adipose tissue of the SRD-fed rats. (4) The presence of dietary soya corrected the inhibitory effect of the high-sucrose diet upon the anti-lipolytic action of insulin, and significantly reduced the enhanced basal lipolysis. (5) The significant decrease in the protein mass expression of GLUT-4 recorded in the fat pad of the SRD-fed rats under the stimulus of insulin reached values similar to those of the CD group by shifting the source of dietary protein in the SRD from casein to soya during the last 4 months of the feeding period. Finally, dyslipidaemia, glucose homeostasis and plasma leptin returned to levels similar to those of the control group after soya protein administration.
A number of studies have suggested that the consumption of soya protein has favourable effects on obesity. Among them, it increases the thermogenesis capacity of uncoupling protein-1 that increases energy expenditure; it also increases triiodothyronine production, reduces food intake and increases satiety, which may reduce body fat and weight gain(Reference Velasquez and Bathena3, Reference Torre-Villalvazo, Tovar and Ramos-Barragán6, Reference Foltz, Ansems and Schwarz27, Reference Iritani, Hosomi and Fukuida28). Confirming previous results(Reference Oliva, Chicco and Lombardo8), the present data show that when soya replaces casein in the SRD during the last 4 months of the feeding period, the amount of food intake as well as body-weight gain are significantly lower than those recorded in the age-matched rats fed a SRD–casein. These effects are accompanied by a decrease in visceral adiposity and carcass fat contents.
Soya protein contains many bioactive compounds or nutrients that may have multiple mechanisms of action; therefore, in nutritional intervention trials, it is difficult to disentangle the effect of any one constituent on body-weight and food intake reduction. In this regard, some studies have reported that soya protein rich in isoflavones reduces fat pad mass(Reference Banz, Davis and Peterson29), while others showed no substantial differences in body weight and visceral fat by feeding rats soya protein diets in the presence or absence of added isoflavones(Reference Takahashi and Ide30). Besides, in animal models of obesity, soya protein decreases body weight and visceral fat(Reference Velasquez and Bathena3).
On the other hand, the gut endocrine system plays a major role in regulating ingestive behaviour, and a number of gut-derived hormonal signals have been characterised. Among them, cholecystokinin released from the duodenum is a physiological mediator that acts as a short-term satiety signal(Reference Badman and Flier31). The present results do not provide data concerning the mechanism(s) underlying the effect of dietary soya protein that leads to a reduction of food intake in the SRD-fed rats. However, some clues have been provided by recent publications. For instance, it has been shown that soyabean β-conglycinin – the main soybean protein – reduces food intake and gastric emptying by increasing cholecystokinin levels in rats(Reference Nishi, Hara and Tomita32). Nishi et al. (Reference Nishi, Hara and Asano33) showed that specific fragments of soya peptides rich in arginine residues have a strong food intake suppressor activity. Besides, soya protein digestion releases biologically active peptides that stimulate peripheral opioid and cholecystokinin-A receptors in rats(Reference Pupovac and Anderson34). It is possible that the mechanism(s) mentioned above are involved in the reduction of food intake contributing to the decrease in visceral adiposity and weight gain when soya protein replaces casein in rats chronically fed a SRD.
Recently, Rossi et al. (Reference Rossi, Lombardo and Chicco9) demonstrated that the long-term consumption of a high-sucrose diet induces adipocyte hypertrophy and dysfunction. Some of the metabolic alterations that follow the hypertrophic fat cell growth are associated with the expression of PPARγ. In this regard, Brun & Spiegelman(Reference Brun and Spiegelman35) showed that in adipocytes of both obese mice and human subjects, PPARγ mRNA contents were significantly decreased. Accordingly, the present study shows a significant reduction of PPARγ protein mass expression in the enlarged adipocytes from the epididymal fat pad of the SRD-fed rats. This may contribute to the impaired capacity of adipocytes to esterify fatty acids into TAG and therefore increase fatty acid release to the blood stream as shown by the increase in both plasmaNEFA levels and in vitro basal lipolysis.
On the other hand, our data show that in the SRD-S-fed rats, the protein mass expression of PPARγ, even though improved, was still lower compared with that of rats fed a CD. The effect of dietary soya protein upon the PPARγ expression in adipose tissue is controversial. Mezei et al. (Reference Mezei, Banz and Steger36) demonstrated that soya protein-associated isoflavone genistein was able to activate PPARγ in murine macrophage-like RAW 264.7 cells, resulting in an up-regulation of adipogenesis and probably fatty acid uptake from the plasma. Moreover, in Zucker diabetic fatty fa/fa rats fed a soya protein, adipose tissue PPARγ mRNA levels were significantly increased compared with those of rats fed casein(Reference Tovar, Torre-Villalvazo and Ochoa4). In contrast, Takahashi et al. (Reference Takahashi and Ide30), in the epididymal fat pad of rats fed with soya protein isolate either alone or in the presence of isoflavone, showed that PPARγ2 mRNA levels were not different from those recorded in rats fed casein, and Nagasawa et al. (Reference Nagasawa, Fukui and Kojima7) did not observe any changes in PPARγ mRNA levels in the fat pad of Wistar rats fed a soya protein isolate as compared with those fed casein.
Dietary soya protein in the SRD-fed rats significantly reduces adipose tissue de novo lipogenic rate (decreases fatty acid synthase, malic enzyme, glucose-6-phosphate dehydrogenase and acetyl-CoA carboxylase activities) as well as the LPL activity, which contributes to the reduction of adipocyte cell volume and consequently epididymal fat pad hypertrophy. Tovar et al. (Reference Tovar, Torre-Villalvazo and Ochoa4) recently demonstrated that the sterol regulatory element-binding protein-1 expression was lower in the epididymal adipose tissue of Zucker diabetic fatty fa/fa rats fed soya protein compared with that of Zucker diabetic fatty fa/fa rats fed casein, thus indicating a reduction of de novo lipogenesis reflected in a decrease in fat pad hypertrophy.
Additionally, rats fed a SRD showed an increase in both visceral adiposity and leptin store in the epididymal fat pad, together with a decrease in plasma leptin levels when compared with the CD-fed rats. These results are in agreement with a recent publication by Selenscig et al. (Reference Selenscig, Rossi and Chicco11), which suggests that enhanced lipolysis and altered insulin sensitivity could be involved in the decrease in leptin release in this dietary group. The present data show that by shifting the source of protein from casein to soya in the SRD group, plasma leptin returned to the values recorded in the CD group. Moreover, a significant decrease in leptin content within the adipose tissue correlated with the decrease in fat pad accretion.
The release of fatty acid from adipocytes depends on the rate of lipolysis mediated by hormone-sensitive lipase and TAG lipase activities. The activities of those enzymes on the lipid stored in adipocytes are restricted by the abundance of perilipins surrounding the lipid droplet membrane. We have previously reported an increase in basal lipolysis in the engorged dysfunctional adipocyte from SRD-fed rats(Reference Rossi, Lombardo and Chicco9). The present results show that the substitution of casein by soya protein decreases intracellular lipolysis. This is associated with a small adipocyte cell size, reduction of the fatty acids influx through the circulation and, therefore, normalising plasma NEFA levels. Torre-Villalvazo et al. (Reference Torre-Villalvazo, Tovar and Ramos-Barragán6) in rats fed either casein or soya protein in a low- or high-fat diet showed that in the adipose tissue of rats fed soya, perilipin expression was higher than in those fed casein, limiting the release of fatty acids. Besides, the administration of soya was able to reverse the impaired anti-lipolytic action of insulin present in the fat pad of rats fed a SRD. Together, these findings suggest that soya protein intake may limit adiposity at least in part by decreasing food intake as well as reducing the number of dysfunctional adipocytes, as a result of low lipogenesis and lipolysis. In addition, we have recently demonstrated(Reference Oliva, Chicco and Lombardo8) that soya protein reverts hepatic steatosis, and normalises VLDL-TAG secretion and dyslipidaemia in rats chronically fed a SRD. Since it is known that soya markedly decreases hepatic mRNA and the activities of lipogenic enzymes, it is likely that maintaining the number of functional adipocytes could also prevent the excessive transfer of fatty acids to other tissues (e.g. liver and muscle) decreasing its lipotoxicity.
The ultimate step involved in the activation of glucose transport by insulin in adipose cells is the translocation of GLUT-4 to the cell surface, namely the plasma membrane. We have recently demonstrated(Reference Rossi, Lombardo and Chicco9) an impairment of insulin-stimulated glucose uptake in isolated adipocytes from rats chronically fed a SRD. Accordingly, the present results show a complete abrogation of insulin-stimulated GLUT-4 translocation into the plasma membrane in the dysfunctional adipocytes of the SRD-fed rats. The present data are in line with previous results that showed a reduced adipose tissue insulin action and increased whole-body insulin resistance in this dietary group(Reference Rossi, Lombardo and Chicco9, Reference Rossi, Lombardo and Lacorte10). Shifting the source of dietary protein from casein to soya in the SRD group significantly increased the translocation of GLUT-4 protein mass expression under the stimulus of insulin, reaching values similar to those recorded in the CD group. Adipose tissue accounts for only a small fraction of total glucose disposal in the intact organism. However, we have recently demonstrated that under the same experimental conditions, soya protein reversed the impaired glucose homeostasis without changes in plasma insulin levels and significantly improved whole-body insulin resistance(Reference Oliva, Chicco and Lombardo8). Iritani et al. (Reference Iritani, Sugimoto and Fukuda37) showed an increased insulin receptor mRNA in the adipose tissue and liver and decreased insulin resistance in Wistar fatty rats fed a soya protein isolate v. casein. Recently, Cho et al. (Reference Cho, Lee and Banz38) showed in murine 3T3-L1 preadipocytes and C3H10T1/2 cells that both daidzein and its metabolite equol enhance insulin-stimulated glucose uptake by increasing the expression of GLUT-4 and insulin receptor substrate 1 possibly via the activation of PPARγ. Besides, Davis et al. (Reference Davis, Higginbotham and O'Connor39) demonstrated that dietary isoflavones increased GLUT-4 and PPARγ protein in the adipose tissue of diabetic Zucker fatty rats.
In brief, the present study provides new information about several mechanism(s) that could be involved in the beneficial effects of dietary soya protein to revert and/or improve the adipose tissue dysfunction of the dyslipidaemic insulin-resistant rat model. These results suggest that soya protein could maintain the functionality of the adipose tissue–liver axis by improving and/or reversing lipotoxicity. Moreover, the reduction of food intake by dietary soya could contribute by itself to some of the above-discussed effects. Finally, although care must be taken in extrapolating results from rats to humans, the dyslipidaemic rats fed dietary soya as a source of protein constitute a useful animal model to study the diet regulation of these metabolic abnormalities.
Acknowledgements
This investigation was carried out with the financial support of Agencia Nacional de Promoción Científica y Tecnológica, CONICET and UN Litoral Grants: PICTO 05-35670 BID 1728 OC/AR, PIP 5619/2005 and PIP 11220090100105/2010 and CAI+D 11/2006. M. E. O. was involved in the analysis of enzyme activities and GLUT-4 protein mass expression. D. S. was involved in the analysis of adipocyte cell size distribution and volume, leptin concentration, lipolysis and the anti-lipolytic action of insulin and PPARγ protein mass determination. M. E. D'. A. was involved in the analysis of carcass composition and analytical methods of TAG, NEFA, glucose and immunoreactive insulin. A. C. was involved in the analysis of the euglycaemic–hyperinsulinaemic clamp and contributed to the discussion of the manuscript. Y. B. L. wrote the manuscript and discussed it with the whole group of authors. There are no conflicts of interest among members of the group.


