

The role and function of the 20- and 22-carbon n-3 long-chain PUFA (n-3 LC-PUFA), EPA and DHA, respectively, have been studied extensively(Reference Swanson, Block and Mousa1–Reference Gutiérrez, Svahn and Johansson4). Although not newly discovered, knowledge about n-3 very-long-chain PUFA (n-3 VLC-PUFA), which have a chain length equal to or greater than twenty-four carbons and three to nine double bonds, is relatively limited. VLC-PUFA are primarily found in tissues that have high expression of the enzyme responsible for the condensation reaction (ELongase of Very Long chain fatty acids-4, ELOVL4) required for the synthesis of VLC-PUFA from shorter chain fatty acids(Reference Agbaga, Mandal and Anderson5–Reference Rotstein and Aveldaño10). In retina, brain and testis, the major products of ELOVL4 are n-3 and n-6 VLC-PUFA, whereas in skin, very-long-chain SFA (VLC-SFA) and very-long-chain MUFA (VLC-MUFA) are important products(Reference Agbaga, Mandal and Anderson5,Reference Aveldano, Robinson and Johnson8,Reference Rezanka11–Reference Cameron, Tong and Yang14) . Furthermore, VLC-PUFA appear in different lipid classes in different tissues, indicating tissue specificity. For instance, VLC-PUFA are mainly found in phospholipids (PL) in brain and retina(Reference Suh, Sauve and Merrells15), and in sphingomyelin and ceramides in testis(Reference Furland, Zanetti and Oresti13). The most abundant VLC-PUFA in the human brain are the n-6 fatty acids 34 : 4 n-6 and 34 : 5 n-6. In the brain, VLC-PUFA may be related to development, since the concentrations of VLC-PUFA vary during developmental stages and age(Reference Sharp, Johnson and Poulos16,Reference Mandal, Ambasudhan and Wong17) . The concentration of VLC-PUFA has been shown to be increased in younger brains during development and subsequently decline during older age. A similar trend is also seen in retinal and testicular tissues(Reference Agbaga, Mandal and Anderson5,Reference Furland, Zanetti and Oresti13,Reference Sharp, Johnson and Poulos16) .
The discovery of different mutations in the ELOVL4 gene causing different phenotypes in humans first sparked interest in further investigating these unique fatty acids(Reference Agbaga, Mandal and Anderson5,Reference Vasireddy, Wong and Ayyagari18) . In particular, studies into peroxisomal and retinal diseases associated with the biosynthesis or β-oxidation of VLC-PUFA have provided insight into some of the potential roles of VLC-PUFA in these specific tissues. The exact function(s) of VLC-PUFA in the retina is essentially unknown; however, numerous findings related to Stargardt macular dystrophy type 3 (STGD3) strongly suggest the requirement of VLC-PUFA for optimal visual functioning. ELOVL4 expression is highest in the retina, and heterozygous mutations in the ELOVL4 gene cause STGD3 in humans. It has been suggested that the pathology in the retina results from the loss of VLC-PUFA rather than VLC-SFA, since the ELOVL4 protein is required for the synthesis of both VLC-SFA and VLC-PUFA, but the only known phenotype in STGD3 is retinal degeneration(Reference Agbaga, Brush and Mandal6). Since no other abnormalities in other ELOVL4-expressing tissues have been reported or detected in these patients, this may suggest a specific role of VLC-PUFA in the retina. It is possible that the quantity required in the retina is much higher compared with other tissues, and consequently, retinal cells with a heterozygous mutation in ELOVL4 may not produce the required quantity of VLC-PUFA for optimal tissue function(Reference Agbaga, Mandal and Anderson5,Reference McMahon and Kedzierski19) . A study by Suh et al. showed that despite high DHA concentrations, VLC-PUFA were predominantly synthesised from EPA but not DHA in the rat retina(Reference Suh and Clandinin7). Cell culture models transduced with ELOVL4 later confirmed this finding that EPA is preferentially elongated over DHA to VLC-PUFA(Reference Agbaga, Brush and Mandal6,Reference Yu, Benham and Logan20) .
As with brain and retina, the role of VLC-PUFA in the mammalian testis is not known, but has been suggested to have an influence on the maintenance of spermatozoa membranes and spermatogenesis, as an inability to form VLC-PUFA in mice leads to non-functional spermatogenesis and depletion of VLC-PUFA in sperm leads to sterility(Reference Rabionet, van der Spoel and Chuang21,Reference Zadravec, Tvrdik and Guillou22) . Additionally, a recent study by Craig et al. revealed a positive correlation between sperm count and total motile count and VLC-PUFA levels, suggesting that VLC-PUFA are important for both sperm quality and quantity, further supporting the notion that the presence of these fatty acids is important for male fertility(Reference Craig, Brush and Sullivan23). It was also reported that ELOVL4 is necessary for skin barrier development and mouse survival, as mice lacking a functional ELOVL4 protein die perinatally from dehydration due to failure to develop normal epidermal lamellar body content as well as normal stratum corneum lamellar membranes, which are essential for permeability barrier function. This further highlights the importance of these VLC fatty acids in skin tissue(Reference Cameron, Tong and Yang14,Reference Vasireddy, Uchida and Salem24) .
Based on the available literature to date, the presence of VLC-PUFA is believed to be unique to retina, skin, brain, testes and spermatozoa, in which high ELOVL4 expression has been established(Reference Agbaga, Mandal and Anderson5). However, advances in detection methodologies could reveal their presence in other tissues, since the small quantities found in mammalian tissues have made them difficult to isolate and analyse. Another reason that these fatty acids have not been well investigated could be because of their unusually long hydrocarbon chains with three to nine double bonds, which makes them highly prone to oxidative damage.
Studies have only recently begun to gather information concerning the full biological functions of VLC-PUFA. Further studies are required to determine the specific roles and functions of these unique fatty acids in the prevention and relief of VLC-PUFA-related diseases. Unlike LC-PUFA, it is thought that VLC-PUFA are not obtained from ordinary dietary sources; therefore, they must be synthesised in situ from shorter fatty acid precursors(Reference Bennett and Anderson25). There are limited studies comparing the effects of supplementing VLC-PUFA in the diet. However, it is of interest to explore these fatty acids, as it could help enhance our understanding of their biological functions, where they are incorporated and whether they have potential for therapeutic treatment in conditions that have been linked to deficiency and impaired metabolism of VLC-PUFA, particularly if they can be provided via the diet. To our knowledge, no other studies have demonstrated the bio-availability and deposition of VLC-PUFA from the diet in different organs and tissues. Therefore, the main purpose of the present study was to determine whether dietary VLC-PUFA can be deposited in target tissues of three different model species using feeding trials with FO and FO concentrates containing low and high levels of these fatty acids, respectively.
Materials and methods
Rat feeding trial
Animals and housing rat trial
A rat feeding trial was conducted to test whether increasing dietary levels of FO would affect tissue n-3 VLC-PUFA composition. Male Zucker fa/fa rats (Crl:ZUC(Orl)-Lepr fa, from Charles River Laboratories) were randomly assigned to three experimental groups, with six rats of comparable mean body weight per group. The rats were housed in pairs in individually ventilated cages (IVC type 4, blue line from Techniplast) in a room maintained with a 12-h light–12-h dark cycle (light from 07.00 to 19.00 hours), a constant temperature of 20 (sem 3) °C and a relative humidity of 65 (sem 15) %. The rats were acclimatised under these conditions prior to starting the experiments. The intervention period started when the rats were 11–14 weeks old and weighed 426 (sem 16) g and was conducted at the University of Bergen’s (Norway) research facilities.
Feeding and experimental diets rat trial
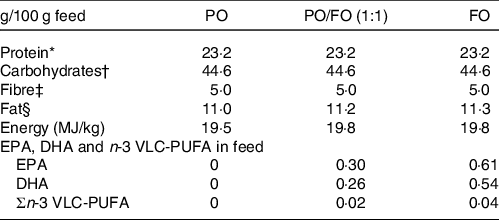
The rats were fed a modified, semi-purified experimental diet based on AIN-93G, except for the lipid amount and type, as follows: plant oil (PO), FO or a 1:1 PO/FO mix. The PO was a Camelina oil, while the FO was a Sandeel oil. A detailed description of all feed ingredients is presented in online Supplementary Table S1. The macronutrient and EPA, DHA and n-3 VLC-PUFA content of the different diet groups are presented in Table 1. The main differences were the n-3 fatty acid content of the diets. EPA and DHA compositions were both 0 g/100 g feed in the PO diet, while they were 0·30 and 0·26 g/100 g feed, respectively, in the PO/FO diet, and 0·61 and 0·54 g/100 g feed, respectively, in the FO diet. Fatty acid composition of the different diet groups is presented in online Supplementary Table S2. The rats were fed one of the diets for 4 weeks and weighed weekly during the intervention period. The rats tolerated the feed well, and there were no significant differences in how the different diets were consumed or the average body weight of the rats at termination.
Macronutrient composition and content of EPA, DHA and n-3 very-long-chain PUFA (VLC-PUFA) of rat diets containing either plant oil (PO), a mix of plant oil and fish oil (PO/FO) or fish oil (FO)
* Sigma-Aldrich.
† Dyets Inc.
‡ Dyets Inc.
§ Vedde AS, Norsk Matraps at Askim Frukt og Bærpresseri.
Sampling and sample preparation rat trial
The rats were euthanised while under anaesthesia using Isofluran (Isoba vet, Intervet, Schering-Plough Animal Health) mixed with nitrous oxide and oxygen at the end of the 4-week intervention period. This was conducted under non-fasting conditions and with free access to feed and tap water. Brain, skin and eyes were excised and weighed prior to storing at −80°C for later lipid analysis. Four individual organ samples were analysed from the FO group, while three individual organ samples were analysed from each of the PO and PO/FO groups.
Preparation of n-3 very-long-chain-PUFA concentrate for Atlantic salmon and mouse trials
VLC-PUFA have twenty-four or more carbons in their chain and three to nine double bonds. Typical chain lengths and the number of double bonds of n-3 VLC-PUFA in FO are 24 : 5–6, 26 : 4–7, 27 : 4–8 and 30 : 5–6. To date, no previous studies have reported the concentration of n-3 VLC-PUFA in FO. Breivik & Svensen were the first to report a method of concentrating VLC-PUFA from FO and use it to make natural extracted test material available for biological studies(Reference Svensen and Breivik26). Epax Norway AS provided the n-3 VLC-PUFA concentrates used in the feeding trials in the present study. Briefly, the n-3 VLC-PUFA concentrate, which will be referred to as the VLC-Conc, was made from an anchovy FO distillation fraction by hydrolysis, precipitation with LiOH and distillation(Reference Svensen and Breivik26). The oil was transformed to TAG before being used in the feeding trial.
Atlantic salmon feeding trial
Feeding and experimental diets Atlantic salmon trial
A 4-week feeding trial with Atlantic salmon, Salmo Breed strain, with an initial weight of approximately 6 g, was conducted in freshwater in 0·5-m diameter circular conical bottomed tanks at the Nofima fish research facilities at Sunndalsøra, Norway, from November to December 2018. Continuous feeding was maintained using automatic belt feeders and continuous light over each tank. Temperature was measured daily, with an average water temperature of 12·0°C (minimum 10·7°C, maximum 12·6°C). Oxygen levels were measured once a week, and the minimum and maximum oxygen levels measured during the trial were 87 % and 93·4 % saturation, respectively. The fish was weighed in bulk and counted at the beginning and end of the trial.
The feed was produced by Nofima Feed Technology Centre in Bergen and shipped to Sunndalsøra prior to the start of the study. The basal diet consisted of 50 % fishmeal and 10 % each of wheat, wheat gluten and soya meal concentrate, in addition to minerals and vitamin mixture. A detailed description of all feed ingredients is presented in online Supplementary Table S3. Five different experimental diets were tested, with triplicate tanks per diet group and 100 fish per tank. The diets were isoenergetic and contained 50 % protein and 20 % lipid. The five different experimental diets had increasing levels (0 %–10 % of VLC-Cons in the feed), while EPA and DHA levels were kept constant. The amount of FO was reduced from 13 % to 0 % as the VLC-Conc and rapeseed oil inclusion level increased. The composition of the basal diet was identical for all groups, except for the fatty acid composition of the coating of the basal diet. A description of the macronutrient composition and EPA, DHA and n-3 VLC-PUFA content of the different diet groups is presented in Table 3. Fatty acid composition of the salmon feed is presented in online Supplementary Table S4.
EPA, DPA, DHA, n-3 very-long-chain PUFA (VLC-PUFA) and very-long-chain MUFA (VLC-MUFA) content in VLC-Conc*

* Analytical methods used detects fatty acids ≤ C28.
Macronutrient composition and content of EPA, DHA and n-3 very-long-chain PUFA (VLC-PUFA) of salmon diets with 0 % to 10 % VLC-concentrate (VLC-Conc) (Percentages)

* Vedde AS and Agrokorn.
† Vedde AS, Nuseed US and Epax Norway AS.
‡ Norgesmøllene AS.
Sampling and sample preparation Atlantic salmon trial
The fish grew from approximately 6 g (sem 0·1) (P = 0·6) to a final weight of 11 g (sem 0·2) (P = 0·16) on the five diets. There were no significant differences in growth between the dietary groups. Final sampling was conducted after 4 weeks of feeding the experimental diets. After bulk weighing of all fish in each tank, ten salmon were randomly collected from each tank and euthanised by overdose of the anaesthetic, metacain (MS-222; 0·05–0·08 g/l). Brain, skin, eye, liver and heart samples were subsequently excised and frozen in liquid N2 before storing the samples at −80°C until later analysis of lipid composition. Thus, three pooled samples of ten individual organ/tissue samples (ten fish from each tank, thirty fish in total) were analysed per diet group.
Mouse feeding trial
Animals and housing mouse trial
Thirty male C57/bl6 mice (Charles River Laboratories) were randomly assigned to three different experimental groups, consisting of ten mice per group. The time point for termination was 4·5 weeks. The animals were acclimatised for 7 d before the first dose. The animal room temperature was 20 (sem 1) °C, relative humidity was kept at 40–70 % and there were 60–70 air changes per hour. The mouse cages were enriched with aspen wood chew sticks (Tapvei), nesting materials were nestlets (CS3A01, Scanbur), aspen wood wool (Tapvei) and paper houses (Mouse smart homes, CS3CSSH, Scanbur). The light–dark cycle was 12 h of daylight, 12 h dark, with 20 min each of dawn and twilight.
Feeding and experimental diets mouse trial
The feeding trial was conducted at the Research Institute of Sweden in Gothenburg. The diet formulation was a standard feed base in which sucrose was replaced with starch, together with an altered fat content (modified 58Y2). All diets contained 10 % fat, 17 % protein, 5 % fibre and 62 % carbohydrate, as well as minerals and vitamins. In the test diets, 50 % of the total fat in the standard feed base was replaced with experimental oils. Mice were assigned to three dietary groups: one control group fed the standard feed base supplemented with PO (Ctr-PO), one control group fed the standard feed base supplemented with FO (Ctr-FO) and one experimental group fed the standard feed base supplemented with the n-3 VLC-PUFA concentrate (VLC-Conc). Estimated macronutrient composition and EPA, DHA and n-3 VLC-PUFA content of the different diet groups are presented in Table 4. A detailed description of feed ingredients is presented in online Supplementary Table S5, and fatty acid composition of feed is presented in online Supplementary Table S6. There were no significant differences in food consumption and body weight change over the course of the feeding trial between the control groups. However, the VLC-Conc group showed a lower food consumption and body weight change compared with the other groups.
Macronutrient composition and content of EPA, DHA and n-3 very-long-chain PUFA (VLC-PUFA) content of mouse diets* containing plant oil (Ctr-PO), fish oil (Ctr-FO) or VLC-concentrate (VLC-Conc)

* Diet provided by TestDiets. A detailed description of diet ingredients is presented in online Supplementary Table S5.
The feed was thawed in a food hopper and given ad libitum. The feed was changed twice weekly, and food consumption was recorded during weeks 1 and 3 of the study. The feed was weighed with the food hopper and left for the animals for 4–7 consecutive days, then the food hopper with the feed was weighed again and food consumption/day per mouse was estimated. The mice were checked daily for clinical observations, and only adverse events were noted. All animals were weighed on the first day of the study, weekly throughout the study and on the termination day. There were no outstanding differences in the observations between the different diet groups.
Sampling and sample preparation mouse trial
The animals were anaesthetised using isoflurane followed by exsanguination from the heart by blood sampling after cutting the vena cava, and the following tissues were excised: brain, testicles, skin, eyes, liver and heart. The tissues were weighed and placed into cryotubes (1·0 ml Thermo Scientific, ref. 375418, lot 8146693). The tubes were snap-frozen in liquid N2 and stored at −80°C until the samples were analysed for lipid composition. Five individual organ samples were analysed per diet group.
Sample preparation and fatty acid composition analyses of tissues and feeds
Total lipids were extracted from homogenised organs/tissues and feed (pooled samples for salmon) using the method previously described by Folch et al. (Reference Folch, Lees and Sloane Stanley27). To determine the lipid class composition of the organ/tissues, the lipid extract was evaporated under N2 gas, and the residual lipid extract was redissolved in hexane (Merck). Thin-layer chromatography plates (Watman K6 – Silica Gel 60 Å, 0·25-mm film thickness, 20 × 20 cm) were preconditioned in methanol in a separation chamber under a fume hood and dried at 120°C for 20 min. Lipid fractions were then applied to the plates for migration using a Pasteur pipette and placed in a thin-layer chromatography separation chamber. PL and TAG were separated by thin-layer chromatography using a mixture of petroleum ether, diethyl ether and acetic acid (113:20:2, v/v/v) as the mobile phase. Plates were dried in a fume hood, sprayed with 2 % 2-7-dichlorofluorescein in ethanol and dried again. UV light (366 nm) was used to detect the lipid classes, as they appear as yellow spots when placed under UV light. Spots were marked while under the UV light, then the plates were brought back to the fume hood and the lipid classes were identified by comparing with known standards (Sigma Chemical Co.). The marked areas corresponding to the PL and TAG fractions were scraped and transferred into glass tubes, capped and mixed using a vortex mixer, frozen overnight at −40°C and then trans-methylated. The fatty acid composition of the separated lipid groups and total lipid fraction of feeds were analysed using the method described by Mason & Waller(Reference Mason and Waller28). In brief, the extract was trans-methylated overnight using 2′,2′-dimethoxypropane, methanolic HCl and benzene at room temperature. To determine the total fatty acid composition of the PL and TAG fractions, the methyl esters were separated and analysed in a GC (Hewlett Packard 6890; HP) with a split injector, using an SGE BPX70 capillary column (length 60 m, internal diameter 0·25 mm and film thickness 0·25 μm; SGE Analytical Science), flame ionisation detector and HP Chem Station software. He was used as the carrier gas, and both the injector and detector temperatures were 280°C. The oven temperature started at 50°C for 1·2 min and was then raised to 170°C at a rate of 4°C/min, then to 200°C at a rate of 0·5°C/min and finally to 280°C at a rate of 10°C/min. Well-characterised standards were used to identify the individual fatty acid peaks by comparing the retention times to validated standards. The absolute amount of fatty acid per gram of tissue was calculated using 23:0 methyl ester as an internal standard. Unidentified peaks were not included in the calculation of total fatty acids.
Analyses of n-3 very-long-chain-PUFA
Fatty acid methyl esters of the n-3 VLC-PUFA were analysed at the R&D laboratory of Epax Norway AS. The n-3 VLC-PUFA were identified by GC–MS. The molecular ion was identified using chemical ionisation and then used to calculate the number of carbons and double bounds. Identification of n-3 fatty acids was performed using the ratio of ions at m/z 108 and 150. Ions at 108 m/z are characteristic of n-3 fatty acids, whereas ions at m/z 150 are characteristic of n-6 fatty acids(Reference Brauner, Budzikiewicz and Boland29–Reference Mjøs31). The fatty acid analysis of the FO, concentrates and extracts from rat tissues was performed on a Scion 436-GC with a split/splitless injector (splitless 1 min), using a Restek Rxi-5ms capillary column (length 30 m, internal diameter 0·25 mm and film thickness 0·25 mm), flame ionisation detector and TotalChrom Software. H2 was used as the carrier gas, with split-injection and detector temperatures of 250°C and 270°C, respectively. The oven temperature started at 90°C for 1·0 min, then ramped up to 200°C at a rate of 45°C/min, then to 280°C at a rate of 2·5°C/min and finally to 340°C at a rate of 10°C/min. The amount of fatty acids was calculated using 23:0 as internal standard.
The fatty acid composition of lipid Folch extracts of tissues from salmon and mice was analysed on a PerkinElmer, Clarius 680/600T GC–MS with split/splitless injector (splitless 1 min), using an Agilent CP Wax 52 B (CP7713) column (length 25 m, internal diameter 0·25 mm and film thickness 0·20µm). The oven temperature started at 90°C for 2 min and was then ramped up to 190°C at a rate of 30°C/min, then raised to 225°C at a rate of 3·0°C/min and finally to 240°C at a rate of 5·0°C/min and held at this temperature for 30 min.
The sum of the peak area from the chromatogram of three single ion scans (SIM of 67, 79 and 91 m/z) was used for quantification of the n-3 LC-PUFA and n-3 VLC-PUFA. The response factor for DHA (relative to 23:0) was calculated using standard solutions with known concentrations of DHA and 23:0. As no standards are available for the VLC-PUFA, the same response factor as for DHA was assumed and used to calculate mg of fatty acid/g of tissue for the n-3 VLC-PUFA.
Statistics
Data are presented as mean values and standard error of mean. For the rat feeding trial, four individual organ samples were analysed from the FO diet group, while three individual organ samples were analysed from each of the PO/FO and PO diet groups. For the salmon feeding trial, data were collected from three replicate tanks (three tanks of ten fish per dietary group, giving a total of thirty fish per dietary group), whereas the mouse feeding trial included analysis of five individual organ samples per diet group. The exceptions were the TAG fraction from mouse testis, in which only four individual samples per diet group were analysed, and mouse eye tissue, in which eight individual organ samples from the Ctr-PO and nine from both the Ctr-PO and VLC-Conc groups were analysed. Additionally, for the TAG fraction from mouse heart, only four samples were analysed for the Ctr-PO and VLC-Conc groups. Data from the rat and mouse feeding trials were analysed using one-way ANOVA, as well as salmon data on liver and heart tissues, and significant differences were set to P < 0·05 and ranked according to Tukey–Kramer test. For the salmon feeding trial, tank values were used as experimental units and linear regression models were used to evaluate the relationship between fatty acid tissue content and n-3 VLC-PUFA level in the feed, based on average per tank, with the significance level set to P < 0·05. JMP Pro 13.1.0 (SAS Institute Inc., 1989–2019) and Microsoft Office Excel software were used for the statistical analyses.
Multivariate principal component analysis was performed for each data matrix of the relative fatty acid compositions using the software Unscrambler X, version 10.3 (CAMO). The data were weighted using a standard deviation weighting process. Score plots from the PCA were used to explore the main trends and groupings in the data set, and their respective correlation loadings revealed which n-3 VLC-PUFA contributed to the sample groupings.
Ethical approval
The rat experiment was conducted at the University of Bergen in accordance with the Norwegian regulation on animal experimentation (approval no 11603). The protocol was approved by the Norwegian State Board of Biological Experiments with Living Animals. The feeding trial using Atlantic salmon was conducted at Nofima Sunndalsøra Research Station and was conducted in compliance with the Norwegian national regulation for use of experimental animals (NARA, FOR-2015-06-18-761) and classified as not requiring a specific license (§2-f, corresponding to Directive 2010/63/EU Article 1, section 5f), since the experimental treatments were not expected to cause any distress or discomfort to the fish. All procedures related to the treatment and holding of animals used in the animal experiment on mice performed at the Research Institute of Sweden in Gothenburg were approved by the local animal ethics committee (Gothenburg region) under the rules of Swedish legislation (2066–2019).
Results
n-3 Very-long-chain-PUFA content of naturally occurring fish oils and n-3 very-long-chain-PUFA concentrate
Analysis of random samples of some naturally occurring FO showed that n-3 VLC-PUFA were present in low quantities, as these fatty acids make up <1 % of the total fatty acids present (0·36–0·87 %). The FO analysed were anchovy/sardine oil from South America, mackerel, herring, blue whiting and capelin oil from Norway, and Pollock oil from North America. Anchovy/sardine and mackerel were among the FO with the highest natural content of n-3 VLC-PUFA (0·81 and 0·87 % of total fatty acids, respectively), while capelin had the lowest (0·36 %). The n-3 VLC-PUFA concentrate (VLC-Conc) produced from anchovy FO had a n-3 VLC-PUFA content of 40 g/100 g oil compared with 2·2 g/100 g oil in total of the n-3 LC-PUFA EPA, DPA and DHA (Table 2).
Results of the rat feeding trial
Total n-3 very-long-chain-PUFA in brain, eye and skin of rats fed two dietary levels of natural fish oil compared with plant oil
The main objective of this trial was to determine whether dietary natural FO would influence tissue n-3 VLC-PUFA composition of rat organs. The PL fatty acid compositions of skin, eye and brain tissues from rat were generally unaffected by their dietary composition. Total n-3 VLC-PUFA accounted for 1–2 % of total fatty acids, irrespective of the dietary group. There was a tendency towards increased EPA and DHA content in all tissues analysed in the rats that received the FO diet. However, due to large individual differences between the animals, there were no significant differences between the groups. Increasing the dietary level of FO did not lead to significant differences in proportional n-3 VLC-PUFA content in PL of brain, eye or skin, although there was a tendency towards increased levels of n-3 VLC-PUFA in rats fed the 1:1 mix of PO/FO (Table 5). However, based on these results, it was not possible to conclude whether the n-3 VLC-PUFA in the PL of the organs were derived from the FO in the diets or endogenously produced from EPA and DHA by the tissues, in particular since only the sum and not individual n-3 VLC-PUFA was determined in this trial.
Dietary effects on the level of main fatty acid classes in phospholipid (PL) of different rat tissues, presented as percentage of total fatty acids in the eye, skin and brain PL of rats fed three different diets: plant oil (PO), plant oil/fish oil 1:1 mix (PO/FO) or fish oil (FO)*
(Mean values with their standard errors, where each value originates from three rats for the PO and PO/FO groups and four rats for the FO group)

* Data were analysed by one-way ANOVA, and between-group differences were analysed by Tukey–Kramer test. P values ≤ values y–Kramestatistical significance
Results of the salmon feeding trial
n-3 Very-long-chain-PUFA composition of the phospholipid fraction from skin, eye and brain tissues of salmon fed increasing dietary levels of very-long-chain-Cons in feed
The main objective of this trial was to determine whether changes in tissue n-3 VLC-PUFA composition of organs are due to the diet content of these fatty acids or endogenous synthesis from EPA and DHA. A salmon feeding trial was therefore conducted where dietary levels of n-3 VLC-PUFA increased, while dietary EPA and DHA levels were kept constant. Juvenile Atlantic salmon was used as a model due to its high growth rate and the high influence of dietary fatty acids on organ fatty acid composition.
In the PL fraction from salmon skin, eye and brain, there were, as expected due to study design, no differences in the levels of EPA, DHA and DPA among the dietary groups. The only exception was DPA in salmon skin, which had a significant linear increase with increasing VLC-Conc in the feed (Figs. 1–3). Among the n-3 VLC-PUFA, however, several had a significant linear increase in these tissues as VLC-Conc increased in the feed. 28 : 8 was significant in both skin, eye and brain, while 26 : 6 was significant in skin and eye, but not brain tissue. The same trend as for 26 : 6 was seen for 24 : 5, although this did not reach statistical significance in eye (P = 0·0525). 24 : 6 was not affected by diet in eye tissue, but in skin tissue, 24 : 6 increased significantly with increasing VLC-Conc in the feed, whereas in brain, this fatty acid decreased significantly with increasing VLC-Conc levels in the feed. 26 : 5 and 26 : 7, which were only detected in eye and skin tissues, respectively, also increased significantly with increasing VLC-Conc in the feed. Quantitatively, the highest n-3 VLC-PUFA concentrations depending on tissues were seen for 24 : 5, 24 : 6, 26 : 6 and 28 : 8, the same as the main n-3 VLC-PUFA in the concentrate, and thereby these results strongly indicate that these fatty acids originate from the diet.
Dietary effects on the levels of different fatty acids in salmon skin phospholipid (PL). Fatty acid composition (presented as µg/g tissue) in the PL fraction from skin from salmon fed increasing levels of very-long-chain PUFA (VLC-PUFA) using five different diets: 0 %, 2·5 % and 5 % the experimental diet with n-3 VLC-PUFA-concentrate (VLC-Conc) (n 3 per diet group) and 7·5 % and 10 % VLC-Conc (n 2 per diet group). Each replicate value originated from a pooled sample from ten fish. Linear regression model showed a significant difference (P < 0·05) between diet groups for the n-3 VLC-PUFA 24 : 5, 24 : 6, 26 : 6, 26 : 7 and 28 : 8, with a linear increase with increasing levels of VLC-Conc in the feed.

Dietary effects on the level of different fatty acids in salmon eye phospholipid (PL). Fatty acid composition (presented as µg/g tissue) in the PL fraction from eye tissue from salmon fed increasing levels of very-long-chain PUFA (VLC-PUFA) using five different diets: 0 %, 2·5 % and 5 % the experimental diet with n-3 VLC-PUFA-concentrate (VLC-Conc) (n 3 per diet group) and 7·5 % and 10 % VLC-Conc (n 2 per diet group). Each replicate value originated from a pooled sample from ten fish. Linear regression model showed a significant difference (P < 0·05) between diet groups for the n-3 VLC-PUFA 26 : 5, 26 : 6 and 28 : 8, with a linear increase with increasing levels of VLC-Conc in the feed.

Dietary effects on the level of different fatty acids in salmon brain phospholipid (PL). Fatty acid composition (presented as µg/g tissue) in the PL fraction from brain from salmon fed increasing levels of very-long-chain PUFA (VLC-PUFA) using five different diets: 0 %, 2·5 %, 5 %, 7·5 % and 10 % the experimental diet with n-3 VLC-PUFA-concentrate (VLC-Conc) (n 3 per diet group). Each replicate value originated from a pooled sample from ten fish. Linear regression analysis showed a significant (P < 0·05) increase in 28 : 8 and decrease in 24 : 6 with increasing levels of VLC-Conc in the feed.

n-3 Very-long-chain--PUFA composition of phospholipid and TAG fractions of liver and heart tissues of salmon fed increasing levels of very-long-chain-Cons in feed
Liver and heart tissues have not previously been shown to contain VLC-PUFA as these tissues have no known ELOVL4 expression(Reference Agbaga, Mandal and Anderson5,Reference Mandal, Ambasudhan and Wong17,Reference Vasireddy, Uchida and Salem24,Reference Agbaga, Logan and Brush32) . However, since dietary lipids are known to be transported broadly from intestine to liver and heart, these tissues were also analysed for PL and TAG n-3 VLC-PUFA content.
In the PL fraction from salmon liver and heart, there was a significant increase in the n-3 VLC-PUFA 24 : 5, 26 : 4, 26 : 5, 26 : 6, 26 : 7, 28 : 5, 28 : 6 and 28 : 8, all of which increased with increasing levels of the VLC-Conc in the feed (Tables 6 and 7). Unique for salmon liver was the increase also seen in 24 : 6. There were quantitatively highest levels of 28 : 8 in both tissues, followed by 26 : 6 and 24 : 5 in liver (Table 6), and 24 : 5 and 24 : 6 in heart, although 24 : 6 showed no significant difference between the different diet groups (Table 7).
Dietary effects on the level of different fatty acids in salmon liver phospholipid (PL) and TAG*
(Mean values with their standard errors)

* Fatty acid composition (presented as µg/g tissue) in the PL and TAG fraction from liver of salmon fed increasing levels of n-3 very-long-chain PUFA (VLC-PUFA)-concentrate (VLC-Conc) (Data were analysed by one-way ANOVA and are shown as mean values using tank as a statistical unit (n 3) and standard errors of the mean). P values ≤ 0·05 indicate statistical significance. The dietary groups are named according to the percentage of VLC-PUFA in the feed. Each replicate value originates from a pooled organ sample from ten fish
Dietary effects on the level of different fatty acids in salmon heart phospholipid (PL) and TAG*
(Mean values with their standard errors)

* Fatty acid composition (presented as µg/g tissue) in the PL and TAG fraction from heart of salmon fed increasing levels of n-3 very-long-chain PUFA (VLC-PUFA)-concentrate (VLC-Conc) (Data were analysed by one-way ANOVA and are shown as mean values using tank as a statistical unit (n 3) and standard errors of the mean). P values ≤ values standard errors of the meanmean. The dietary groups are named according to the percentage of VLC-PUFA in the feed. Each replicate value originates from a pooled organ sample from ten fish.
In the TAG fraction, there was a significant increase in the n-3 VLC-PUFA 26 : 4, 26 : 5, 26 : 6, 26 : 7, 28 : 5 and 28 : 6 in liver (Table 6), while 26 : 7, 28 : 7 and 28 : 8 were significantly different in heart (Table 7). All had a linear increase with increasing VLC-Conc in the feed, except for 26 : 6 in liver, where there was a minimally higher level seen in the 7·5 % group than the 10 % group. Furthermore, in heart, the n-3 VLC-PUFA 24 : 5 showed the highest detected levels in the 7·5 % VLC-Conc group and almost reached a significant difference between the groups (P = 0·0978). A similar result was also seen for 26 : 6 (P = 0·0767), although this showed a linear increase, with the highest detected levels in the 10 % VLC-Conc group (Table 7). In liver, there were quantitatively highest levels of the main n-3 VLC-PUFA from the diet, 28 : 8, followed by 24 : 5 and 24 : 6 (Table 6). Similar as for the liver, in heart, there were quantitatively highest levels of 28 : 8, followed by 24 : 5 and 24 : 6 (Table 6), showing that the n-3 VLC-PUFA composition of liver and heart PL and TAG mimicked the composition of these fatty acids in the VLC-Conc. EPA, DHA and DPA showed no significant differences between the diet groups in neither the PL nor TAG fraction of both liver and heart (Tables 6 and 7).
Results of the mouse feeding trial
n-3 Very-long-chain-PUFA composition of skin, eye, brain and testis of mice fed the control diet with plant oil, control diet with fish oil or very-long-chain-Conc diet
The first objective of this trial was to determine whether n-3 VLC-PUFA from diet are bio-available and deposited in central tissues of mice, as shown for salmon, and the second objective was to study whether a natural FO would influence endogenous production of n-3 VLC-PUFA due to high dietary EPA levels.
The n-3 VLC-PUFA 24 : 5 and 28 : 8 were significantly higher in skin, eye, brain and testis of mice in the VLC-Conc diet group. Furthermore, 24 : 6 was significantly higher in skin and testis of mice in the VLC-Conc diet group, while brain and eye showed no significance between diet groups in composition of this fatty acid (Figs. 4–7). The n-3 VLC-PUFA 26 : 5 was only detected in eye tissue, while 26 : 7 was only detected in testis tissue. Both were significantly higher in the VLC-Conc diet group (Figs. 5 and 7). In skin, eye and testis tissues, 26 : 6 was significantly higher in the VLC-Conc diet group, whereas in brain tissue, this fatty acid showed no significant difference between the diet groups (Figs. 4–7). The n-3 VLC-PUFA 24 : 6 had the quantitatively highest levels in skin, eye, brain and testis, followed by 24 : 5, although in eye and brain tissue, 24 : 6 did not show any between-group difference and seemed to be unaffected by diet composition. In the TAG fraction of mouse testis, there was a significant difference in the fatty acid composition of 24 : 6, 26 : 6, 26 : 7 and 28 : 8, with the highest detected levels in the VLC-Conc diet group. The n-3 VLC-PUFA 28 : 8 had the quantitatively highest levels, followed by 24 : 6, 26 : 6, 24 : 5 and 26 : 7, showing that the testis TAG composition mimicked the diet composition to a large extent (Table 8).
Dietary effects on the level of different fatty acids in mouse testis TAG*
(Mean values with their standard errors (n 5 for EPA (n 3 for Ctr-PO group), DPA (n 4 for Ctr-PO group) and DHA (n 4 for Ctr-PO group) values, and n 4 for VLC-PUFA values)

* Fatty acid composition (presented as µg/g tissue) in the TAG fraction from the testis of mice fed either a control diet with plant oil (Ctr-PO), a control diet with fish oil (Ctr-FO) or the experimental diet with n-3 very-long-chain PUFA (VLC-PUFA)-concentrate (VLC-Conc). P values ≤ 0·05 indicate statistical significance. Data were analysed by one-way ANOVA.
a,bMean values within each column with different superscript letters are significantly different.
Dietary effects on the level of different fatty acids in mouse skin phospholipid (PL). Fatty acid composition (presented as µg/g tissue) in the PL fraction from skin tissue from mice fed either a control diet with plant oil (Ctr-PO), a control diet with fish oil (Ctr-FO) or the experimental diet with n-3 very-long-chain PUFA (VLC-PUFA)-concentrate (VLC-Conc). One-way ANOVA was used to calculate differences between the diet groups (n 5 per diet group). a,b,c Mean values within each column with different superscript letters are significantly different (P < 0·05). There was a significant between-group difference for all fatty acids except 26 : 7. The VLC-Conc diet group showed the highest detected levels of the different n-3 VLC-PUFA, as well as EPA and DPA.

Dietary effects on the level of different fatty acids in mouse eye phospholipid (PL). Fatty acid composition (presented as µg/g tissue) in the PL fraction from eyes from mice fed either a control diet with plant oil (Ctr-PO), a control diet with fish oil (Ctr-FO) or the experimental diet with n-3 very-long-chain PUFA (VLC-PUFA)-concentrate (VLC-Conc). One-way ANOVA was used to calculate differences between the diet groups (n 9 for VLC-Conc and Ctr-FO diet groups, and n 8 for Ctr-PO diet group). a,b,c Mean values within each column with different superscript letters are significantly different (P < 0·05). There was a significant between-group difference for the fatty acids EPA, DHA, DPA, 24 : 5, 26 : 5, 26 : 6 and 28 : 8. The VLC-Conc diet group showed the highest detected levels of the respective fatty acids.

Dietary effects on the level of different fatty acids in mouse brain phospholipid (PL). Fatty acid composition (presented as µg/g tissue) in PL fraction from brain of mice fed either a control diet with plant oil (Ctr-PO), a control diet with fish oil (Ctr-FO) or the experimental diet with n-3 very-long-chain PUFA (VLC-PUFA)-concentrate (VLC-Conc). One-way ANOVA was used to calculate differences between the diet groups (n 5 per diet group). a,b,c Mean values within each column with different superscript letters were significantly different (P < 0·05). There was a significant between-group difference for the fatty acids EPA, DHA, DPA, 24 : 5 and 28 : 8. The VLC-Conc diet group showed the highest detected levels of the respective fatty acids.

Dietary effects on the level of different fatty acids in mouse testis phospholipid (PL). Fatty acid composition (presented as µg/g tissue) in the PL fraction from testis of mice fed either a control diet with plant oil (Ctr-PO), a control diet with fish oil (Ctr-FO) or the experimental diet with n-3 very-long-chain PUFA (VLC-PUFA)-concentrate (VLC-Conc). One-way ANOVA was used to calculate differences between the diet groups (n 4 per diet group). a,b Mean values within each column with different superscript letters are significantly different (P < 0·05). There was a significant between-group difference in all the detected fatty acids, and the VLC-Conc diet group showed the highest levels of the n-3 VLC-PUFA.

The data give some indications of increased endogenous production of n-3 VLC-PUFA in the brain of mice fed the EPA-rich Ctr-FO diet compared with mice fed the Ctr-PO diet with a trend to increased 22 : 5 (DPA), 24 : 5 and 24 : 6 in this group, all intermediates in the endogenous metabolic conversion of EPA to DHA. The intermediate 24 : 6 was also higher in testis and liver of mice fed the Ctr-FO diet.
In the PL fraction of mouse skin, eye, brain and testis tissue, EPA levels were significantly higher in the VLC-Conc diet group than in the Ctr-FO group, although the EPA level in the diet was lower in this group (Figs. 4–7). Similarly, DHA levels were significantly higher in eye, brain and testis of mice from the VLC-Conc diet group (Figs. 5–7). These results may indicate some backwards conversion from n-3 VLC-PUFA to EPA and DHA in the tissues of the VLC-Conc diet group. In skin, the Ctr-FO group had slightly higher levels of DHA, but this was not significant between this group and the VLC-Conc diet group (Fig. 4). DPA levels were also significantly higher in skin, eye and brain tissue of the VLC-Conc diet group (Figs. 4–6).
n-3 Very-long-chain-PUFA composition of phospholipid and TAG fractions of liver and heart tissues of mice fed the control diet with plant oil, control diet with fish oil or very-long-chain-Conc diet
In liver, there was a significant difference in the content of the n-3 VLC-PUFA. In the PL fraction, 24 : 6 and 28 : 8 had highest levels in the VLC-Conc diet group and Ctr-FO group, respectively. Although there was a trend towards higher levels of most n-3 VLC-PUFA in heart tissue of the VLC-Conc diet group, these did not reach significance.
Liver and heart tissues of mice were also analysed for PL and TAG n-3 VLC-PUFA content, as was done for the salmon trial. In the PL fraction, EPA levels were significantly different between the diet groups in both liver and heart. The Ctr-FO group had slightly higher levels of EPA in liver, although not significantly higher than the VLC-Conc diet group (Table 9), while the VLC-Conc diet group had significantly higher EPA levels than both the Ctr-PO and Ctr-FO diet groups (Table 10). DHA and DPA were also significantly different between the diet groups in both liver and heart, with the highest levels seen in the VLC-Conc diet group, except for DHA in heart, which was slightly higher in the Ctr-FO group, but not significantly higher than the VLC-Conc diet group.
Dietary effects on the level of different fatty acids in mouse liver phospholipid (PL) and TAG*
(Mean values with their standard errors, n 5 for each value)

* Fatty acid composition (presented as µg/g tissue) in the PL and TAG fraction from liver of mice fed either a control diet with plant oil (Ctr-PO), a control diet with fish oil (Ctr-FO) or the experimental diet with n-3 very-long-chain PUFA (VLC-PUFA)-concentrate (VLC-Conc) (data were analysed by one-way ANOVA). P values ≤ 0·05 indicate statistical significance.
a,b,cMean values within each column with different superscript letters are significantly different.
Dietary effects on the level of different fatty acids in mouse heart phospholipids (PL) and TAG*
(Mean values with their standard errors)

ND, not detected.
* Fatty acid composition (presented as µg/g tissue) in the PL and TAG fraction from heart of mice fed either a control diet with plant oil (Ctr-PO), a control diet with fish oil (Ctr-FO) or the experimental diet with n-3 very-long-chain PUFA (VLC-PUFA)-concentrate (VLC-Conc) (data were analysed by one-way ANOVA in PL fraction, n 5 for all values except EPA in VLC-Conc group, where n 4 in TAG-fraction, n 5 for EPA, DPA and DHA values, n 4 for VLC-PUFA values in Ctr-PO and VLC-Conc groups, and n 5 for VLC-PUFA values in Ctr-FO group). P values ≤ 0·05 indicate statistical significance
a,bMean values within each column with different superscript letters are significantly different.
In the TAG fraction of liver and heart, there was a significant difference in the fatty acid composition of the n-3 VLC-PUFA 24 : 4, 24 : 6 and 26 : 5, where all levels were highest in the VLC-Conc diet group. Additionally, 24 : 5 and 26 : 7 were significantly higher in liver in the VLC-Conc group, while 26 : 6 and 28 : 8 were significantly higher in heart in the VLC-Conc diet group. In liver, the highest levels were seen for the n-3 VLC-PUFA 26 : 7, followed by 24 : 6, 28 : 8 and 24 : 5, when measured quantitatively (Table 10). In heart, 24 : 6 showed the quantitatively highest levels, followed by 28 : 8 and 24 : 5 (Table 9). These data show that the mouse TAG fractions of liver and heart reflected the diet composition of these fatty acids relatively well, as also shown for the Atlantic salmon.
Opposite of what was observed for the eye, brain and heart PL, there were slightly higher levels of EPA in liver in the Ctr-FO group than in the VLC-Conc group, in agreement with the diet compositions (Tables 9 and 10). In the TAG fraction, there was a significant difference in the contents of EPA, DHA and DPA in both liver and heart, with the highest levels seen in the VLC-Conc diet group for all except DHA in heart, which was slightly higher in the Ctr-FO group.
Multivariate principal component analyses
Multivariate comparison of the effects of dietary n-3 very-long-chain-PUFA on endogenous n-3 very-long-chain-PUFA composition of different organs in mice
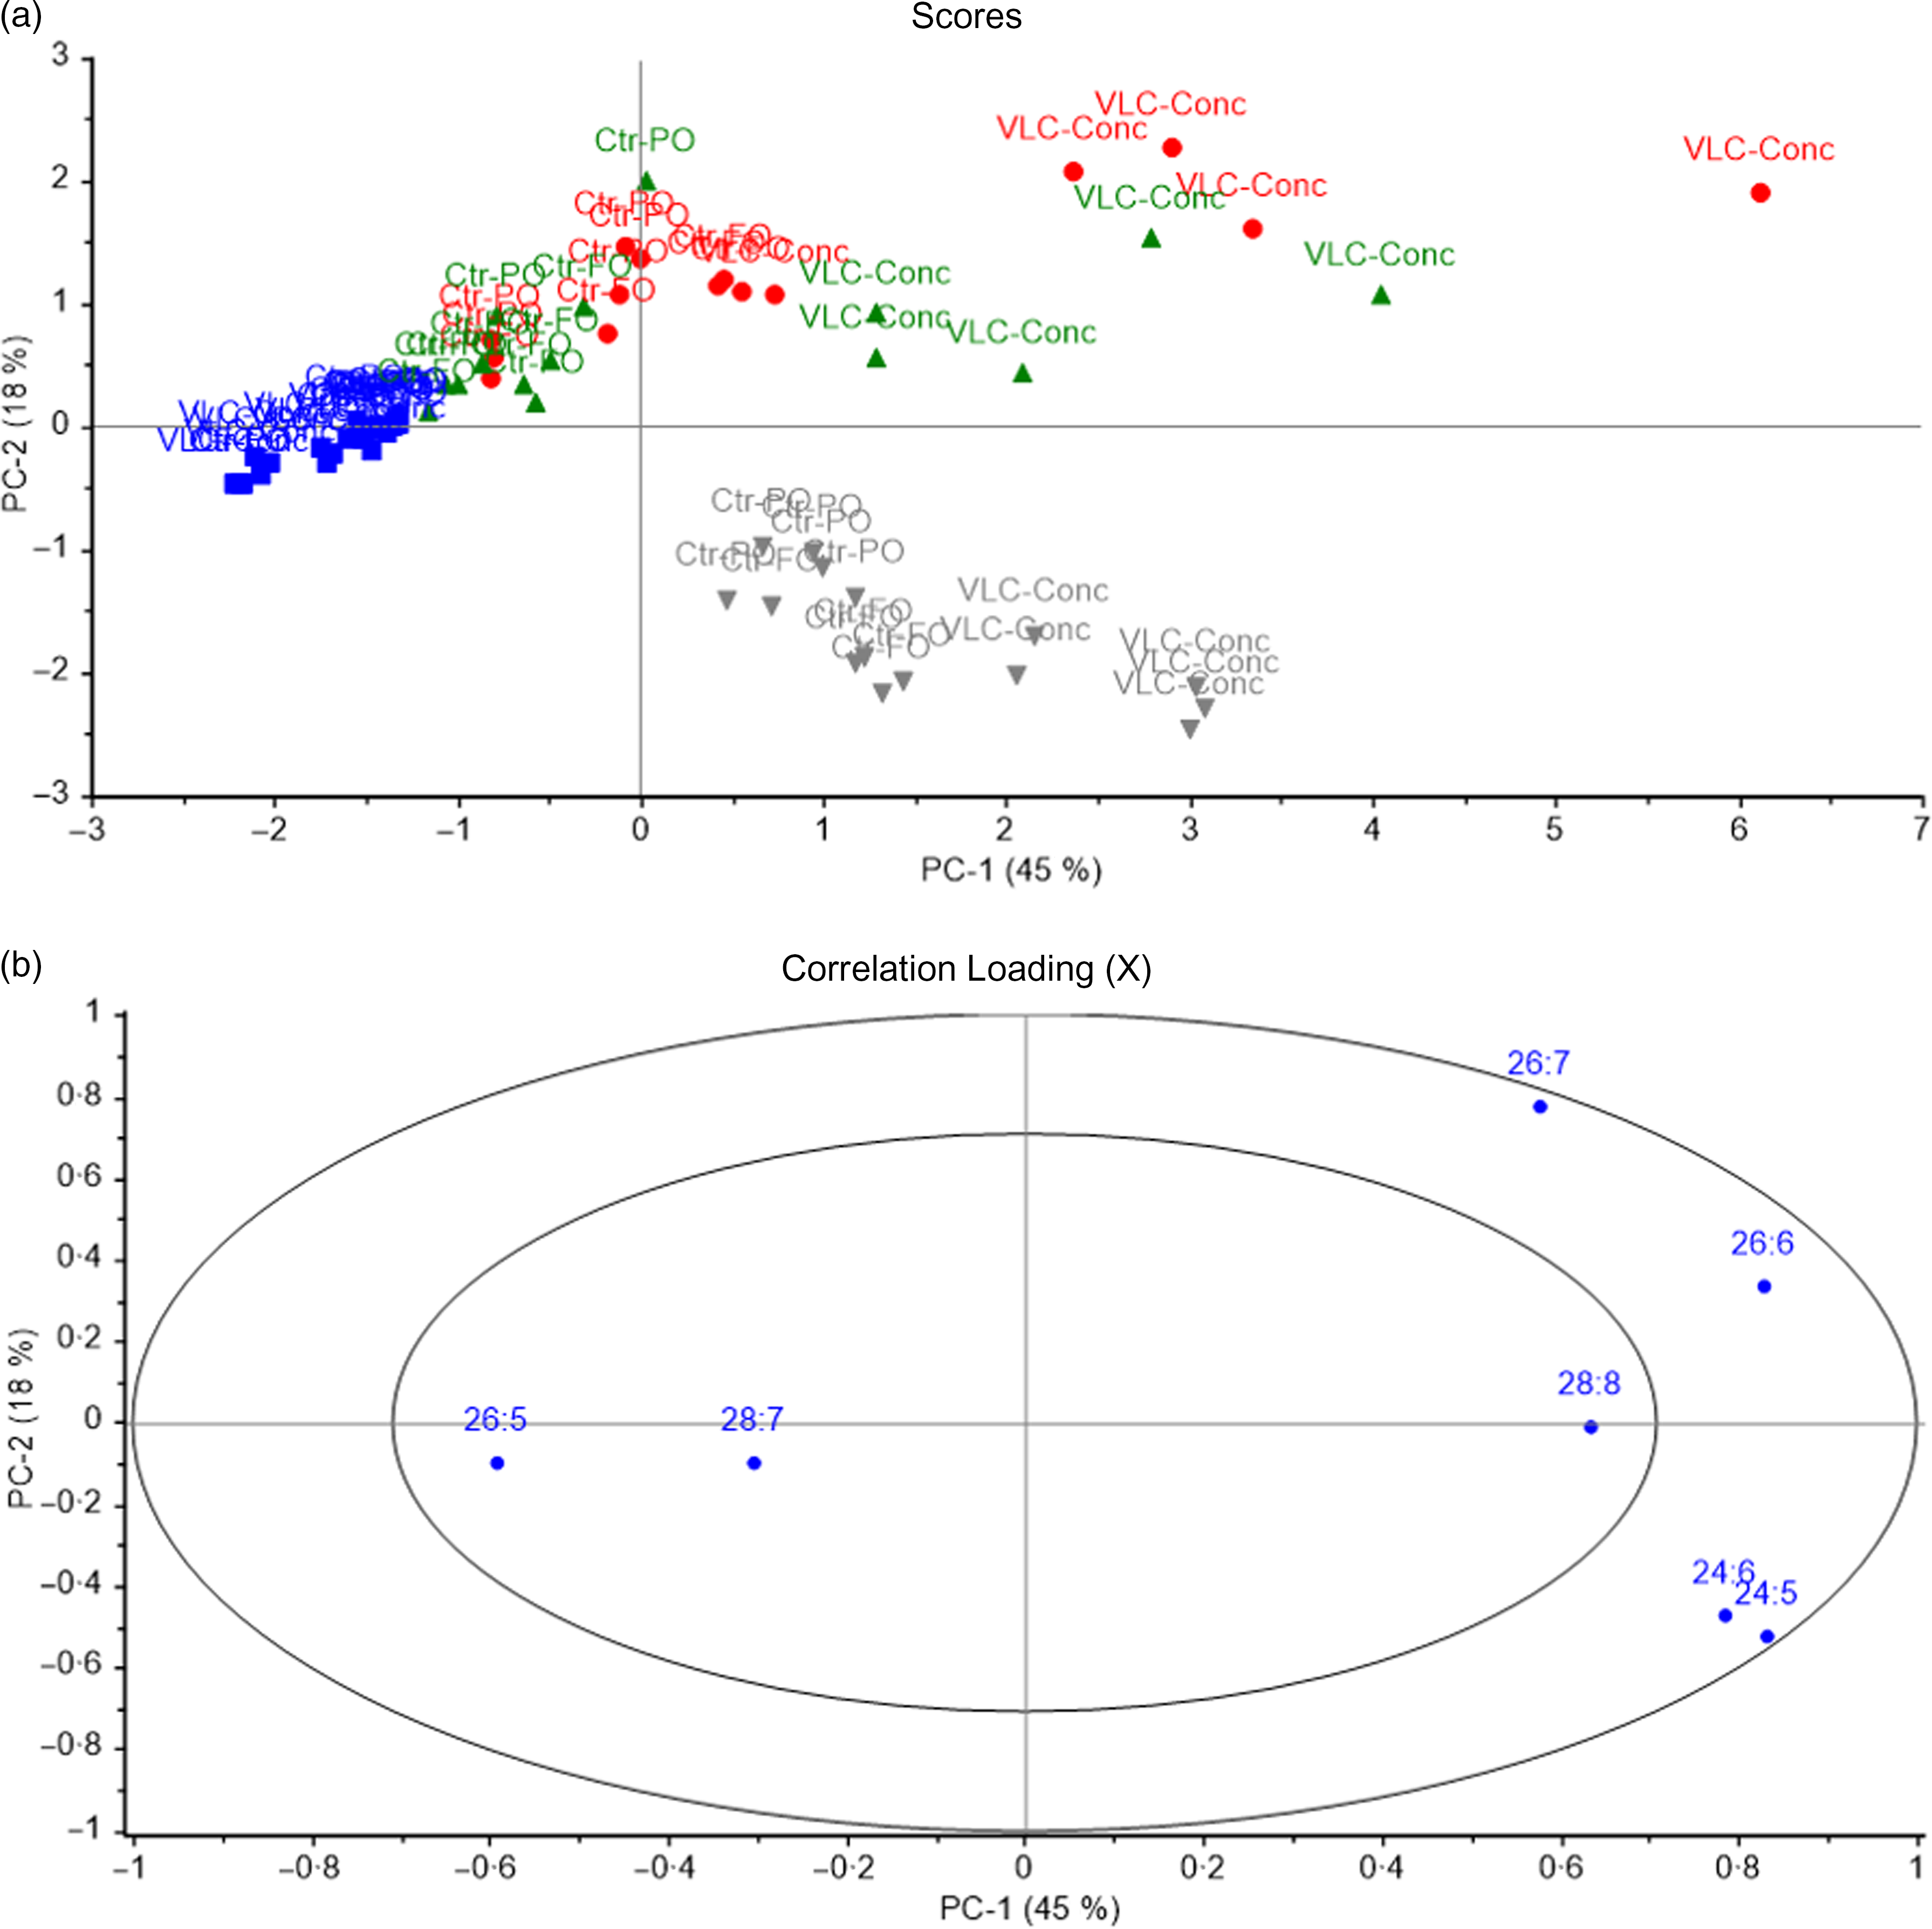
PCA were used to determine the most characteristic n-3 VLC-PUFA for each organ. In mice, all tissues except liver and heart were analysed. Samples with similar n-3 VLC-PUFA compositions were located in the same area in the score plot (Fig. 8), and 45 % of the variation was explained by the first principal component, which separated the samples into two major groups. Testis and skin from mice fed the VLC-Conc diet as well as brain from mice in all the dietary treatment groups were located in the right quadrant, whereas testis and skin from mice fed the control diets and eye from mice in all dietary treatment groups were located in the left quadrant (Fig. 8a). The skin and testis from mice fed the VLC-Conc diet were characterised by a high content of 26 : 6 and 26 : 7 (Fig. 8b). The second principal component separated brain tissue from skin and testis in the VLC-Conc group, showing a correlation between brain and 24 : 6 and 24 : 5. Brain samples formed a more compact cluster, indicating that it was less affected by the fatty acid composition of the diets (Fig. 8).
Scores (a) and correlation loadings (b) showing the relationship between the samples (diet groups and tissues) and the n-3 very-long-chain PUFA (VLC-PUFA) composition of mice tissues. These plots show the first principal component (PC-1) compared with the second principal component (PC-2), summarising 63 % of the variation between diet groups and tissues.  Eye;
Eye;  Testis;
 ![]() Skin;
Skin; ![]() Brain
Brain
Multivariate comparison of the effects of dietary n-3 very-long-chain PUFA on endogenous very-long-chain-PUFA composition in the phospholipid fraction from different organs in salmon
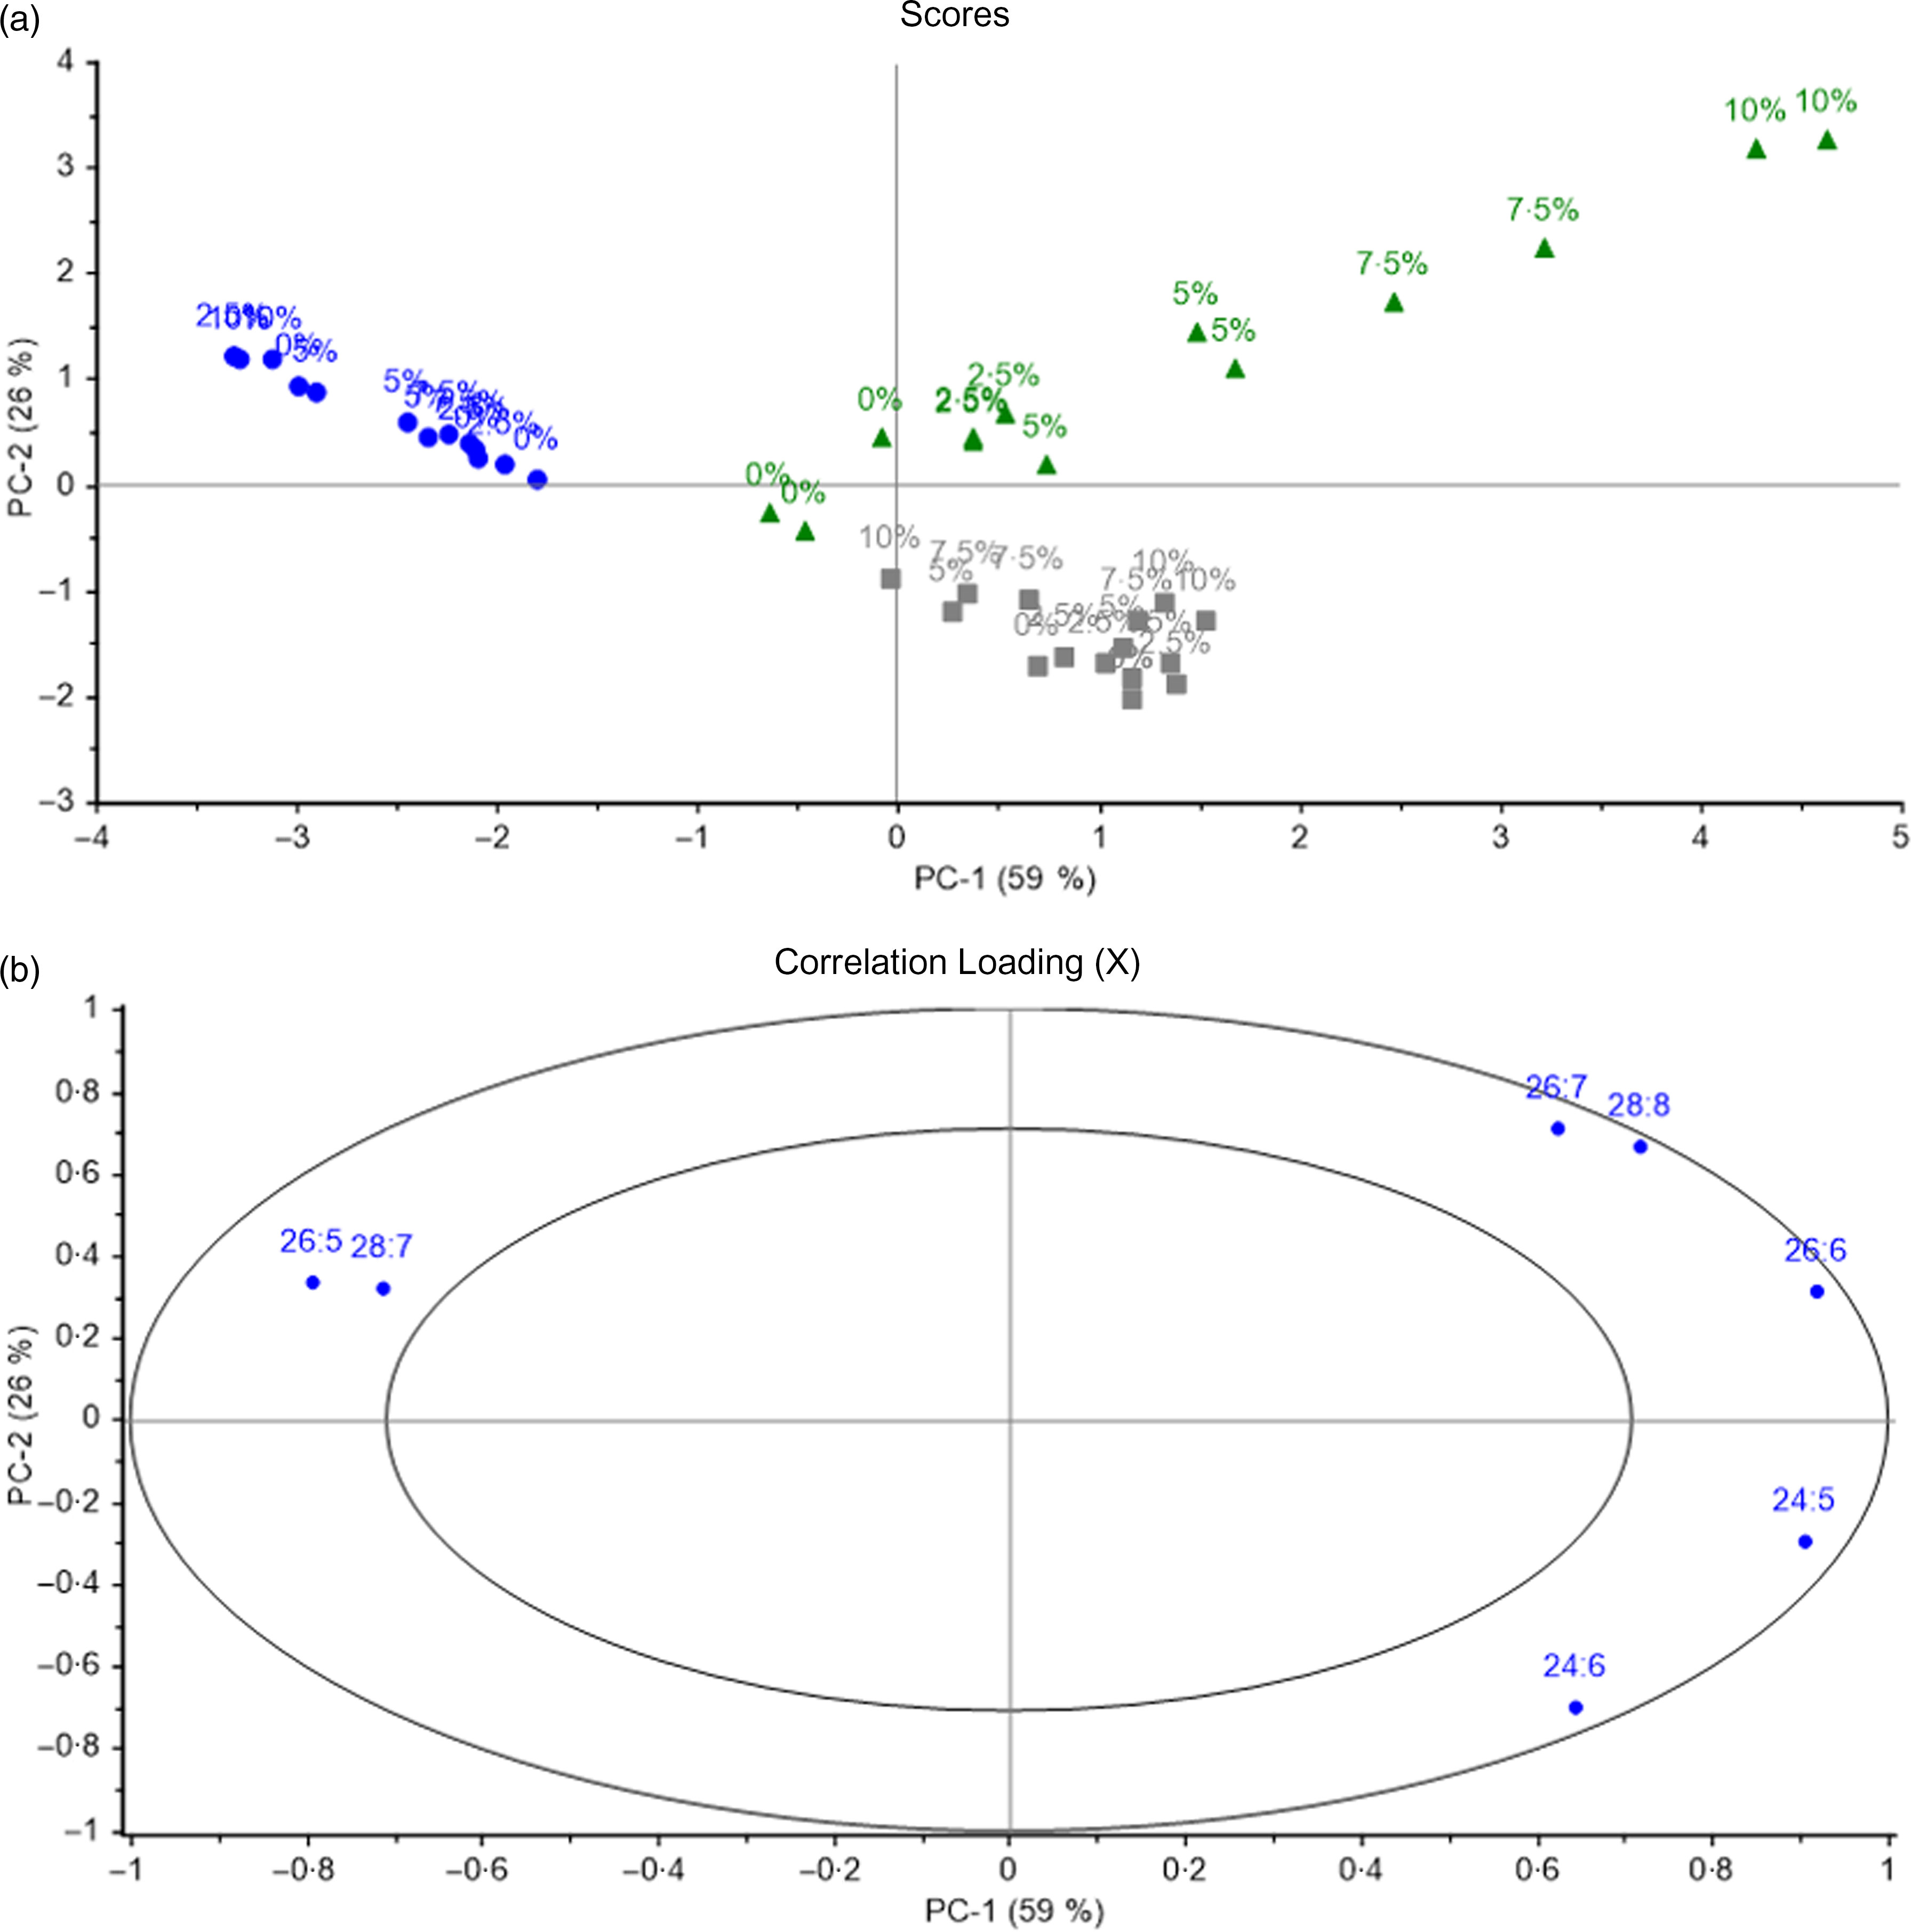
PCA was also used to identify the characteristic n-3 VLC-PUFA in the different organs of salmon depending on the different diet groups. All salmon tissues were included in the analysis. Samples with similar fatty acid compositions were located in the same area in the score plot (Fig. 9), and 59 % of the variation was explained by the first principal component, which separated the samples into two major groups: skin tissue (with the exception of skin from fish fed 0 % of VLC-Conc in the diet) and brain tissue in the right quadrant, and eye and skin tissue from the 0 % group in the left quadrant (Fig. 9a). Among the n-3 VLC-PUFA, skin tissue was characterised by high amounts of 26 : 6, 26 : 7 and 28 : 8, whereas eye tissue was characterised by 26 : 5 and 28 : 7 (Fig. 9b). The second principal component separated brain tissue from skin and showed a correlation between brain and 24 : 5 and 24 : 6. Skin was the tissue most affected by the diet and showed a separation according to diet group along the horizontal axis, with a clear dose–response effect. Eye and brain samples formed a more compact cluster, indicating that these tissues were less affected by the fatty acid composition of the diets. Although the different tissues were located in the same areas in the score plot, they were still individually influenced by the diet groups, with the percentages of VLC-Conc in diet increasing along the vertical axis for skin tissue, and showing separation according to diet group along the horizontal axis, showing a clear dose–response effect (Fig. 9a).
Scores (a) and correlation loadings (b) showing the relationship between the samples (diet groups and tissues) and the n-3 very-long-chain PUFA (VLC-PUFA) composition of salmon tissues. These plots show the first principal component (PC-1) compared with the second principal component (PC-2), summarising 85 % of the variation between diet groups and tissues. Numbers indicate the different diet groups named according to the percentage of VLC-Conc in their diets. Brain; Eye; Skin
Discussion
Previous studies have stated that VLC-PUFA are only available from in vivo synthesis and cannot be obtained at significantly high enough levels from the diet or be chemically synthesised in large enough quantities to allow feeding studies(Reference Bennett and Anderson25). The overall aim of this study was therefore to demonstrate the level of n-3 VLC-PUFA in tissues of three different species fed either a natural FO with low levels of n-3 VLC-PUFA or a FO concentrate with high levels of n-3 VLC-PUFA.
Analysis of several different FO, although these were a random selection of available samples and not necessarily representative of all FO, revealed that the natural content of n-3 VLC-PUFA is generally low (<1 % of total fatty acids), regardless of the source of the FO. Using a feeding trial in which rats were fed a FO with a natural VLC-PUFA content, we demonstrated that tissue levels of n-3 VLC-PUFA are not significantly affected after consumption of such low quantities. Nonetheless, an interesting finding was the trend for increased levels of n-3 VLC-PUFA observed in PL of rat eye. When mice were fed a FO diet (Ctr-FO) rich in EPA compared with a PO diet (Ctr-PO) with no EPA, there was a trending increase in 22 : 5 (DPA), 24 : 5 and 24 : 6 in the brain. These fatty acids are not the major n-3 VLC-PUFA in the FO but are important intermediates in the endogenous metabolic conversion of EPA to DHA (20 : 5 (EPA), 22 : 5, 24 : 5, 24 : 6, 22 : 6 (DHA))(Reference Metherel and Bazinet33). 24 : 6 was also higher in testis and liver of mice fed the Ctr-FO diet compared with the Ctr-PO diet. Together, these data indicate that these fatty acids are endogenously produced, due to the increase in dietary EPA from FO. However, there was a significant increase in 28 : 8 in mouse liver PL, which may originate from the 28 : 8 available in the Ctr-FO diet, since this fatty acid is the n-3 VLC-PUFA of the highest concentration in the FO. These findings highlight that the n-3 VLC-PUFA are so low in FO that they only to a very moderate degree directly influence the levels in most organs, except for liver, which to a higher extent reflected the diet composition. It was also observed that mice fed the VLC-Conc diet had higher EPA levels in most tissue PL studied, although the dietary level of EPA was lower in their diet. This could be an indication of some degree of endogenous synthesis of EPA from n-3 VLC-PUFA in this group.
In our feeding trials with Atlantic salmon and mice, a FO concentrate with a concentration of 40 g n-3 VLC-PUFA per 100-g oil was used. The predominant n-3 VLC-PUFA present in this concentrate (presented in the order of the highest quantitative value) were 28 : 8, 24 : 5, 26 : 6, 24 : 6 and 26 : 5 (Table 2). Fatty acids with chain lengths similar to those present in the n-3 VLC-PUFA concentrate used in our feeding trials have previously been detected in various tissues(Reference Agbaga, Brush and Mandal6,Reference Poulos, Sharp and Johnson12,Reference Cameron, Tong and Yang14,Reference McMahon and Kedzierski19,Reference Agbaga, Logan and Brush32,Reference Robinson, Johnson and Poulos34) , indicating that they are naturally present to some degree, although their different functions remain unknown. It is worth noting that to date, the literature has mostly addressed n-6 fatty acids in mammals, as these are the dominant fatty acids in humans and are highly detectable. Thus, it is important to emphasise that n-3 VLC-PUFA have not been well studied previously, predominantly due to their low levels in tissues.
In the salmon feeding trial, the animals were fed increasing dietary concentrations of n-3 VLC-PUFA, while EPA and DHA were kept constant. This study design made it possible to separate the effects of the dietary n-3 VLC-PUFA from the n-3 VLC-PUFA produced by endogenous synthesis. Here, we demonstrate for the first time that the n-3 VLC-PUFA in the VLC-Conc are bio-available. We showed a clear linear increase of tissue n-3 VLC-PUFA that were high in the concentrate, especially in salmon skin tissue. We also observed a clear deposition of n-3 VLC-PUFA in the skin of mice in the VLC-Conc diet group, which was significantly higher than in the control groups. In skin, the importance of VLC-FA has mostly been discussed in relation to VLC-SFA(Reference Cameron, Tong and Yang14,Reference Li, Sandhoff and Kono35) , and the role of VLC-PUFA remains unclear. In salmon eye tissue, we observed an increase in several n-3 VLC-PUFA with increasing VLC-Conc levels in the feed. Similar findings were observed in mouse eye tissue, which also showed significant increased levels of several n-3 VLC-PUFA in the VLC-Conc diet group. This is particularly relevant due to the interest in the molecular and physiological roles of VLC-PUFA that stem from the finding that ELOVL4, which is involved in the elongation of these fatty acids, is associated with STGD3, a disease leading to loss of vision. Previous studies have mostly addressed the possibility of a unique role of VLC-PUFA in the retina due to ELOVL4 mutations causing impaired tissue function of the retina(Reference Agbaga, Mandal and Anderson5,Reference Agbaga, Brush and Mandal6,Reference Agbaga, Logan and Brush32) . As the independent mutations causing STGD3 have been identified in exon 6 of ELOVL4, a lack of VLC-PUFA has been proposed as a possible cause of this vision loss, since retinal degeneration is the only known phenotype in this disease(Reference Agbaga, Brush and Mandal6,Reference Agbaga, Logan and Brush32) . Our findings support the importance of these fatty acids in eye tissue and form an important basis for studies to investigate whether supplementation of these fatty acids in the diet can have health-promoting effects in patients with these disease states. In brain tissue of both salmon and mice, dietary composition affected tissue composition to a lesser extent. This relatively conserved tissue composition could be interpreted as the brain being protected from alterations to its tissue composition in response to dietary changes. This is consistent with previous studies demonstrating that dietary intake has a low influence on PL fatty acid composition of the brain(Reference Skalli, Robin and Le Bayon36,Reference Betancor, Howarth and Glencross37) . In salmon brain, there was only a significant increase in 28 : 8 with increasing VLC-Conc in the feed, and interestingly, 24 : 6 decreased significantly with increasing VLC-Conc in the feed. This was opposite of what was observed when mice were fed a natural FO with low levels of n-3 VLC-PUFA and high levels of EPA, as we then observed a trend towards increased endogenous conversion to 24 : 6 in the brain. One possible explanation for the observed decrease in salmon brain could be a reduction of endogenous synthesis with increasing levels of n-3 VLC-PUFA available from the diet. This is in agreement with previous studies showing reduced endogenous synthesis of DHA when increasing levels of this fatty acids is provided through diet(Reference Kjær, Ruyter and Berge38). What we observe here could thus be a possible indication of feedback inhibition of ELOVL4 with increasing n-3 VLC-PUFA. We also observed a clear uptake of n-3 VLC-PUFA from the diet in both the PL and TAG fractions of mouse testis, where all n-3 VLC-PUFA except for 24 : 5 in the TAG fraction were significantly higher in the group fed the VLC-Conc diet.
Liver, although the major fatty acid metabolic organ, has not previously been shown to contain detectable levels of VLC-PUFA, and the same for other tissues not known to have ELOVL4 expression, opposite to retina, brain, skin and testis, which are known to have high expression(Reference Agbaga, Mandal and Anderson5,Reference Agbaga, Brush and Mandal6,Reference Cameron, Tong and Yang14,Reference Mandal, Ambasudhan and Wong17,Reference Vasireddy, Uchida and Salem24,Reference Agbaga, Logan and Brush32) . Since endogenous production of VLC-PUFA therefore is not expected in these tissues, an accumulation of n-3 VLC-PUFA here is likely to be a good reflection of uptake from diet, particularly in TAG (storage fat). In salmon, we observed a significant difference in numerous n-3 VLC-PUFA in both PL and TAG from liver and heart, with increasing levels as VLC-Conc increased in the salmon feed. In mouse liver PL, 24 : 6 and 28 : 8 increased significantly in the VLC-Conc diet group, whereas we observed greater accumulation in the TAG fraction from liver of mice fed the VLC-Conc diet. The same findings were observed in heart tissue of mice. These findings demonstrate that n-3 VLC-PUFA are deposited in all tissues studied. Furthermore, the significant difference seen in the TAG fractions compared with the PL fractions demonstrates greater uptake in storage fat. A possible explanation is that these fatty acids serve PL-specific functions and that cellular membranes are protected against excessive modifications in fatty acid composition(Reference Agbaga39).
We looked primarily at the fatty acid composition of PL, since cell membranes primarily consist of a lipid bilayer composed of PL and cholesterol that control cell membrane fluidity and functionality. The fatty acid composition of cellular membranes has an impact on numerous cellular functions, and modifications can thus affect the cellular functions. TAG mainly functions as an energy storage, and it is therefore interesting to see whether surplus fatty acids from the diet are taken up and stored here(Reference Spector and Yorek40–Reference Tvrzicka, Kremmyda and Stankova42). It is reasonable to assume that the body reaches a threshold at which it ensures no more uptake into PL after a certain level of deposition and that the surplus therefore goes into TAG. It is known that there is also a threshold for TAG and that excess uptake can lead to accumulation in organs such as the heart, liver and kidneys. We also believe that when supplementing with fatty acids that the body is not well acquainted with, it may take time for the mechanisms of degradation of these to be sufficiently up-regulated in order to prevent their accumulation, which can also result in their temporary accumulation. This has previously been shown in studies where salmon are fed high dietary levels of tetradecylthioacetic acid(Reference Moya-Falcón, Hvattum and Dyrøy43), and studies with rats fed high dietary levels of erucic acid have for instance shown that it causes an accumulation that is reversible and transient(Reference Chain, Knutsen and Alexander44). In this initial study, the experimental animals were fed relatively high doses. Therefore, future follow-up studies in rodents are required to continue investigating the potential effects of these fatty acids and what lower doses are acceptable and relevant for the body.
Since no previous studies have demonstrated the ability of these fatty acids to be taken up from diet, this study provides unique insight into the organ deposition of n-3 VLC-PUFA. One major strength of this study is that it was conducted using different species and that similar trends were observed between the species. As there is limited data regarding which specific VLC-PUFA are present in different tissues, it was particularly interesting to look at these specifically and compare them between the species. As shown in Figures 8 and 9, there are similar trends in the deposition of the n-3 VLC-PUFA in the organs of both mice and salmon fed diets high in these fatty acids. The fatty acids 26 : 6 and 26 : 7 were prominent in skin tissue of both mice and salmon, with a considerable amount also detected in mouse testis. Furthermore, the fatty acids 24 : 5 and 24 : 6 were most prominent in brain tissue of both mice and salmon, while 26 : 5 and 28 : 7 were most characteristic for eye tissue of both mice and salmon. The fact that the same fatty acids show similar trends in the similar tissues of the different species can be interpreted as these fatty acids serving specific roles in the specific tissues in which they appear. Available literature on VLC-PUFA has, as we have already discussed, speculated about the important functions of these fatty acids, as they have been linked to several disease states when the protein required for their synthesis is non-functional. This is based on the ELOVL4 enzyme being the only fatty acid elongase known to mediate the biosynthesis of VLC-PUFA, where mutations result in tissue-specific human disorders of clinical importance(Reference Agbaga39,Reference Poulos45) . Our findings support the theory of these fatty acids serving tissue-specific roles; however, this needs further investigations.
The biological effect of dietary n-3 VLC-PUFA remains unknown, especially in tissues in which these fatty acids do not normally appear. It would be particularly interesting to further explore the possibility of a dietary supplement containing these fatty acids as a potential therapeutic treatment for conditions caused by mutations in the ELOVL4 gene. Our findings show that skin and testis are affected by the diet to a greater extent than brain and eye. As there are several indications that VLC-PUFA have important functions in these tissues(Reference Cameron, Tong and Yang14,Reference Rabionet, van der Spoel and Chuang21–Reference Vasireddy, Uchida and Salem24) , they are interesting targets to explore how dietary n-3 VLC-PUFA affect skin health, sperm quality and testicular function. The great uptake of n-3 VLC-PUFA in skin tissue is particularly interesting to explore in relation to a dietary supplement, as the major ELOVL4 products known from in vivo synthesis are VLC-SFA. Thus, while VLC-PUFA have not been extensively investigated in skin, they could potentially exert health promoting effects. The high levels of uptake in testis are also particularly interesting as it would be important to investigate whether a dietary supplementation could be a possible solution in cases of depleted VLC-PUFA levels leading to fertility problems.
Conclusions
In conclusion, this study demonstrates that dietary n-3 VLC-PUFA are bio-available and distributed in all organs and tissues studied including brain, eye, skin, liver, heart and testis. The skin and testis were the organs that mimicked the diet composition of n-3 VLC-PUFA to the largest extent. Furthermore, the distribution of n-3 VLC-PUFA appears to be tissue-dependent, but not species-specific. Although dietary conventional FO did not significantly affect most tissue n-3 VLC-PUFA levels when compared with a control PO diet group, the results indicate some degree of endogenous synthesis of n-3 VLC-PUFA, especially in brain.
Acknowledgements
The authors specially thank Målfrid T. Bjerke for all the work related to the lipid analyses and Lisbeth Vedvik for assistance with fatty acid analyses.
This work was carried out with support from the following projects supported by The Research Council of Norway: DodreMarin (project no. 256446), MarOmega3 (project no. 282233) and Health effects of marine VLC-fatty acids (project no. 310433).
M. T. contributed to the design of the study, analyses of lipid composition in tissues and statistical analyses and was mainly responsible for writing of article. B. R. and I. S. contributed to the formulation of the research questions, design of the study and writing of article. H. S. contributed to production of VLC-PUFA concentrate, analyses of VLC-PUFA in tissues and writing of article, A. N. contributed to design and analyses of the rat study and writing of article, T.-K. Ø. contributed to design and analyses of the rat study, G. B. contributed to design and analyses of fish feeding trial and writing of article and M. B. contributed to PCA data analysis and lipid analyses.
The first author of this publication has a PhD position partly financed by an Innovation project in Norwegian Research Council (project no. 310433) and by the industry partner Epax Norway AS (Aalesund, Norway). Epax Norway has patents and patent applications related to VLC-PUFA. However, since this project has public funding, all results are open and there is no conflict of interest in publishing all results in an open access journal.
Supplementary material
For supplementary material referred to in this article, please visit https://doi.org/10.1017/S0007114521000817


 Open access