


Extreme body weight, either excessive or inadequate, possesses health risk. Excessive body weight or obesity is a major risk factor of hypertension, dyslipidaemia, type 2 diabetes and heart disease, whereas underweight is often associated with weakened immune competency, increased risk of infection and poor physical functional ability(Reference Seidell and Visscher1–Reference Hickson3). Weight change is also associated with changes in the extremities such as mid-arm circumference (MAC) and calf circumference (CC). Many factors such as ageing, physical activity, nutrition and chronic health conditions can influence the size of these circumferences(Reference Tsai, Liou and Chang4).
BMI (kg/m2), calculated from height and weight, is usually considered an indicator of body fatness because weight gain is usually associated with fat gain. MAC and CC reflect body muscle mass in addition to subcutaneous fat, thus are indicative of physical functional ability and body fatness(Reference Chumlea5).
Advanced ageing is often accompanied by unplanned weight loss and body protein loss, a process called sarcopenia, which is often associated with functional decline(Reference Roubenoff6). Thus, excessive weight loss rather than excessive weight gain is more of a concern in geriatric health. Monitoring changes in weight (or BMI) and circumferences of extremities such as arm and calf, therefore, is particularly useful in geriatric care.
Because BMI, MAC and CC can reflect weight loss and functional decline in older adults, these indicators have been included in scales for assessing health or nutritional status of frail or hospitalised persons(Reference Green and Watson7). However, the relative ability of these indicators in predicting functional status or long-term mortality has not been extensively examined, especially in Eastern populations. In the present study, we compared the ability of BMI, MAC and CC in predicting long-term mortality risk in older Taiwanese.
Methods
The present study analysed the 1999 and 2003 data of the ‘Survey of Health and Living Status of the Elderly in Taiwan’, a population-representative longitudinal cohort study conducted by the Bureau of Health Promotion of the Department of Health of Taiwan. This ongoing cohort study was initiated in 1989 for gaining an understanding of the role of socioeconomic, environmental, lifestyle and health care parameters on health, wellbeing and quality of life of older Taiwanese(8). The design and sampling process of the project are available at a government website(9), and the key steps are outlined in Fig. 1. The study employed a multi-stage national probability sampling process. The entire population in Taiwan was first stratified into 361 administrative units (primary sampling units). After excluding thirty lightly populated mountainous (aboriginal) areas, the remaining 331 primary sampling units were stratified into twenty-seven strata of roughly equal population sizes, and fifty-six primary sampling units were chosen based on proportion-to-size random selections. Stage 2 involved proportion-to-size selections of blocks (lins, the primary administrative unit) from selected primary sampling units, and the final stage involved random selections of two eligible persons, 60 years of age or older, from each of the selected lins. The process selected 4412 elderly men and women ≥ 60 years of age to serve as subjects.
Sampling process of the Survey of Health and Living Status of the Elderly in Taiwan. PSU, primary sampling units.

In 1996, a second sampling of 2462 subjects, 50–66 years old, selected with the same process was added to the cohort. Subjects in the cohort were interviewed every 3–4 years (in 1989, 1993, 1996, 1999, 2003 and 2006) with a core questionnaire. Each survey also contained additional questionnaires for specific purposes. Data up to the 2003 survey have been released for academic studies.
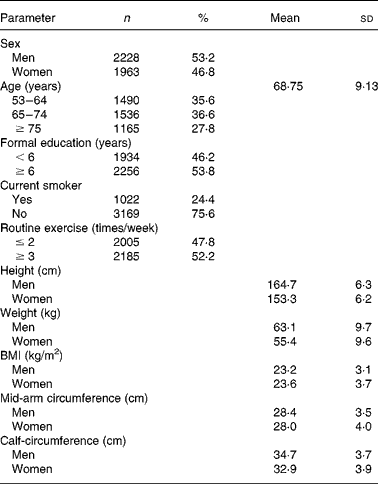
In each survey, trained interviewers conducted in-home face-to-face interviews. The 1999 survey involved all available (4915) participants in the cohort, and the youngest was 53 years old. Only the 1999 survey included data of all the three (BMI, MAC and CC) anthropometric measurements and therefore was chosen as the baseline dataset of the present analysis. The 2003 survey, the latest dataset available, served as an end point. Data were analysed with the Statistical Package for the Social Sciences (SPSS version 14.0; Chicago, IL, USA). Self-reported height and weight at baseline (1989) were used to calculate BMI (kg/m2). MAC and CC were measured. Population-specific cut-off points were used to define low or high anthropometric values. The present analysis used the higher threshold values of the anthropometric cut-off points in the Mini Nutritional Assessment Taiwan Version-II(Reference Tsai and Ku10). The cut-off points were < 21 kg/m2 for low BMI and ≥ 27 kg/m2 for high BMI for both men and women, and 23·5/22 cm (for men/women) for low MAC and 30/27 cm (for men/women) for low CC. No cut-off points was established for high extremities. Mortality data were collected from records maintained by the Survey of Health and Living Status of the Elderly in Taiwan and confirmed with records of the Universal Health Insurance Program and the National Household Registration. Age-, sex-, smoking status- and routine physical activity-adjusted 4-year follow-up survival curves classified according to BMI, MAC and CC statuses for subjects aged 53–64, 65–74 and ≥ 75 years are shown in Figs. 2–4, respectively. The study was conducted according to the guidelines laid down in the Declaration of Helsinki, and all procedures involving human subjects/patients were approved by the government-appointed representatives. Written informed consent was obtained from all the subjects/patients.
Age-, sex- and smoking status-adjusted 4-year follow-up survival curves stratified by BMI status (—, < 21 kg/m2; - - -, 21–27 kg/m2;–·–, ≥ 27 kg/m2) and age range (53–64 years (a), 65–74 years (b), ≥ 75 years (c)). Cox regression analyses (adjusted for age, sex, exercise and smoking status) showed that underweight ( < 21 kg/m2) was associated with higher follow-up mortality risk. Hazard ratio (adjusted OR) and 95 % CI were 2·79 (1·58, 4·95) for 53–64 years, 1·54 (1·12, 2·13) for 65–74 years and 1·38 (1·10, 1·74) for ≥ 75 years elderly (all P < 0·01), using elderly normal weight (21–27 kg/m2) as the reference. Excessive weight ( ≥ 27 kg/m2) was not significantly associated with mortality risk. The HR and 95 % CI were 1·45 (0·70, 2·98) for 53–64 years, 0·58 (0·31, 1·08) for 65–74 years and 0·78 (0·50, 1·21) for ≥ 75 years elderly, (all P>0·05) using subjects with desirable weight (21–27 kg/m2) as the reference.
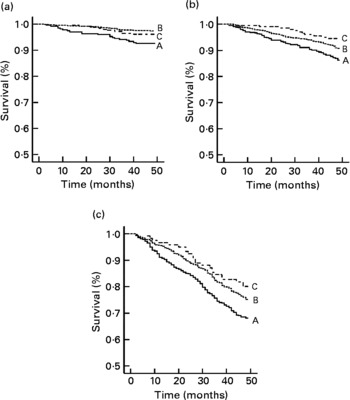
Age-, sex- and smoking status-adjusted 4-year follow-up survival curves stratified by size of mid-arm circumference (MAC) ( < 23·5 cm for men/22 cm for women (—) or ≥ 23·5/22 cm (- - -)) and age range (53–64 years (a), 65–74 years (b), ≥ 75 years (c)). Cox regression analyses (adjusted for age, sex, exercise and smoking status) showed that small MAC ( < 23·5/22 cm) was associated with higher follow-up mortality risk. Hazard ratio (adjusted OR) and 95 % CI were 3·39 (1·22, 9·45) (P < 0·05) for 53–64 years, 2·19 (1·37, 3·50) (P < 0·001) for 65–74 years and 1·31 (0·93, 1·84) (P>0·05) for ≥ 75 years elderly using subjects with MAC ≥ 23·5/22 cm as the reference.

Age-, sex- and smoking status-adjusted 4-year follow-up survival curves stratified by size of calf circumference (CC) ( < 30 cm for men/27 cm for women (—) or ≥ 30/27 cm (- - -)) and age range (53–64 years (a), 65–74 years (b), ≥ 75 years (c)). Cox regression analyses (adjusted for age, sex, exercise and smoking status) showed that small CC ( < 30/27 cm) was associated with higher follow-up mortality risk. Hazard ratio (adjusted OR) and 95 % CI were 2·64 (0·82, 8·46) (P>0·05) for 53–64 years, 2·59 (1·66, 4·06) (P < 0·001) for 65–74 years and 1·98 (1·52, 2·58) (P < 0·001) for ≥ 75 years elderly using subjects with CC ≥ 30/27 cm as the reference.

Cox regression analyses were performed to evaluate the relative mortality risks of the subjects with low or high BMI, or low MAC or CC adjusted for age, sex, smoking status and physical activity. Statistical significance for all the analyses was evaluated at α = 0·05.
Results
During the 4-year follow-up period, 566 of 4191 respondents died. Mortality risk increased from 4 % for persons aged 53–64 years to 11 and 29 % for persons aged 65–74 and ≥ 75 years, respectively. In all the three age groups, persons with low BMI ( < 21 kg/m2), low MAC ( < 23·5/22 cm for men/women) or low CC ( < 30/27 cm for men/women) had higher mortality risk than persons with normal BMI (21–27 kg/m2) or circumferences (Tables 1 and 2). Persons with excessive BMI ( ≥ 27 kg/m2) had higher risk in near-old (53–64 years) persons but had lower risk in older ( ≥ 65 years) persons compared with persons with normal BMI.
(Mean values and standard deviations; number and percentage values)
The follow-up 4-year mortality records (no. of deaths/no. of subjects) in older Taiwanese classified by age and anthropometric statuses (n 4191)
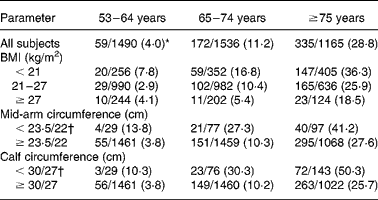
* Number of deaths in 4 years/total number of subjects in group at baseline.
† Cut-off values for men/women.
Cox regression analyses showed that underweight ( < 21 kg/m2) significantly increased follow-up mortality risk in all the three age ranges, but the risk was greater (hazard ratio = 2·79) (P < 0·001) for 53–64-year-old persons than for older persons (hazard ratio = 1·54 for 65–74-year-old and hazard ratio = 1·38 for ≥ 75-year-old persons, both P < 0·01) (Fig. 2). Excessive weight ( ≥ 27 kg/m2) appeared to increase the mortality risk in 53–64-year-old persons but to reduce the risk in older ( ≥ 65 years) persons, but all these changes were not statistically significant (all P>0·05).
Small MAC increased follow-up mortality risk in 53–64-year-old and 65–74-year-old persons, but not in ≥ 75-year-old elderly using normal MAC as the reference (Fig. 3). Small CC increased follow-up mortality risk in elderly persons (65–74 and ≥ 75 years) (both P < 0·001) using normal CC as the reference; but the increase in 53–64-year-old persons was NS (Fig. 4).
Discussion
Results of the present study suggest that all the three anthropometrics (BMI, MAC and CC) have long-term mortality risk-predicting values in older adults, but their relative effectiveness varies and is dependent on age. Low BMI ( < 21 kg/m2) is more effective in predicting mortality risk in near-old (53–64 years) persons than 65–74- or ≥ 75-year-old elderly. Low MAC predicts increased mortality risk in 53–64- and 65–74-year-old persons but not in ≥ 75-year-old elderly. Low CC predicts increased follow-up mortality risk in 65–75- and ≥ 75-year-old elderly but not in younger near-old (53–64 years) persons.
In near-old (53–64 years) persons, the utility of MAC and CC in predicting follow-up mortality risk is limited because only a small proportion (1·9 %) of persons have reduced circumferences. Therefore, although these indicators have high specificity, they have poor sensitivity. In 65–74-year-old persons, MAC and especially CC are more effective in predicting mortality risk than BMI. In ≥ 75-year-old persons, CC is the most effective, followed by BMI; MAC is not effective.
In the present study, high BMI ( ≥ 27 kg/m2) only suggests increased risk in younger (53–64 years) persons and reduced risk in older (65–74 years and ≥ 75 years) persons; none of these effects reached statistical significance.
The ability of BMI to predict follow-up mortality risk has been observed in numerous studies(Reference Stevens, Cai and Pamuk11–Reference Gulsvik, Thelle and Mowe18). Most studies indicate a J- or U-shaped association, but the thresholds for low and excessive BMI vary among populations or studies. The thresholds generally fall within BMI < 20–23 kg/m2 for underweight and BMI>25–30 kg/m2 for excessive weight, depending on the age range of study subjects and statistical conditions applied.
Some recent large-scale studies have indicated a positive association of mortality risk with excessive BMI and an inverse association with low BMI. In a recent study involving over half a million 50–71-year-old persons in the USA, Adams et al. (Reference Adams, Schatzkin and Harris19) observed that the risk of death was associated with both overweight (BMI 25–30 kg/m2) and obesity (BMI>30 kg/m2) among men and women when the analysis was restricted to healthy people who had never smoked. The Prospective Studies Collaboration(20) which analysed fifty-seven prospective studies involving 900 000 adults suggested that mortality was lowest at about 22·5–25 kg/m2; above or below this range, the overall mortality increases. In a national cohort involving 64 731 men and 19 011 women, Freedman et al. (Reference Freedman, Ron and Ballard-Barbash21) observed that among younger/middle-aged ( < 55 years) never-smoking women, the risk rose as BMI increased above 21·0 kg/m2, whereas in older women, the risk increased beginning at a higher BMI (>25·0 kg/m2). Among younger men who never smoked, the risk began to rise above 23·0 kg/m2, whereas in older men, the risk did not begin to increase until exceeding 30·0 kg/m2. In Eastern populations, Tamakoshi et al. (Reference Tamakoshi, Yatsuya and Lin22) observed that all-cause mortality risk is lowest and fairly consistent between BMI 20 and 30 kg/m2 in both older Japanese men and women aged 65–79 years. Jee et al. (Reference Jee, Sull and Park23) indicated a lowest all-cause mortality risk of BMI 23–25 kg/m2 for Koreans aged 30–90 years. On the other hand, the study by Auyeung et al. (Reference Auyeung, Lee and Leung24) indicated that BMI is effective in predicting all-cause mortality risk for underweight (BMI < 21 kg/m2) males but not for females, and not effective in predicting risk for excessive weight in Chinese people aged 65 years or older in Hong Kong. Taken together, these results suggest that BMI has mortality risk predictive ability, but the thresholds for underweight and excessive weight vary among populations and are age dependent.
Circumferences of the extremities, especially MAC and CC, have been found to be very useful for evaluating health and nutritional statuses of elderly persons(Reference Bonnefoy, Jauffret and Kostka25, Reference Coelho, Rocha and Fausto26), and these measures can provide valuable information on muscle-related disability, physical function and mortality risk(Reference Bonnefoy, Jauffret and Jusot27, Reference Rolland, Lauwers-cances and Cournot28). Larger circumference of the extremities, especially CC, has been observed to have protective health effects(Reference Enoki, Kuzuya and Masuda29, Reference Reid, Naumova and Carabello30). An inverse association between upper arm circumference and mortality has previously been observed in males(Reference Allison, Zhu and Plankey14) and females(Reference Zhu, Heo and Plankey15) of the National Health and Nutrition Examination Survey I and II. An inverse association between upper arm circumference and mortality risk has also been observed in 61–79-year-old men in the British Regional Heart Study(Reference Wannamethee, Shaper and Lennon31) after adjusting for multiple indicators of ill health. Because MAC does not decline until the later stage of body functional decline, it has been suggested that it is not as useful in serving as an indicator of nutritional status in younger old as it is in older individuals(Reference Burden, Stoppard and Shaffer32, Reference Allard, Aghdassi and McArthur33). In the Canada Fitness Survey, arm circumference, thigh circumference and CC were significantly protective in men, while arm and thigh circumferences were protective in women(Reference Mason, Craig and Katzmarzyk34). It was postulated that these inverse associations between circumferences of the extremities and health risk may be owed to a greater accumulation of subcutaneous lean body mass, adipose tissue or a combination of these factors in the periphery.
Thus, it is clear that in addition to BMI, MAC and CC have good and, in many cases, better follow-up mortality risk-predicting abilities. However, despite of these well-recognised observations, the predictive ability of these extremities has rarely been directly compared(Reference Mason, Craig and Katzmarzyk34), especially examining the relative effectiveness during various stages of the elderly life. To our knowledge, the present study is the first to observe an age-dependent relationship of the relative effectiveness of the three measures in predicting follow-up mortality in elderly persons.
Because these anthropometrics reflect body fatness, physical functioning and health statuses and can predict follow-up mortality risk, these indicators can play an important role in health or nutrition assessment scales. Most health or nutritional assessment tools include some indicators of body weight such as BMI or recent weight changes(Reference Green and Watson7), and only few such as the Mini Nutritional Assessment include MAC and CC in addition to BMI(Reference Guigo, Vellas, Garry, Vellas, Guigoz, Garry and Albarede35).
Results of the present study lead us to wonder whether BMI should be the preferred or nearly the only anthropometrics included in most of the geriatric assessment tools and whether the same threshold should be applied across the populations. As we have observed, MAC and especially CC are better predictors of follow-up mortality risk than BMI in the elderly. Consideration should be given to include these indicators in the assessment tools in order to achieve the most accurate results. In frail elderly, there are clear advantages in using CC and/or MAC rather than BMI. Compared with weight and height (for computing BMI), CC and MAC are easier and more accessible and time efficient to measure in frail or disabled individuals.
For persons who are non-ambulatory or have difficulty in standing erectly, BMI can be calculated from estimates of stature and weight. Stature can be estimated from tibia length or knee height, and weight can be estimated from knee height and MAC(Reference Lee, Nieman, Lea and Nieman36–Reference Cereda, Bertoli and Battezzati38). However, these estimations require ethnic/race-, age- and sex-specific equations, and measurements of knee height and tibia length may require special devices. The process is generally more involved than in measuring MAC or CC, and the quality of estimates may sometimes be questionable(Reference Lee, Nieman, Lea and Nieman36). Thus, for the purposes of the present study, computation of BMI using these estimates is not favoured.
There are strengths and limitations in the present study. A major strength is that the dataset is from a prospective cohort study involving a relatively large nationally representative sample, thus results should have good generalisability. However, the sample size is not yet large enough for certain sections such as individuals with BMI>30 kg/m2. In the survey, weight and height are self-reports. Self-reported height and weight are generally known to be accurate(Reference Tsai and Ku10), but some errors or deviations from true values are unavoidable. CC and MAC data were measured, but no follow-up data were available; therefore, we cannot evaluate the effect of changes in body weight or circumferences over time. We adjusted age, sex, smoking status and routine physical activity to minimise the potential confounding effects by these factors, but we cannot rule out other confounding factors.
Results of the present study indicate that three frequently used anthropometric parameters, BMI, MAC and CC, are effective in predicting follow-up mortality risk of older adults, but their abilities are age dependent. Among the three indicators, CC has the strongest predictive ability in elderly over 65 years of age, and MAC also has good predictive ability in 65–74-year-old elderly. BMI is most effective in younger (53–64 years) persons. Considering that CC and MAC are more accessible and easier to measure than BMI, especially in frail or ill persons, effort should be made to increase the use of these indicators in many of the geriatric health or nutritional assessment tools.
Acknowledgements
The authors wish to thank the Bureau of Health Promotion, Department of Health of Taiwan, for providing the dataset for the present study. The study is supported by a grant from the National Science Council of Taiwan (NSC 97-2320-B-468-003). A. C. T. conceived the idea, directed the study and drafted the manuscript. T.-L. C. performed statistical analyses. Both the authors read, revised and approved the manuscript. Both the authors declare no conflict of interest of any kind involved in the present study.



