





Non-technical Summary
Abelisaurid dinosaurs were a group of theropod carnivores that primarily inhabited the Southern Hemisphere during the Cretaceous Period. One of their most remarkable features is a striking variety of cranial ornaments, which included roughened areas on the snout and around the eyes, midline knobs, and paired structures such as the horn-like projections of Carnotaurus. However, the evolution of these features over time has remained largely unexplored. In this study, we investigated the evolution of these ornaments and what they might reveal about the social and sexual behaviors of abelisaurids. Our results indicate that ornamentation did not evolve randomly but followed specific directional patterns, with certain structures becoming fixed early in abelisaurid history. Surprisingly, body size and ornamentation evolved independently; larger species were not necessarily more ornamented. Later, during the Late Cretaceous, groups such as Carnotaurini and Majungasaurinae developed even more elaborate features, including bony knobs, paired projections, and reinforced skull regions, which may have been used for visual display or social interactions. Overall, our findings suggest that abelisaurid skull ornaments were shaped primarily by sexual selection, highlighting the significance of visual signaling in the evolution of these remarkable predators.
Introduction
Since its initial proposition by Charles Darwin in On the Origin of Species (Darwin Reference Darwin1859), sexual selection has been recognized as a fundamental evolutionary mechanism driving phenotypic diversification. Darwin postulated this process to explain the evolution of traits involved in competition for mates. Afterward, biologists throughout the twentieth and twenty-first centuries identified a vast array of animal traits shaped by both intra- and intersexual competition for mates and other resources (e.g., Berglund et al. Reference Berglund, Bisazza and Pilastro1996; Andersson and Simmons Reference Andersson and Simmons2006). In this context, the evolution and maintenance of ornamental traits in both males and females are often attributed to sexual selection (Andersson and Simmons Reference Andersson and Simmons2006; Candolin and Tukiainen Reference Candolin and Tukiainen2015). Furthermore, sexual selection does not act in isolation; it frequently interacts with natural selection in complex ways, which can constrain the form and function of these secondary sexual traits (Stuart-Fox and Ord Reference Stuart-Fox and Ord2004). Among living species, sociosexual trait evolution has been extensively studied. Studies in birds have demonstrated not only a striking diversity of plumage coloration and ornate morphological traits (Greene et al. Reference Greene, Lyon, Muehter, Ratcliffe, Oliver and Boag2000; Felice and Goswami Reference Felice and Goswami2018) but also elaborate courtship behaviors (Price Reference Price1998). These collective findings underscore the central role of sexual selection in driving phenotypic evolution among extant species.
Extinct species are no exception to this pattern, and dinosaurs exhibit a remarkable diversity of ornamental structures (Knell and Sampson Reference Knell and Sampson2011; Padian and Horner Reference Padian and Horner2011; Hone et al. Reference Hone, Naish and Cuthill2012; Brown and Henderson Reference Brown and Henderson2015; Sullivan and Xu Reference Sullivan and Xu2017; Knapp et al. Reference Knapp, Knell, Farke, Loewen and Hone2018; Saitta et al. Reference Saitta, Stockdale, Longrich, Bonhomme, Benton, Cuthill and Makovicky2020). Theropods, for instance, display highly diverse bony cranial ornamentation (Sampson and Witmer Reference Sampson and Witmer2007; Gates et al. Reference Gates, Organ and Zanno2016), which has been linked to the rapid evolution of gigantic theropod dinosaurs (Gates et al. Reference Gates, Organ and Zanno2016). Among ornithischians (Sullivan and Xu Reference Sullivan and Xu2017), the jugal bone was highly variable and often adorned with ornamental features such as horns, flanges, and rugosities. Ceratopsians, in particular, are recognized for their extensive cranial ornamentation, displaying a wide range of nasal and postorbital horn morphologies, contributing to their remarkable disparity (Knapp et al. Reference Knapp, Knell, Farke, Loewen and Hone2018). Thus, ornamentation evolved independently across different dinosaur lineages, taking on diverse forms and potentially several functions.
The evolutionary drivers of dinosaur ornamentation remain contentious, with four primary hypotheses under debate: mechanical function, sexual selection, social selection, and species recognition. Padian and Horner (Reference Padian and Horner2011) claimed species recognition as a potential key mechanism, proposing two diagnostic criteria for this hypothesis: (1) the rapid, nondirectional evolution of distinctive ornamentation and (2) geographic overlap among coexisting species exhibiting such traits. However, Knell and Sampson (Reference Knell and Sampson2011) countered this framework, arguing that robust tests of adaptive hypotheses require mapping phenotypic characters onto independently reconstructed phylogenies to assess evidence for the evolutionary assembly of adaptations.
Knell and Sampson (Reference Knell and Sampson2011) challenge Padian and Horner (Reference Padian and Horner2011) on three key points: (1) the need for a direct correlation between sexual dimorphism and sexual selection, (2) the required association of sexual selection with directional evolutionary patterns, and (3) the empirical support for geographic overlap among related species bearing elaborate morphological structures. To address these limitations, Knell and Sampson (Reference Knell and Sampson2011) advocate for an expanded suite of diagnostic criteria to rigorously evaluate the species recognition hypothesis. Extending this limitation, Hone and Naish (Reference Hone and Naish2013) further questioned the explanatory power of the species recognition hypothesis for exaggerated structures in non-avian dinosaurs. They argued that (1) the often nondirectional and heterogeneous patterns of ornament diversification, (2) the occurrence of sympatric species bearing elaborate cranial ornaments, and (3) the general lack of clear sexual dimorphism in the fossil record cannot be explained by the species recognition hypothesis. The authors state that certain exaggerated traits can arise through both random and directional selection, and mutual sexual selection might obscure the visibility of sexual dimorphism. Additionally, closely related species can coexist in the same habitat without the presence of their more plainly adorned relatives, which challenges key predictions made by the species recognition model. Empirical support for these arguments was later provided, for instances by Knapp et al. (Reference Knapp, Knell, Farke, Loewen and Hone2018), who tested Padian and Horner’s second prediction in ceratopsians. Their results showed that sympatric ceratopsian species do not differ significantly in ornament disparity from non-sympatric taxa, despite rapid divergence in cranial ornamentation. This pattern is more consistent with sexual selection driving ornament evolution than with species recognition, reinforcing the view that elaborate cranial structures in dinosaurs require explanations that go beyond taxonomic signaling alone. A broader synthesis of signaling theory and its relevance to dinosaur behavior is provided by Hone (Reference Hone2024), who reviews visual, tactile, and multimodal signaling in extinct archosaurs.
Abelisauridae is the most abundant and well-documented clade of theropod dinosaurs that inhabited the ancient continent of Gondwana from the Early Jurassic to the end of the Cretaceous (Novas et al. Reference Novas, Agnolín, Ezcurra, Porfiri and Canale2013; Filippi et al. Reference Filippi, Méndez, Valieri and Garrido2016; Gianechini et al. Reference Gianechini, Méndez, Filippi, Paulina-Carabajal, Juárez-Valieri and Garrido2020; Baiano et al. Reference Baiano, Pol, Bellardini, Windholz, Cerda, Garrido and Coria2022; Pol et al. Reference Pol, Baiano, Černý, Novas, Cerda and Pittman2024). Since their recognition more than 40 years ago, members of this group have been identified in various regions (Sampson and Witmer Reference Sampson and Witmer2007; Novas et al. Reference Novas, Chatterjee, Rudra, Datta and Bandyopadhyay2010; Tortosa et al. Reference Tortosa, Buffetaut, Vialle, Dutour, Turini and Cheylan2014; Filippi et al. Reference Filippi, Méndez, Valieri and Garrido2016; Zaher et al. Reference Zaher, Pol, Navarro, Delcourt and Carvalho2020), including India, Madagascar, northern Africa, southern France, Brazil, and primarily Argentina. Like other dinosaur lineages that exhibit cranial ornamentation, abelisaurids display a remarkable variety of ornamental structures, mainly consisting of rugosities, pits, and grooves on the rostrum, orbital region, and skull roof (Carrano and Sampson Reference Carrano and Sampson2008; Filippi et al. Reference Filippi, Méndez, Valieri and Garrido2016; Gianechini et al. Reference Gianechini, Méndez, Filippi, Paulina-Carabajal, Juárez-Valieri and Garrido2020; Zaher et al. Reference Zaher, Pol, Navarro, Delcourt and Carvalho2020). Additionally, some abelisaurid taxa exhibit distinct patterns of skull roof ornamentation. A midline arrangement of knobs is observed in Indo-Madagascar taxa (Sampson and Witmer Reference Sampson and Witmer2007; Carrano and Sampson Reference Carrano and Sampson2008; Novas et al. Reference Novas, Chatterjee, Rudra, Datta and Bandyopadhyay2010), while other abelisaurids from South America, such as Abelisaurus (Bonaparte and Novas Reference Bonaparte and Novas1985), display paired structures, which reach their most extreme form as prominent horns in Carnotaurus (Cerroni et al. Reference Cerroni, Canale and Novas2021). This pronounced cranial ornamentation, together with other distinctive cranial and postcranial traits (e.g., reinforced skull roofs, reduced forelimbs, and robust cervical musculature), has led several authors to hypothesize that Late Cretaceous abelisaurids may have had antagonistic behaviors, such as low-displacement headbutting or shoving contests (e.g., Delcourt Reference Delcourt2018). Such behaviors suggest a potential role for sociosexual selection in shaping these cranial structures, either through intrasexual competition or as visual signals of individual quality. However, despite the striking diversity of cranial ornamentation in Abelisauridae, the species recognition hypothesis and the evolutionary trajectories of these structures have not yet been rigorously evaluated within a comprehensive phylogenetic comparative framework.
A quantitative macroevolutionary framework provides a powerful tool for understanding the origin and function of unusual traits in fossil taxa, offering essential insights into macroevolutionary patterns over time. In this context, phylogenetic comparative methods offer analytical approaches to quantitatively explore evolutionary modes and tempos within an explicit phylogenetic framework (Harmon Reference Harmon2019; Revell and Harmon Reference Revell and Harmon2022), applicable to extant and extinct taxa. Using discrete ornamentation characters of Abelisauridae, traditionally used to estimate their phylogenetic relationships (Carrano and Sampson Reference Carrano and Sampson2008), we aimed to: (1) determine the model of evolution of each ornaments in Abelisauridae; (2) estimate ancestral states for each kind of ornament trait; (3) evaluate the correlation between different cranial sculptured structures (rostral, orbit, and skull roof) and between types of ornaments (sculptured morphology, midline and pairs lateral ornaments); (4) assess whether the degree of ornamentation followed an allometric pattern during the evolution of Abelisauridae body size; and finally, (5) test the species recognition hypothesis in Abelisauridae.
In this context, we assess whether the evolutionary patterns observed are more aligned with the predictions of sexual selection or if they are more consistent with the species recognition hypothesis, which predicts nondirectional or random patterns.
Material and Methods
Discrete Character Data
Three discrete characters of ornamentation (characters 1, 2, and 24) were taken from the phylogenetic matrix of Pol et al. (Reference Pol, Baiano, Černý, Novas, Cerda and Pittman2024) (the most recent phylogenetic matrix published examining abelisauroid relationships). These characters were previously defined by Carrano and Sampson (Reference Carrano and Sampson2008) and exhaustively used by different authors to study the phylogenetic relationship of Abelisauridae and Noasauridae (Canale et al. Reference Canale, Scanferla, Agnolin and Novas2009; Filippi et al. Reference Filippi, Méndez, Valieri and Garrido2016; Gianechini et al. Reference Gianechini, Méndez, Filippi, Paulina-Carabajal, Juárez-Valieri and Garrido2020; Aranciaga Rolando et al. Reference Aranciaga Rolando, Cerroni, Marsà, Agnolín, Motta, Rozadilla, Eglí and Novas2021; Baiano et al. Reference Baiano, Pol, Bellardini, Windholz, Cerda, Garrido and Coria2022). Rugosities, pits, and grooves (sculptured) in Abelisauridae characterize the rostral and orbital ornamentation (Carrano and Sampson Reference Carrano and Sampson2008). At the same time, the skull roof not only presents a sculptured nature but also a midline knob or horn, as in Majungasaurus (Fig. 1E,F) (Sampson and Witmer Reference Sampson and Witmer2007) and paired structures (Fig. 1G,H), reaching well-developed horns, as in Carnotaurus (Cerroni et al. Reference Cerroni, Canale and Novas2021). However, the sculptured nature of the skull roof is not considered a character state in traditional phylogenetic analysis (e.g., Llukalkan, Viavenator; Fig. 1C,D), and abelisaurids with midline knobs or paired structures also present sculptured features in the skull roof (Filippi et al. Reference Filippi, Méndez, Valieri and Garrido2016; Gianechini et al. Reference Gianechini, Méndez, Filippi, Paulina-Carabajal, Juárez-Valieri and Garrido2020; Aranciaga Rolando et al. Reference Aranciaga Rolando, Cerroni, Marsà, Agnolín, Motta, Rozadilla, Eglí and Novas2021; Fig. 1E–H). Furthermore, we added a new discrete character to the analysis to recodify the skull roof ornamentation character to further evaluate the evolution of ornamentation in this cranial region. We called this new discrete trait “skull roof sculptured” (SRS), with the following states: none sculptured (0) (Fig. 1A), only sculptured (1) (Fig. 1C,D), knobs or horns positioned on the midline plus sculptured skull roof (Fig. 1E,F), and knobs or horns laterally positioned plus sculptured skull roof (3) (Fig. 1G,H). Thus, this new discrete trait allowed us to make inferences about the phylogenetic correlation between the same and different types of ornaments during the evolution of Abelisauridae and test the effect of the new state during the evolution of abelisaurid ornament evolution, which is widely present in Late Cretaceous brachyrostran and furileusaurian abelisaurids (Filippi et al. Reference Filippi, Méndez, Valieri and Garrido2016; Gianechini et al. Reference Gianechini, Méndez, Filippi, Paulina-Carabajal, Juárez-Valieri and Garrido2020; Aranciaga Rolando et al. Reference Aranciaga Rolando, Cerroni, Marsà, Agnolín, Motta, Rozadilla, Eglí and Novas2021). Dilophosaurus was coded as none in the SRS character to better observe the relationship between different ornamented regions in Abelisauridae. Thus, the characters used were the following:
-
• We define the external surface texture of the maxilla and nasal bones as a phylogenetic character (rostral ornamentation [RO]), with two discrete states: smooth (0) and sculptured (1).
-
• The external surface of the postorbital, jugal, and lacrimal, which has two states: smooth (0) and sculptured (1). Here, we refer to these characters as orbit ornamentation (OO)
-
• Within Abelisauridae, skull roof ornamentation (SRO) exhibits notable positional variability, with taxa differing in the placement of these keratinous and/or bony projections, either centralized along the midline or distributed as symmetrical lateral pairs. We define SRO as a morphological character with three discrete states: absent (0): no ornamentation present; midline (1): diagnostic knobs or horns restricted to the dorsal midline (e.g., as a single median structure); and lateral (2): paired ornamentation positioned laterally (e.g., bilateral horns).
-
• Skull roof sculptured (SRS), which has four states: none sculptured (0), only sculptured (1), knobs or horns positioned on the midline plus sculptured skull roof (2), and knobs or horns laterally positioned plus sculptured skull roof (3).
Skull ornamentation in Abelisauridae. A,B, Neurocranium of Eoabelisaurus (MPEF PV 3990) in dorsal (A) and dorsolateral (B) with non-sculptured skull roof; C, neurocranium of Llukalkan (MAU-Pv-LI-581) in dorsal view with sculptured skull roof; D, neurocranium of Viavenator (MAU-PV-530) in dorsal view with sculptured skull roof; E,F, neurocranium cast of Majungasaurus (FMNH PR 2100) in dorsal (E) and dorsolateral (F) view with sculptured skull roof and a horn positioned on the midline; G,H, skull of Carnotaurus (MACN Pv-CH 894) in anterodorsal (G) and dorsolateral (H) view with sculptured skull roof and paired horns laterally positioned. Figures not in scale.

These traits are considered ornamental because (1) in a strictly morphological sense, they either form discrete bony projections (e.g., paired horns and median knobs) or produce conspicuous surface textures that would have generated marked reliefs in the overlying soft tissues in life (e.g., rugosities, grooves, and pits); and (2) in the case of horns and knobs, their exaggerated morphology has also been commonly interpreted as consistent with roles in antagonistic interactions or mate choice (e.g., Delcourt Reference Delcourt2018), as predicted under sexual selection frameworks. As such, these features constitute externally visible cranial elaborations rather than structures primarily associated with feeding or sensory functions.
Some abelisaurid taxa included in our analyses are represented by specimens interpreted as juvenile or subadult (e.g., Llukalkan; Gianechini et al. Reference Gianechini, Méndez, Filippi, Paulina-Carabajal, Juárez-Valieri and Garrido2020) or present ontogenetic series (Majungasaurus; Ratsimbaholison et al. Reference Ratsimbaholison, Felice and O’Connor2016). However, their inclusion does not bias our results, because these individuals already exhibit well-developed cranial ornamentation, including rugosities and sculptured bone surfaces comparable in anatomical distribution to those observed in adult abelisaurids. Consequently, the presence and regional expression of cranial ornaments can be reliably assessed regardless of ontogenetic stage (Lee and Werning Reference Lee and Werning2008). Because our analyses focus on the occurrence, distribution, and integration of ornamental structures rather than their absolute size or degree of hypertrophy, variation related to ontogenetic stage is unlikely to affect the inferred evolutionary patterns.
Phylogenetic Hypothesis
The phylogenetic framework for this analysis was based on the maximum clade credibility tree from Pol et al. (Reference Pol, Baiano, Černý, Novas, Cerda and Pittman2024), which provides the most comprehensive sampling of ceratosaurid taxa to date. To contextualize the evolution of abelisaurid traits, outgroup taxa (Herrerasaurus, “Syntarsus”, Dilophosaurus, and Allosaurus) were added, thereby incorporating character state data from a broader phylogenetic scope. The comparative phylogenetic methods used here require a time-calibrated phylogenetic tree. As a result, the Bayesian topology of Pol et al. (Reference Pol, Baiano, Černý, Novas, Cerda and Pittman2024) was time calibrated with the stochastic cal3 method implemented in the R package paleotree (v. 3.4.7) (Bapst Reference Bapst2012) with the cal3 function. The range of chronostratigraphic uncertainty of each species included in the tree was obtained from the Paleobiology Database (https://paleobiodb.org; accessed January 2025). Each calculation, based on a different set of branch, extinction, and sampling rates, retained 10 trees, which resulted in 780 time-calibrated trees. We generated a final tree with mean branch lengths using the function consensus.edges of the phytools package (v. 2-4-4) (Revell Reference Revell2024), and all zero-length branches were replaced with 0.1 million years.
Missing Values
Abelisaurid fossils are frequently fragmentary and often lack cranial elements. Consequently, species terminals in the phylogenetic data matrix were scored as missing for many ornamentation characters. To maximize taxonomic inclusion and statistical power for macroevolutionary inferences, we estimated these missing character states based on the phylogenetic position of each taxon (see Supplementary Data 1) following the protocol established by Gates et al. (Reference Gates, Organ and Zanno2016). These estimations were performed under a parsimony framework. To assess the impact of these estimations on our conclusions, we conducted a sensitivity analysis (see following section).
Phylogenetic Comparative Methods
Discrete Character Evolutionary Modeling and Ancestral State Reconstruction
To identify the optimal evolutionary model for ornamentation evolution in Abelisauridae, we compared four Markov-Kernel models using the fitDiscrete function in the geiger package (v. 2.0.11) (Pennell et al. Reference Pennell, Eastman, Slater, Brown, Uyeda, FitzJohn, Alfaro and Harmon2014). These models were fit to discrete character data representing states of cranial ornamentation across a phylogenetic framework.
The five models tested were:
-
• Equal rates (ER): a one-parameter model in which all transition rates are equal.
-
• Symmetric (SYM): a model in which forward and reverse transition rates between any two states are symmetric.
-
• All-rates-different (ARD): a model in which each transition rate between character states is a unique parameter
-
• Ordered (ORD): a model in which the transition rate between character states occurs in an ordered trend.
-
• Directional (DM): a model in which the transition rate between character states occurs without skipping intermediate steps or with directionality.
In DM, RO, and OO, characters were from 0 → 1. This model was based on the observation of Carrano and Sampson (Reference Carrano and Sampson2008) and the fossil record, in which the sculptured nature is a synapomorphy of Abelisauridae, and once the sculptured morphology was acquired in Abelisauridae, it was not lost. In the DM model, the SRO character changed from 0 to 1 and from 1 to 2. Meanwhile, in the SRS model, it changed from 0 to 1, 1 to 2, and finally from 2 to 3. In this case, DM is based on the assumption that once ornaments are acquired, they cannot be lost, and for acquired lateral ornamentation, that it first has to be acquired medial ornamentation. The ORD model was specific to SRO and SRS. This model was based on the assumption that once ornaments are acquired, not only can they not be lost, but also ornaments (knobs and horns) are acquired on midline or lateral regions of the skull roof, allowing the following changes: 0 → 1 and 0 → 2. In the case of SRS, which has one more state (only sculptured), the allowed changes were 0 → 1, 1 → 2, and 1 → 3. Thus, to acquire midline or paired ornaments as knobs or horns, first the character state has to evolve in a sculptured skull roof.
We compared the fit of these evolutionary models using Akaike information criterion weights (AICw) with the aic.w function in phytools (v. 2-4-4) (Revell Reference Revell2024). Subsequently, we reconstructed ancestral character states for each ornamentation trait using stochastic character mapping under the best-fit model. This was implemented with the make.simmap function in the phytools R package (v. 2-4-4) (Revell Reference Revell2024).
We generated 10,000 stochastic character maps by sampling from the posterior distribution of ancestral states at the internal nodes of the Abelisauridae phylogenetic tree, conditioned on the maximum likelihood transition matrix. The results from all maps were summarized to estimate the number of state changes and the posterior probabilities of each character state at each node.
In this context, directional evolutionary patterns inferred from model-fitting analyses are interpreted as being more consistent with expectations of sexual selection, whereas stochastic or nondirectional patterns are treated as more compatible with predictions of the species recognition hypothesis, following the conceptual frameworks discussed by Padian and Horner (Reference Padian and Horner2011) and Hone and Naish (Reference Hone and Naish2013).
Phylogenetic Signal
We quantified the phylogenetic signal for each ornamentation character using Pagel’s λ (Pagel Reference Pagel1999) and Blomberg’s K (Blomberg et al. Reference Blomberg, Garland and Ives2003). These two complementary statistics allow a robust assessment of how much phylogenetic history shapes trait distribution. λ is a tree-scaling parameter that evaluates whether the correlation of trait values among species matches the expected covariance under Brownian motion, making it suitable for both continuous and discrete characters. In contrast, K compares the observed variance of a trait across the phylogeny to that expected under Brownian motion, providing a standardized measure of signal strength. Using both approaches provides a more complete view, as λ tests whether phylogenetic dependence exists at all, while K indicates whether traits are more or less conserved than expected under Brownian motion. While λ and K values approaching 1 indicate a strong phylogenetic signal, consistent with Brownian evolution, values near 0 suggest independence from phylogeny. The analysis was performed using the fitDiscret function from the geiger package (v. 2.0.11) (Pennell et al. Reference Pennell, Eastman, Slater, Brown, Uyeda, FitzJohn, Alfaro and Harmon2014).
Phylogenetic Correlation Analysis and Phylogenetic Linear Regression
We tested whether the evolution of ornamentation in the abelisaurid rostrum, orbit, and skull roof (knobs and horns, and the sculptured feature) was evolutionarily coupled using the threshold model. Threshold models work by modeling the evolution of a discrete character, which is determined by an unobserved continuous character evolving under a Brownian evolution model (called liability). When the liability crosses a certain threshold value, the discrete state characters change (for more details, see Harmon Reference Harmon2019; Revell Reference Revell2024). Thus, two discrete characters share an evolutionary correlation if the state of one character affects the transition rates of a second trait. The threshBayes function of the phytool package (v. 2-4-4) (Revell Reference Revell2024) was employed to assess the phylogenetic correlation between ornamentation discrete characters. This function uses Bayesian inference, so the number of generations was set to 10 million to ensure confident results. The posterior density of the correlation parameter (r) was plotted, and the 95% high-probability density interval around r was computed. Thus, an evolutionary correlation between two characters is inferred when the confidence interval does not include 0.
To investigate the relationship between body size and cranial ornamentation (the smooth/sculptured nature of rostral, orbital skull regions, and skull roof ornaments) in abelisaurids, we employed phylogenetic generalized least squares (PGLS) regression as implemented in the package caper (Orme et al. Reference Orme, Freckleton, Thomas, Petzoldt, Fritz, Isaac and Pearse2013). The response variable, the ornamentation index (OI), is an ordinal score ranging from 0 to 5 that summarizes the degree of cranial ornamentation. This index was established following the methodology outlined by Agresti et al. (Reference Agresti, Booth, Hobert and Caffo2000) and Christensen (Reference Christensen2018). For instance, Ceratosaurus, which bears a nasal horn, was assigned an index of 1, while Carnotaurus, which exhibits sculptured ornamentation on the rostral, orbital, and skull roof regions along with paired cranial structures (horns), received an index of 5. The predictor variable was the natural logarithm of body length (logBL), taken from Pereyra et al. (Reference Pereyra, Pérez and Méndez2025b), as a proxy for body size, given the lack of reliable body-mass estimates due to the absence of femoral circumference data in Abelisauridae.
We fit three competing functional models modeled through λ-transformation (Pagel Reference Pagel1999) of the relationship between logBL and OI: a linear model (Index ~ logBL), a quadratic model (Index ~ logBL + logBL²), and a cubic model (Index ~ logBL + logBL² + logBL³). The quadratic term was included to test whether ornamentation complexity peaked at intermediate body sizes, while the cubic term allowed exploration of more complex nonlinear allometric trends. Model fit was compared using AICw with the aic.w function in phytools (v. 2-4-4) (Revell Reference Revell2024).
Thus, our approach explicitly tested whether the accumulation of cranial ornamentation in Abelisauridae was evolutionarily associated with body size, and whether such a relationship followed a simple linear scaling pattern or showed evidence of nonlinear allometric peaks, consistent with previous hypotheses that cranial ornamentation was not strictly proportional to body size among ceratosaurian theropods (Pereyra et al. Reference Pereyra, Pérez and Méndez2025b).
Sensitivity Analysis
Because coding taxa with missing values could introduce bias in our results, and the adopted approach was parsimony based, which has received severe criticism (Revell Reference Revell2025), a sensitivity analysis was performed to test our results more comprehensively. We repeated all the analyses described by removing taxa with missing values, and then the results were compared.
All ornament data and R scripts with phylogenetic comparative analysis can be found in the public repository Zenodo (https://doi.org/10.5281/zenodo.17078479).
Results
Phylogenetic Signal
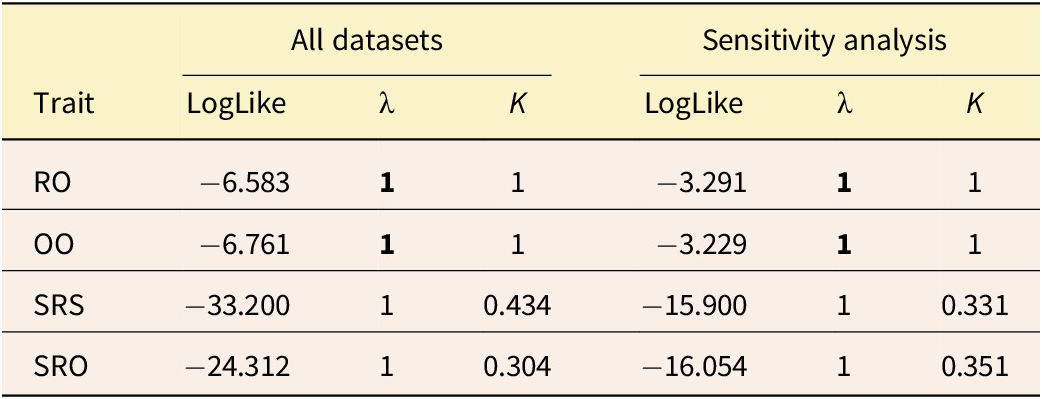
The RO and OO ornamentation characters exhibited significantly higher values of λ and K phylogenetic signals (see Table 1). In contrast, SRO and SRS showed lower K values but higher λ values; however, these results were not statistically significant. The sensitivity analysis conducted to evaluate the impact of estimated missing values revealed a consistent pattern of phylogenetic signal across each ornamentation trait.
Phylogenetic signal assessment for cranial ornamentation characters across the full dataset and sensitivity analyses. Characters include rostral ornamentation (RO), orbital ornamentation (OO), skull roof rugosity (SRS), and skull roof ornamentation (SRO). Metrics: log-likelihood (LogLike) and Pagel’s lambda (λ). Bold values indicate statistically significant phylogenetic signal (α = 0.05).

Ancestral State Reconstruction and Evolutionary Modeling
The DM model was selected as the best-fit model for the evolution of RO and OO (Supplementary Data 2, Tables 1, 2). Reconstruction of the ancestral modes of ornamentation and the DM model indicated that once the sculptured morphology was acquired during the Lower Cretaceous in the rostral and orbital region, the character state was not reverted to the smooth state (Fig. 2A, and Supplementary Data 2, Fig. 1A). Additionally, the acquisition of rostrum and orbital rugosities during the Late Jurassic had low posterior probabilities. The transition rate between states was identical for rostral and orbital ornamentation, with a rate of 0.00252 (Fig. 2B, and Supplementary Data 2, Fig. 1B).
A, Ancestral state reconstruction of rostrum ornaments estimated from stochastic character mapping. The tree is based on a summary of 10,000 replicates using a directional-rate model. Pie charts at the nodes represent posterior probabilities of ancestral state reconstruction for all nodes. B, Transition rates estimated from a directional model of rostrum ornament evolution.

The ER model (Supplementary Data 2, Table 3) was selected as the best-fit model for the evolution of SRO (Supplementary Data 2, Table 3). The estimated transition rate between none, midline, and paired lateral ornamentation was equal between states (Fig. 3B). Additionally, the ancestral state reconstruction showed that paired structures emerged later than midline ornamentation and were particularly present in Carnotaurini and Abelisaurus.
A, Ancestral state reconstruction of skull roof ornamentation (SRO) estimated from stochastic character mapping. The tree is based on a summary of 10,000 replicates using a directional-rate model (DM). Pie charts at the nodes represent posterior probabilities of ancestral state reconstruction for all nodes. B, Transition rates estimated from the equal rate (ER) model of skull roof ornamentation.

The SYM model was selected as the best-fit model for the evolution of SRS (Supplementary Data 2, Table 4). Reconstruction of ancestral states showed the same probabilities in acquiring sculptured, midline plus sculptured skull roof, and pairs lateral structure plus sculptured skull roof during Late Cretaceous (Fig. 4A), where late Early Cretaceous diverging abelisaurids (e.g., Rugops), Furileusaurian abelisaurids, and Abelisaurus were observed with the pairs lateral state (Fig. 4A). In contrast, Majungasaurinae and Kryptops showed the midline state. The transition rates of the SYM model for SRS showed a 0 transition rate between none and midline plus rugose skull roof states (Fig. 4B) and a 0 transition rate between none and pairs lateral plus skull roof states (Fig. 4B). Additionally, the higher transition rate was observed between none and only sculptured (rugose), followed by the transition rate between only sculptured and midline plus rugose skull roof states. The transition rate between only rugose skull and pairs lateral plus rugose skull roof showed the lowest value (Fig. 4B).
Ancestral state reconstruction and transition dynamics of skull roof rugosities. A, Stochastic character mapping of rugosity states across 10,000 replicates under a directional-rate model (DM). Pie charts at nodes represent posterior probabilities for ancestral states, illustrating the likelihood of smooth (0), sculptured (1), midline knobs (2), or lateral structures (3) at key evolutionary transitions. B, Transition rates between ornament states inferred under a symmetric model (SYM). C, Transition rates between ornament states inferred under an ordered model (ORD) in the sensitivity analysis. Rates quantify evolutionary shifts between states, with thicker arrows indicating higher transition rates (e.g., sculptured-to-midline transitions).

The sensitivity analysis remains consistent with the results obtained in evolutionary modeling and ancestral state reconstruction with estimated missing values (Supplementary Data 2, Figs. 2, 3). However, the best-fit model changed from a SYM model to an ORD model in the evolutionary modeling of SRS (Fig. 4C and Supplementary Data 2, Table 4). Additionally, the differences between transition rate values were higher in the sensitivity analysis than in all dataset analyses (Supplementary Data 2, Table 4).
Threshold Model and Phylogenetic Quadratic-Linear Regression
The threshold model showed evidence of significant phylogenetic correlation between rostral and orbital ornamentation (Supplementary Data 2, Table 5), while a phylogenetic correlation between rostral and skull roof ornaments (SRO and SRS) was not observed (Supplementary Data 2, Table 5). The same pattern was observed between orbit and skull roof ornamentation (Supplementary Data 2, Table 5). Additionally, a phylogenetic correlation between ornamentation traits and body length was not observed (Supplementary Data 2, Table 5). The same correlation pattern was observed in the sensitivity analysis.
When exploring the relationship between the cranial OI and log-transformed body size in Abelisauridae, species with higher ornamentation scores (OI = 3–5) tended to cluster around intermediate body sizes (~5.6 m) (Fig. 5). Model comparisons using PGLS revealed that the linear model had the best support both in the full dataset (AICw = 0.54) and in the sensitivity analysis (AICw = 0.66), whereas quadratic and cubic models received considerably lower support (Supplementary Data 2, Table 6). Parameter estimates from the linear PGLS indicated a positive association between log body size and OI, with slopes of 1.05 in the full dataset and 1.45 in the sensitivity analysis (Supplementary Data 2, Table 7). However, neither regression slope was statistically significant (Supplementary Data 2, Table 7), and the model R² values were very low, with confidence intervals including zero (Supplementary Data 2, Table 7). These results indicate that despite a visual trend of ornamented taxa clustering at intermediate sizes, phylogenetic regressions do not support a significant evolutionary correlation between body size and cranial ornamentation in Abelisauridae.
Scatter plot showing the relationship between cranial ornamentation index (OI) and body size (log-transformed) in Abelisauridae. Each point represents a species, illustrating the distribution of cranial ornamentation scores as a function of body size. The density curve at the top summarizes the overall distribution of body sizes in the dataset. Ceratosaurian silhouettes from PhyloPic highlight the positions of key taxa.

Discussion
The sculptured nature of abelisaurids has been considered a synapomorphy of this theropod clade (Carrano and Sampson Reference Carrano and Sampson2008). However, despite this well-documented feature, the evolution of cranial ornamentation in this lineage has remained largely unexplored within a phylogenetic comparative framework. Our phylogenetic comparative analyses reveal complex macroevolutionary patterns underlying cranial ornament evolution in Abelisauridae, providing the first quantitative assessment of ornament diversification in this remarkable theropod clade and establishing a framework for potentially understanding the selective forces that shaped these structures in non-avian theropods.
Directional Evolution and Developmental Canalization of Rostral and Orbital Ornamentation
The directional evolutionary model best explaining rostral and orbital ornamentation evolution demonstrates that ornaments on the rostrum and around the orbit exhibit directional evolutionary trends with high posterior probabilities of having originated during the Early Cretaceous. This pattern, combined with the significantly high phylogenetic signal detected for these characters (λ and K values approaching 1), indicates that once rugosities, pits, and grooves (sculptured) were acquired during the Early Cretaceous in the rostral and orbital regions, these features became evolutionarily canalized: a process whereby developmental and genetic mechanisms constrain trait variation along specific evolutionary trajectories. This canalization resulted in the irreversible fixation of these ornamental features throughout abelisaurid evolution, with character states never reverting to the smooth condition once acquired. The evolutionary canalization of sculptured morphology in the rostral and orbital regions may reflect either underlying developmental constraints or the action of stabilizing selection maintaining socially or functionally relevant signaling traits. The significant phylogenetic correlation observed between rostral and orbital ornamentation further supports this interpretation, suggesting that shared developmental pathways or regulatory networks controlled the expression of sculptured surfaces across these cranial regions. This developmental coupling likely reflects common underlying mechanisms of bone surface texture modification, possibly involving similar patterns of vascularization, integumentary attachment sites, or hormonal regulation during ontogeny.
Independent Evolution and Ordered Acquisition of Skull Roof Ornamentation
In contrast to the canalized evolution of rostral and orbital features, skull roof ornamentation (including rugosities, grooves, pits, midline knobs or horns, and paired structures) revealed a fundamentally different macroevolutionary pattern. The ordered evolutionary model best fitting this character demonstrates a structured, stepwise acquisition of increasingly elaborate ornamental features. This ordered pattern indicates that before the appearance of midline knobs in Majungasaurinae or paired structures in Carnotaurinae, a sculptured skull roof had to evolve first as a prerequisite evolutionary step during the Late Cretaceous.
The absence of phylogenetic correlation between skull roof ornaments and rostral/orbital features suggests a degree of evolutionary decoupling between these ornamental systems, which may reflect differences in selective regimes, developmental architectures, or the relative importance of overall signal size versus specific ornament configuration. This decoupling suggests that skull roof ornamentation responded to different functional demands than the earlier-appearing sculptured morphology on rostral and orbital regions, pointing toward specialized behavioral or signaling functions that emerged during the Late Cretaceous radiation of late-diverging abelisaurids.
Additionally, while the analysis with estimated missing data suggested a symmetrical evolutionary pathway from taxa with midline knobs or horns (Majungasaurinae) to those with paired structures (Carnotaurini), this transition is unlikely from a parsimonious evolutionary perspective, as it entailed the growth of different bones (under distinctly different patterns of development) and therefore would likely involve a significant ontogenetic reorganization of the skull or otherwise totally independent events from different modules (Felice and Goswami Reference Felice and Goswami2018; Yaryhin and Werneburg Reference Yaryhin and Werneburg2018). Moreover, the phylogenetic position of Abelisaurus, a South American abelisaurid with paired structures, within Majungasaurinae remains debated (Filippi et al. Reference Filippi, Méndez, Valieri and Garrido2016; Gianechini et al. Reference Gianechini, Méndez, Filippi, Paulina-Carabajal, Juárez-Valieri and Garrido2020; Pol et al. Reference Pol, Baiano, Černý, Novas, Cerda and Pittman2024). Although transitions between these conditions appear to be rare at a macroevolutionary scale, the apparent exception observed in Abelisaurus is best interpreted as a consequence of phylogenetic instability related to matrix construction rather than as evidence of a genuine evolutionary switch (Seculi et al. Reference Seculi, Pérez, Dionis and Ezcurra2025).
Regarding the ancestral state reconstruction of this ornamentation character, the analysis with estimated missing data indicated similar posterior probabilities for the emergence of a sculptured skull roof, sculptured plus midline knob or horn, and sculptured plus paired structures during the early Late Cretaceous. In contrast, the sensitivity analysis suggested an ~0.5 posterior probability for acquiring a sculptured skull roof during the middle Early Cretaceous, with a higher probability during the early Late Cretaceous. The sculptured skull roof with midline knobs or horns was inferred to have emerged with high probability during the Campanian (Late Cretaceous), while the condition with sculptured skull roof and paired structures, first observed in Carnotaurini, showed high probabilities of emerging during the Santonian (Late Cretaceous). This discrepancy between analyses may reflect differences in taxon sampling. Given the broad criticism of parsimony-based methods to estimate missing values (Revell Reference Revell2025), the sensitivity analysis results may be more robust and consistent with the fossil record.
The temporal sequence revealed by our ancestral state reconstructions—with sculptured skull roofs emerging during the early Late Cretaceous transition, followed by midline knobs in the Campanian and paired structures in the Santonian—indicates rapid morphological diversification coinciding with abelisaurid taxonomic radiation (Pol and Rauhut Reference Pol and Rauhut2012; Delcourt Reference Delcourt2018). This pattern parallels the evolution of elaborate ornamental diversity observed in ceratopsian dinosaurs during similar time frames in the Northern Hemisphere (Fowler Reference Fowler2017), suggesting that Late Cretaceous ecosystems may have provided particularly favorable conditions for the evolution of complex cranial display structures.
Sexual Selection as the Primary Evolutionary Driver
Rejection of the Species Recognition Hypothesis
Our results provide compelling evidence against the species recognition hypothesis proposed by Padian and Horner (Reference Padian and Horner2011) for explaining abelisaurid cranial ornamentation. Multiple lines of evidence contradict the key predictions of this hypothesis.
The species recognition hypothesis predicts that ornamental features should evolve in a largely stochastic or nondirectional manner, facilitating rapid species-specific differentiation. However, Hone and Naish (Reference Hone and Naish2013) emphasized that several core predictions of this hypothesis are problematic, noting that exaggerated traits may evolve under either random or directional processes, that mutual sexual selection can obscure patterns of sexual dimorphism, and that closely related sympatric species may coexist without unornamented relatives. Within this conceptual framework, we interpret the evolution of abelisaurid cranial ornamentation as more consistent with expectations of sexual selection when directional or ordered evolutionary patterns are recovered. Our analyses reveal evidence of directional evolution in rostral and orbital ornamentation, as well as ordered, stepwise evolutionary transitions in skull roof ornamentation. Rather than reflecting purely stochastic change, these patterns suggest structured evolutionary trajectories potentially shaped by selective and developmental constraints, and are therefore difficult to reconcile with strictly random-walk expectations under species recognition scenarios.
The species recognition hypothesis predicts that geographically overlapping species should exhibit maximally divergent ornamentation to minimize recognition errors. Contrary to this prediction, we observe that sympatric abelisaurid species display remarkably convergent ornamentation within geographic regions. For example, Indo-Madagascan taxa consistently exhibit midline knob arrangements despite representing distinct species that coexisted spatially and temporally. Similarly, South American Carnotaurini convergently evolved paired structures across multiple contemporaneous taxa. This pattern parallels findings in ceratopsian dinosaurs, where sympatric species were not found to differ significantly in their ornamental disparity from non-sympatric species (Knapp et al. Reference Knapp, Knell, Farke, Loewen and Hone2018). Additionally, abelisaurid ontogenetic trajectories revealed that the degree of surface texturing and the development of certain structures—such as the maxilla and the skull roof region bearing the median horn or knob—increase substantially through ontogeny (Ratsimbaholison et al. Reference Ratsimbaholison, Felice and O’Connor2016), along with overall horn size. This pattern of progressive elaboration is more consistent with sexual signaling than with strict species recognition, which would predict the early and stable expression of diagnostic traits.
The species recognition hypothesis assumes that ornamental structures should be relatively simple and low-cost to maintain rapid evolutionary turnover and lack of sexual dimorphism (Knell and Sampson Reference Knell and Sampson2011). However, abelisaurid ornaments demonstrate increasing complexity and elaboration through time, particularly in Late Cretaceous forms. The presence of cornified integumentary coverings, reinforced cervical regions, and complex three-dimensional skull roof structures suggests substantial developmental and metabolic costs inconsistent with simple species recognition functions (Hone et al. Reference Hone, Naish and Cuthill2012). Regarding sexual dimorphism, sexual variation is the most common pattern in animals generally and archosaurs specifically and is expected in extinct archosaurs, such as non-avian dinosaurs (Saitta et al. Reference Saitta, Stockdale, Longrich, Bonhomme, Benton, Cuthill and Makovicky2020). Moreover, the apparent lack of sexual dimorphism does not support the species recognition hypothesis, as this pattern can be readily explained by mutual sexual selection, in which both sexes express similar ornamental traits (Hone et al. Reference Hone, Naish and Cuthill2012; Hone and Naish Reference Hone and Naish2013; Saitta et al. Reference Saitta, Stockdale, Longrich, Bonhomme, Benton, Cuthill and Makovicky2020). Because explicit tests designed to detect sexual dimorphism—such as those developed by Saitta et al. (Reference Saitta, Stockdale, Longrich, Bonhomme, Benton, Cuthill and Makovicky2020)—have not been conducted for Abelisauridae, the presence or absence of dimorphism in this clade cannot be used as evidence in favor of the species recognition hypothesis. Instead, the evolutionary patterns recovered here, together with the relevant theoretical framework, are more consistent with sexual selection as the primary driver of cranial ornamentation in Abelisauridae.
Evidence for Sexual Selection Mechanisms
Multiple converging lines of evidence support sexual selection as the primary evolutionary driver of abelisaurid cranial ornamentation.
The progressive elaboration of abelisaurid ornaments, particularly the evolution from simple sculptured features (e.g., grooves, pits, and rugosities) to complex cornified structures with paired horns or midline knobs, aligns with predictions of honest signaling theory (Zahavi Reference Zahavi1975; Grafen Reference Grafen1990). Under this framework, ornamental traits function as reliable indicators of individual quality, because they impose significant costs that prevent low-quality individuals from expressing elaborate displays (Cotton et al. Reference Cotton, Fowler and Pomiankowski2004; Hill Reference Hill2011).
The evolution of cornified integumentary coverings in Carnotaurini and Majungasaurinae represents a particularly clear example of costly signaling. Cornified structures require substantial protein synthesis, specialized keratinization pathways, and ongoing metabolic investment for maintenance (McGraw and Ardia Reference McGraw and Ardia2003; Roberts et al. Reference Roberts, Buchanan and Evans2004). The presence of such metabolically expensive integumentary modifications suggests that these structures functioned as condition-dependent signals of individual health, genetic quality, or competitive ability, in line with classic predictions of sexual selection theory.
However, although large and massive ornamental structures evolved repeatedly in other dinosaurian lineages, the comparatively limited size and slower evolution of abelisaurid cranial ornaments suggest that costly signaling in this clade was likely shaped by trade-offs with other ecological demands. As proposed by Hone et al. (Reference Hone, Naish and Cuthill2012), conspicuous cranial signals in large carnivorous theropods may have been counterselected if they increased detectability by prey or interfered with hunting performance. Such constraints are consistent with our results, as the most complex abelisaurid cranial ornaments emerge relatively late in the clade’s evolutionary history, during the Late Cretaceous, coincident with a phase of rapid diversification and increasing specialization in feeding strategies (Pereyra Reference Pereyra2025; Pereyra et al. Reference Pereyra, Ezcurra, Paschetta and Méndez2025a,Reference Pereyra, Vrdoljak, Ezcurra, González-Dionis, Paschetta and Méndezc). This temporal pattern suggests that elaborate ornamentation was only favored once ecological performance thresholds had been achieved, allowing cranial structures initially shaped by functional demands to be further elaborated for sexual signaling.
The evidence of biomechanical studies for headbutting behavior in Late Cretaceous abelisaurids, particularly Carnotaurus, provides direct support for the intrasexual competition component of sexual selection (Mazzetta et al. Reference Mazzetta, Fariña and Vizcaíno1998; Delcourt Reference Delcourt2018). The combination of cornified cranial pads, reinforced cervical vertebrae, and robust skull architecture in Carnotaurini indicates adaptation for controlled aggressive interactions consistent with male–male competition for mates or territories. However, the biomechanical constraints identified by previous studies—indicating that abelisaurid skulls were better suited to low-velocity impacts rather than high-speed collisions—suggest a more nuanced behavioral repertoire than simple ramming combat (Mazzetta et al. Reference Mazzetta, Cisilino, Blanco and Calvo2009). The evidence points toward ritualized aggressive displays involving head-shoving, flank-butting, or intimidation posturing rather than destructive combat (Delcourt Reference Delcourt2018). This pattern resembles the behavioral ecology of many extant species wherein ornamental weapons serve dual functions as both competitive tools and visual displays (Snively et al. Reference Snively, Henderson and Phillips2006).
Importantly, recent macroevolutionary analyses indicate that cranial regions associated with head stabilization and feeding performance—particularly the occipital region, as well as the squamosal and quadratojugal—exhibit the highest evolutionary rates and strongest patterns of integration within the abelisaurid skull (Pereyra et al. Reference Pereyra, Ezcurra, Paschetta and Méndez2025a). These findings suggest that environmental and feeding-related pressures initially structured cranial evolution in Abelisauridae, with these mechanically relevant traits subsequently co-opted for sociosexual display. Such a scenario is consistent with the “feeding before display” hypothesis proposed for non-avian theropods (Pereyra et al. Reference Pereyra, Ezcurra, Paschetta and Méndez2025a), in which cranial modifications driven primarily by ecological specialization were later exapted for signaling and intraspecific competition. In abelisaurids, the Late Cretaceous emergence of hypermineralized cranial structures may therefore reflect a secondary phase of weaponization that facilitated intraspecific combat and visual signaling.
Temporal Evolution of Sexual Selection Mechanisms
Our phylogenetic analyses reveal a temporal progression in the complexity and likely function of sexual selection mechanisms in abelisaurid evolution.
The initial evolution of sculptured morphology of the rostral and orbital regions during the Early Cretaceous likely represents the establishment of basic condition-dependent signaling systems (Cotton et al. Reference Cotton, Fowler and Pomiankowski2004; Hill Reference Hill2011). These relatively simple surface modifications required minimal structural investment but provided reliable indicators of individual health, age, or genetic quality through their correlation with developmental stability and metabolic condition (Polak and Taylor Reference Polak and Taylor2007).
The ordered acquisition of skull roof ornamentation during the Late Cretaceous corresponds to the evolution of more sophisticated behavioral repertoires (Brown and Henderson Reference Brown and Henderson2015). The independent evolution of midline knobs in Majungasaurinae and paired structures in Carnotaurinae suggests lineage-specific behavioral specializations possibly reflecting different ecological contexts, social systems, or biomechanical constraints (West-Eberhard Reference West-Eberhard1983).
The development of cornified coverings and reinforced cranial architecture during this phase, as documented by the inferred timing of trait acquisition and shifts in transition rates recovered in our analyses, may indicate a transition from predominantly visual signaling to behaviorally integrated display systems incorporating both visual and tactile components (Partan and Marler Reference Partan and Marler1999; Candolin Reference Candolin2003; Hebets and Papaj Reference Hebets and Papaj2005). The co-occurrence of these traits suggests an increased coupling between display and physical interaction, potentially reflecting a shift toward more complex sexual signaling strategies. Under this interpretation, abelisaurid ornamentation may represent a more integrated form of sexual selection than simple honest visual signaling alone, while acknowledging that this scenario remains a hypothesis motivated rather than directly tested by our data. In summary, this integration of display and combat functions represents a more sophisticated level of sexual selection than the simple honest signaling of earlier forms (Lyon and Montgomerie Reference Lyon and Montgomerie2012; McCullough et al. Reference McCullough, Miller and Emlen2016).
Evolutionary Independence of Body Size and Ornamentation
Our comprehensive analysis of the relationship between body size and cranial ornamentation reveals a fundamental evolutionary decoupling between these traits in Abelisauridae, contradicting the previous hypothesis linking ornament evolution to giantism in theropod dinosaurs (Gates et al. Reference Gates, Organ and Zanno2016). Our results consistently indicate that cranial ornamentation and body size evolved largely independently within Ceratosauria. Threshold models did not detect significant correlations between body size and the presence of ornamentation in any specific cranial region. Likewise, PGLS analyses using the OI favored a simple linear model over more complex functional forms, yet regression slopes were not statistically significant, and explained variance was negligible. The absence of significant correlations between body size and ornamentation across all analytical approaches—threshold models for discrete traits and PGLS regression for cumulative OI—indicates that ornamental elaboration proceeded independently of body-size evolution. This pattern differs markedly from other theropod lineages where cranial ornamentation shows strong positive correlations with body mass (Gates et al. Reference Gates, Organ and Zanno2016), suggesting that ornament evolution in Ceratosauria, and especially Abelisauridae, was governed by distinct selective pressures. The evolutionary independence observed in Abelisauridae likely reflects the constrained body-size evolution within this clade, with most species falling within a relatively narrow size range (5–6 m total length). This size constraint may have been maintained by specialized ecological roles, particularly their apparent focus on medium-sized prey and specific feeding strategies that favored medium body sizes rather than giantism (Pereyra et al. Reference Pereyra, Pérez and Méndez2025b).
Within this constrained size evolution, cranial ornaments diversified independently as sociosexual signaling systems responding to intraspecific behavioral demands rather than allometric scaling patterns. This decoupling indicates that, within Abelisauridae, cranial ornamentation evolved largely independently of overall body size, underscoring the need to evaluate ornament evolution separately from body-size dynamics when testing size-driven hypotheses of macroevolutionary trends.
Evolutionary Implication and Future Research Direction
Abelisaurus has been recovered within the Indo-Madagascan lineage in the most recent phylogenetic analyses. Under this phylogenetic framework, Indo-Madagascan taxa exhibit a remarkable diversity of cranial ornamentation, and Abelisaurus represents a convergence case of the acquisition of paired structures. On the other hand, the midline knob shows notable variation among Indo-Madagascar taxa (Sampson and Witmer Reference Sampson and Witmer2007; Carrano and Sampson Reference Carrano and Sampson2008; Novas et al. Reference Novas, Chatterjee, Rudra, Datta and Bandyopadhyay2010). Similarly, South American abelisaurids also exhibit distinct ornamentation patterns. Furileusaurian abelisaurids are characterized by the presence of rugosities, grooves, and pits on the rostrum, orbit, and skull roof (Paulina-Carabajal et al. Reference Paulina-Carabajal, Ulloa-Guaiquín, Filippi, Méndez, Lee and Lee2023), while Carnotaurini evolved different skull roof ornamentation, including paired structures that reached their most extreme form as prominent horns in Carnotaurus (Cerroni et al. Reference Cerroni, Canale and Novas2021). Moreover, Paulina-Carabajal et al. (Reference Paulina-Carabajal, Ulloa-Guaiquín, Filippi, Méndez, Lee and Lee2023) reported distinct patterns of skull roof ornamentation, particularly different rugosity forms, in various South American abelisaurids. Thus, ornament variation in Abelisauridae appears to be greater than previously expected. The diversity observed in skull roof ornamentation, along with the potential variation in rostral and orbital regions, suggests that these features were likely costly to maintain, potentially acting as “honest signals” of individual quality and fitness within species. Consequently, our findings support the hypothesis that the evolution of ornamentation in Abelisauridae was likely driven by sexual selection.
Our findings establish abelisaurid cranial ornamentation as a compelling example of constraint-mediated evolution operating at multiple temporal and organizational levels. The interplay between developmental canalization (rostral/orbital features), ordered acquisition sequences (skull roof features), and behavioral specialization (cornified structures) demonstrates the complex ways in which different evolutionary mechanisms can operate within the same organismal system.
The discovery of new abelisaurid taxa from the Jurassic and Early Cretaceous, along with more detailed cranial osteological studies of Late Cretaceous forms (e.g., Skorpiovenator, Ekrixinatosaurus), will provide critical tests for our proposed evolutionary scenario, particularly regarding the timing of ornament acquisition and the ancestral conditions that preceded ornamental evolution. Priority should be given to comprehensive morphological characterization of surface textures, integumentary attachment sites, and associated vascular patterns that provide insights into ornament function and development.
Future research should focus on biomechanical modeling that incorporates both skeletal and soft-tissue components to better understand the functional capabilities of abelisaurid ornamental systems. The integration of finite element analysis with realistic soft-tissue reconstructions will provide more accurate assessments of headbutting capabilities and behavioral repertoires than bone-only models. Additionally, comparative developmental analyses examining the genetic and regulatory mechanisms controlling cranial surface texture development in extant archosaurs will provide insights into the evolutionary origins and constraints affecting ornamental systems in extinct taxa. In addition, researchers should prioritize a detailed anatomical characterization and standardized categorization of these traits to further refine macroevolutionary inferences. Such studies may reveal conserved developmental pathways that explain the observed patterns of evolutionary correlation and independence among different ornamental regions.
The broader implications of our findings extend beyond abelisaurid paleobiology to fundamental questions about the evolution of complex signaling systems and the interplay between sexual selection and developmental constraint in shaping morphological diversity. The abelisaurid case study demonstrates that even within single organismal systems, different ornamental components can evolve under distinct selective regimes and constraints, highlighting the importance of trait-specific analyses in macroevolutionary investigations. Additionally, our methodological framework can be implemented for extant and extinct organisms, revealing the evolutionary dynamics of species ornaments or other discrete features in general.
Supplementary material
The supplementary material for this article can be found at http://doi.org/10.1017/pab.2026.10099.
Acknowledgments
We thank the journal editors, an anonymous reviewer, and M. Pitman for their thorough revisions that improved the final version of the article. We are grateful to the R Core Team for making R a free software and researchers who work on developing different ways to analyze phenotypic evolution in a phylogenetic framework. Additionally, we aim to highlight the severe lack of economic subsidies for scientific institutions and universities in Argentina, which critically hampers the advancement and quality of scientific research in our country. This work had no funding.
Competing Interests
The authors declare no competing interests.
Data Availability Statement
The R scripts for the calibration procedures and phylogenetic analyses, as well as all data used in this study (ornamentation characters, chronostratigraphic ages, and body size), are available on public repository Zenodo (https://doi.org/10.5281/zenodo.17078479). Supplementary materials are available on the Zenodo at https://zenodo.org/records/17078480 (Enzo Emanuel Reference Enzo Emanuel2025).
Author Contribution
E.E.S.P. wrote the main manuscript, developed the methodology, and conducted the phylogenetic analyses. I.M.S. contributed to the study design, performed phylogenetic analyses, and reviewed the manuscript. D.E.P. prepared the figures and reviewed the manuscript.



 Open access

