


Introduction: what is dumping?
Dumping is a term used in trade circles to refer to the practice of selling goods abroad for less than they are sold for at home. Dumping is legal under the World Trade Organization (WTO) agreements unless a member state can prove not just that dumping has occurred, but also that it is harming domestic producers. Governments may help a sector make the dumping case, but there must be a wronged party: commercial actors who can demonstrate how their economic interests are being hurt. In theory, economies should count underpriced goods as a good thing because they raise consumer welfare by lowering costs. In practice, however, dumping hurts domestic producers’ economic interests. And domestic producer organizations have more political clout than do consumers, who are usually ignorant or indifferent to relatively small welfare gains that are spread over millions of people. Lost livelihoods are more politically salient (Mahé and Roe, Reference Mahé and Roe1996). Trade agreements include provisions to counter dumping if the complainant proves their case, for example, with additional tariffs or quotas on import volumes. And some countries, prominent among them the USA, have anti-dumping measures in their domestic legislation as well. Dumping is usually assumed to be a conscious strategy. For example, recognizing that an export market is more competitive than their domestic market, a firm might choose to sell their good for less in that market than they charge in their home country, where they may enjoy a less competitive market. The strategy might be temporary, used as a way to establish a competitive share of the market, or to drive competitors out of business. Or it might remain in place for a long time, depending on how financially viable the strategy is. The dumping discussed in this article, however, is not a conscious strategy so much as the result of a confluence of policy choices.
The Institute for Agriculture and Trade Policy (IATP) first published a policy paper that documented the dumping of US-grown agricultural commodities in international markets in 1998, following a methodology first laid out by Mark Ritchie, who was President of IATP at the time (DiGiacomo, Reference DiGiacomo1998). In the piece, the author (Gigi DiGiacomo) followed Mark Ritchie's approach and argued that dumping in the context of US agricultural commodities should be defined differently than the deliberate strategy of an aggressive exporter. Instead, DiGiacomo used the definition of dumping provided in the General Agreement on Tariffs and Trade (GATT) that was intended for situations in which the price of a good does not reflect what the GATT refers to as the good's ‘normal value’. This might be, for example, because governments are setting or constraining prices in some way, as has been common historically for staple food prices in many countries, or because a monopoly controls the market. In this situation, market prices are not considered to provide an accurate indicator. Article VI of GATT includes a provision instead for the construction of a reference price based on the cost of production and related expenses. In successive papers on the prevalence of dumping in US agricultural commodity markets, IATP innovated a dumping calculation that used data from official government sources to track production costs, farmgate prices, an estimated transportation cost and export prices for five commodities: wheat, rice, maize (called corn in the USA) and cotton {DiGiacomo:1998vp, Murphy:2005ui, Ritchie:2000tz}. IATP created a ‘dumping percentage’ by comparing how much less the export price is than the cost of production plus transportation.
IATP argued that this price construction to determine dumping is appropriate given the extent of the US federal government's interventions in commodity markets, as well as the government's failure to enforce competition rules, allowing already dominant grain traders to continue to consolidate their market power {Murphy:2008el, Hendrickson:2008iy}. Economic power in agricultural markets in the USA has grown increasingly concentrated over the last several decades, in both the input sectors such as farm equipment, seeds and chemicals, and in the commodity trader, processor and retail sectors as well (Murphy, Reference Murphy2006; Hendrickson and Heffernan, Reference Hendrickson and Heffernan2007; Heinrich Böll Stiftung, Rosa Luxembourg Stiftung, Friends of the Earth Europe, 2017). Farmers came to rely on a series of strategies to make ends meet, among which an evolving series of government programs played a central role. They also relied on off-farm employment and exploitative use of their own labor. IATP dumping numbers suggested that US farmers were operating at a loss for years at a time, to their own detriment and to the detriment of growers elsewhere in the world whose prices were depressed by this US phenomenon (Ritchie et al., Reference Ritchie, Wisniewski and Murphy2000; Murphy et al., Reference Murphy, Lilliston and Lake2005).
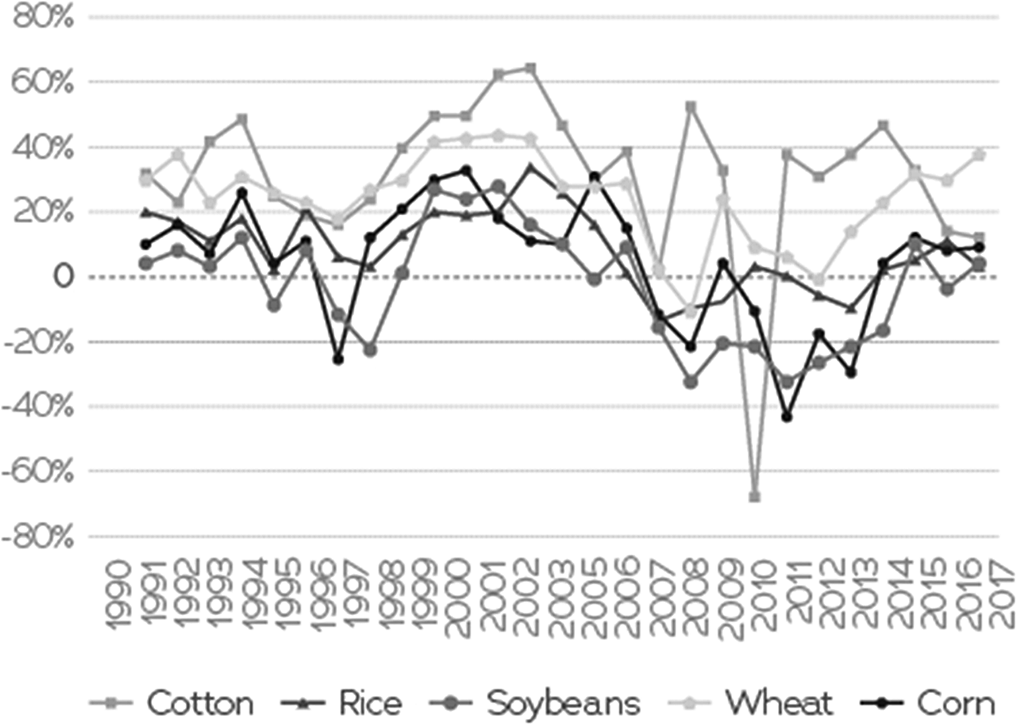
This article looks again at this problem in more detail, adding over a decade's worth of new data that includes the period of high and volatile commodity prices from 2007 to 2013, during which time the level of dumping fell and even disappeared at some points. Altogether, we present data from 1990 to 2017 (see Fig. 1). With world commodity prices significantly lower again in 2018, dumping is again on the rise, yet the debates on a new US Farm Bill give no sign of tackling the issue. It is thus a good moment to ask a few questions. To what extent has this pricing discrepancy between costs of production and export prices persisted since 2005? What are the causes and consequences of dumping, and to what extent are government interventions in the Farm Bill to blame? How have the numbers changed over the years that IATP has documented the problem (1990–2017) and how might the problem evolve in the future? First, we explain how IATP calculates dumping in more detail.
Dumping rates for major US commodities.
Method
IATP has calculated the extent of US dumping of wheat, soybeans, corn, rice and cotton periodically since 1998 (DiGiacomo, Reference DiGiacomo1998; Ritchie et al., Reference Ritchie, Wisniewski and Murphy2000; Murphy et al., Reference Murphy, Lilliston and Lake2005). IATP uses the definition of dumping established in the GATT for markets in which the market price may not reflect ‘normal value’ (e.g., because of the presence of significant public subsidies). In such cases, normal value must be constructed:
…the ‘constructed value’ of the product, which is calculated on the basis of the cost of production, plus selling, general, and administrative expenses, and profits. (Article VI of GATT 1994)
Using data from the US Department of Agriculture (USDA) and the Organization for Economic Cooperation and Development (OECD), IATP calculates dumping by comparing production costs and export prices, looking at each commodity separately. Over time, IATP analysis showed a consistent pattern of dumping for each of the commodities studied over the period from 1990 to 2003 (Murphy et al., Reference Murphy, Lilliston and Lake2005). In 2003, dumping rates for those goods ranged from 10% for corn to 28% for cotton: in other words, the export price of the major agricultural commodity crops was anywhere from 10 to 28% less than the cost of production. At these levels, dumping was significant and depressed prices for agricultural commodities, affecting the profits of farmers who were selling into export markets, as well as of farmers selling in the local markets of importing countries.
In the new calculations of dumping rates presented here, the authors relied on the same methodology as in the 2003 and 2005 analyses, adding the costs of production to the government support allocated to each of the five crops and estimating transportation costs to the exit port. This generates an estimate of the full cost of production, which the authors then compare to export prices. In most cases, the authors are still able to use the same data sources so that they can compare the trends in prices in the past with those happening in more recent years.
The cost of production is drawn from USDA Economic Research Service tables on commodity costs and returns (Economic Research Service, n.d.). Those tables include operating costs such as seeds and fertilizer, as well as allocated overhead costs. While these tables do not list profits (profit is usually included as a component of dumping calculations to determine normal value under GATT rules), they do include the opportunity costs of land and labor, i.e., what those resources could have earned if they had been put to other uses. The authors argue opportunity costs provide a measure similar to profits in that they reflect economic returns from inputs. To the operating and opportunity costs, they added the cost of government support to produce those crops, as reported to the OECD Producer and Consumer Support Estimates Database (OECD, 2016), which includes the subsidy portions of crop insurance, revenue insurance and credit allocated to each crop. While not a cost in the same sense as fertilizer or other inputs, these subsidies strongly influence farmers’ decisions on what crops to plant and are thus an integral part of the determination of how much of which crops are produced and sold (Sumner, Reference Sumner2003; Glauber and Westhoff, Reference Glauber and Westhoff2015).
Estimates of processing and transportation costs as the commodity goes from field to port are the most problematic part of the IATP dumping calculation. Shippers and handlers’ contracts are proprietary while, for most grain traders, transportation costs are internal to the business because they own storage terminals, trucks, barges and rail cars. Moreover, the crops are grown at and distributed to diverse places, undermining the accuracy of average numbers. Nonetheless, transportation is a real part of the total cost and cannot be ignored. IATP estimates transportation based on the difference between the price paid at a typical site of production for that crop, and the price paid at the port of export.
More specifically, we used the yearly average of weekly prices paid in Kansas (wheat), Iowa (soybean), Illinois (corn) and Arkansas (rice) and the Freight On Board price at Gulf coast ports, as reported in USDA Agriculture Marketing Service Transportation Analysis Table 2: Market Update: US Origins to Export Position Price Spreads, and USDA Economic Research Service, Rice Yearbook (Agricultural Marketing Service, n.d.). In the case of cotton, we used the National Cotton Council of America's A Index of global prices, which is consistent with USDA figures (National Cotton Council of America, n.d.). We were not able to identify comparable estimates of prices at the point of production, so we do not include transportation costs for cotton. We recognize that these are rough estimates of the real transportation and handling costs. Going forward, it would be important to try to discover better data on which to base these costs, as they are an important element of the dumping calculation.
Findings
Figure 1 illustrates the results of the dumping estimates. The dumping rates from 1990 to 2003 are based on IATP's earlier calculations. With some exceptions, they show a consistent pattern of dumping. Adding in the new calculations from 2005 to 2017, we see a return to the patterns of the past. As prices started to fall again after the price spikes of 2007–2008 and the 2011–12 drought in the USA, rates of dumping increased. While there have been fluctuations in some years, in general we see a return to US dumping in export markets by 2013. As of 2017, the rates of dumping stood at 38% for wheat, 9% for corn, 4% for soybeans, 3% for rice and 12% for cotton.
Another way to understand these figures is that despite the pause in dumping during the price shocks of 2007–2008, and 2011, the structural factors that allowed dumping to arise in the first place have persisted, so that the problem recurred as overproduction began to replenish stocks and calm buyers’ fears, which lowered international market prices. The food price crisis might have been expected to change public policy in agriculture. The G7 and the G20 met and made joint declarations and a number of developing countries began to invest again more seriously in agriculture {Murphy:2013tr, Clapp:2013fo, Wise:2012ui}. But agricultural policies did not change in the USA. The period of high and volatile prices had many causes. They included low levels of stocks, strong underlying demand growth as levels of poverty fell in many parts of the world, and the rapid emergence of large markets for biofuels, which changed expectations of future prices in the market (Abbott et al., Reference Abbott, Hurt and Tyner2008, Reference Abbott, Hurt and Tyner2011; Headey and Fan, Reference Headey and Fan2008; High Level Panel of Experts on Food Security and Nutrition, 2011). Even though the food price crisis gave rise to a more alarmist view of future food availability, based on projected demand and constraints on expanding production (FAO, 2009), the period of higher prices seemed to curb interest in programs that would address over-supply. Despite warnings that higher prices would trigger another period of higher production and lower prices unless the government intervened, the government continued to pursue a policy of underwriting intensive production at considerable public expense without regard to market structure and concentrated corporate interests (Murphy et al., Reference Murphy, Burch and Clapp2012; Wise and Murphy, Reference Wise and Murphy2012).
The international debate on dumping in agriculture, particularly at the WTO, has focused on the role of government subsidies and limits to market access (‘protectionism’). The causes of dumping in the US context, however, are more complex. Figure 2 (below) illustrates the relative sizes of production costs, subsidies and transportations costs for wheat. Even with the changes in the 2014 Farm Bill, and a move to income insurance policies, the relative size of wheat subsidies in relation to the overall costs of production has remained fairly constant. The picture is similar for corn and soybeans. In the case of rice, transportation costs are relatively higher, but the pattern is the same. Both subsidies and dumping are linked to market prices, but they do not track precisely; subsidies are not large enough, nor do they correlate closely enough, to explain dumping fully. In the years IATP has tracked dumping, successive Farm Bills have changed the basis of support significantly. In 1996, the Farm Bill sought to separate payments from production and introduced decoupled payments, so-called because the payment was based on historic rather than actual production. In 2002, the Farm Bill returned, somewhat, to earlier programs such as countercyclical payments linked to crop prices, but not at levels that covered production costs. In the 2008 Farm Bill, the government began to look at other ways to support income rather than crop levels, and in 2014, the government turned to income and price insurance. Some of the measures are more sensitive to price than others (rising when prices fall) but with the introduction of weighted averages of recent years, farmers are concerned that the benefits of the program will be eroded gradually as successive low-price years push payments down.
Total cost of wheat (in dollars per bushel).

The issue for dumping is not only the amount of the subsidies, but the incentive they create to produce certain crops that then require export markets to keep prices buoyant in the face of flat domestic demand. This is coupled with a lack of policy interventions to redress the effects of oligopsony power in the market (there are very few buyers in relation to the number of farmers who are selling) (Hendrickson and Heffernan, Reference Hendrickson and Heffernan2007). The interlocking set of contributing causes includes a government intent on not challenging agribusiness market power, or establishing effective production limits, and relying on agricultural support programs that use public funds to make up shortfalls in farm income for particular commodity crops, such as rice, corn and wheat. These actions combine to generate surplus production that cannot be sold at a profit, which becomes a driver of US trade policy as the government looks to open new export markets, encouraged by the multinational grain traders. The imperative of expanding exports shapes US Government demands for access to other countries’ markets. Yet the government refuses to address the trade distortions created by oversupply and dumping in international markets. This picture has been further confused in the past year by the Trump Administration's imposition of steel tariffs, which prompted China to retaliate with tariffs on sorghum and soybeans, shrinking outlets for US exports and depressing prices (Bloomberg News, 2018).
How much do US exports matter?
The USA is an international agricultural powerhouse. It is the third largest producer of agricultural commodities, globally, after China and India, and the world's largest agricultural exporterFootnote 1 {WTOStatisticsDatab:tc, accessed 26 September 2018}. It is the largest producer of corn and soybeans, the third largest producer of wheat and cotton, and the 11th largest producer of rice {FAOSTAT:vt, accessed 26 September 2018}. In the 18 yr IATP has tracked dumping, the amount of food traded in international markets has grown significantly, and the US share of that total has shrunk. Brazil now rivals the USA as a soybean exporter, while Russia is poised to overtake the USA as a wheat exporter. The share of US agricultural exports has almost halved in the past two decades, from 23% of global value in 1995 to 12.5% in 2013 (Good, Reference Good2017). Yet US agricultural commodities still make up a huge share of international markets. The USA is the world's largest exporter by value of wheat, corn, soybeans and cotton, and the fourth largest exporter of rice in international markets (FAO, n.d.). Since IATP began this analysis in 1990, all these crops have been dumped well over half the time (see Fig. 3).
Trends in dumping over time.

Why does it matter?
Dumping matters for at least three reasons. First, dumping hurts US producers who sell their product into markets that are controlled by just a handful of agricultural commodity trading corporations. When farmers cannot get back their production costs from the market, they are forced to rely on other strategies to survive, whether it is off-farm employment, government subsidies or under-valuing their labor (Ray et al., Reference Ray, Daniel and Tiller2003; Rosset, Reference Rosset2006). As this paper documents, the prices US farmers get for their crops, on average, are in many years below their average cost of production. The price gap lessened, and even disappeared briefly, during the period of high and volatile commodity prices from 2007 to 2013. But prices in international markets are down again and in 2018 are the lowest they have been since 2002. Net farm income in the USA is down by 50% since 2013 (Schnepf, Reference Schnepf2017). The US Department of Agriculture Economic Research Service (ERS) projects that median farm income, estimated at −$940 in 2016, will decline to −$1316 in 2018, noting that, ‘In recent years, slightly more than half of farm households have had negative farm income each year’ (Economic Research Service, 2018).Footnote 2 The economic consequences of a system that reinforces dumping are felt by US commodity growers and their families, their hired workers, and by the rural communities they live in; communities that are deprived of spending that would otherwise support vibrant economic life. It is this acute socio-economic crisis in rural areas that provides one of the links among the members of La Via Campesina, an international federation of farmer and peasant organizations that has included the US National Family Farm Coalition since the mid-1990s. These farmer and peasant organizations have found common cause in a political platform that links every continent; while economists may describe them as competitors, the farmers are inclined to find common ground in selling into oligopsonistic markets wherever they may be located.
Secondly, it undermines the economic viability of farmers in other countries, whether the farmers are growing crops for their domestic markets in importing countries or selling their crops to traders for export in competition with US production (Ray et al., Reference Ray, Daniel and Tiller2003; Wise, Reference Wise2004; Morrison and Mermigkas, Reference Morrison and Mermigkas2014). This is especially a problem for developing countries that rely on agriculture for economic stability because the sector makes up half or more of their employment and the largest share of their GDP—such countries are typically among the world's poorest. Even countries that do not import US commodities suffer because US exports are large enough to affect world prices, which affect all countries who trade some share of their agricultural production.
Thirdly, dumping undermines the realization of environmental objectives. Agriculture is putting unsustainable stress on a number of planetary boundaries, including genetic diversity and nitrogen (Rockström et al., Reference Rockström, Steffen, Noone, Persson, Chapin and Lambin2009; Campbell et al., Reference Campbell, Beare, Bennett, Hall-Spencer, Ingram, Jaramillo, Ortiz, Ramankutty, Sayer and Shindell2017). Care of the natural resource base, including the imperative to protect soil health, water quality and the ecological diversity of farmland, are all squeezed when production is under-valued (Rayner and Lang, Reference Rayner and Lang2013). Several factors reinforce a vicious circle, including commodity markets that externalize environmental costs, farmers’ attempts to make up on volume what they have lost on value, and the tendency of low prices to drive increasing concentration, hurting new entrants and diminishing competition. The result harms planetary systems and the local ecosystems across the planet that are linked by international trade and investment (High Level Panel of Experts on Food Security and Nutrition, 2017a).
Why does it happen?
There are three main factors behind dumping. One is the level of market power enjoyed by the companies that provide inputs to farmers, buy commodities and process those commodities into food, animal feed and industrial products. Those actors as a broad group are often referred to as agribusiness. In this paper, we focus primarily on the international commodity trading firms that buy grain from farmers and sell it on to other agents around the world, whether processed or still in raw commodity form. Four firms dominate this trade, all of them vertically integrated along the grain value chains: Archer Daniels Midland, Bunge, Cargill and Louis Dreyfus. These four firms dominate US domestic agricultural commodity supply chains, and the international grain trade (Hendrickson and Heffernan, Reference Hendrickson and Heffernan2007; Hendrickson et al., Reference Hendrickson, Wilkinson, Heffernan and Gronski2008; Murphy et al., Reference Murphy, Burch and Clapp2012). They are estimated to control 75–90% of grain trade globally; in many local markets, just one or two firms are present (Clapp, Reference Clapp2014).
Despite this situation, the US Government has failed to limit or reduce the oligopolistic market power of commodity traders (Howard, Reference Howard2016). Concentrated market power in agriculture is a problem that has prompted Congressional hearings and nation-wide listening tours (see the ‘Report of the USDA National Commission on Small Farms: A Time to Act’ from 1997, or the reports from Senate HearingsFootnote 3). It is an old problem—one that in the past has prompted legislative and regulatory action. But successive Farm Bills have come and gone leaving the problem unaddressed, while legislation in other areas, such as the 2000 deregulation of financial services through the elimination of the Glass–Steagall Act, have further strengthened grain traders’ economic position (Murphy et al., Reference Murphy, Burch and Clapp2012; Clapp, Reference Clapp2014). Grain traders are heavily involved in commodity processing. They are vertically integrated in the market. This means that the costs at different stages of the commodity value chain remain internal to the firm's operation, including the price of corn purchased on the commodity exchange, the price of the processed products made from that corn at the crushing plant, and the cost of the grain provided to a feed lot operator (Hendrickson and Heffernan, Reference Hendrickson and Heffernan2007; Murphy, Reference Murphy2008a). The external price discovery mechanisms that markets rely upon for efficiency are missing. Vertically integrated companies are able to capture a disproportionate share of the benefits of cheap grain (Wise, Reference Wise2005; Wise and Rakocy, Reference Wise and Rakocy2010).
In effect, agribusinesses that buy and process agricultural commodities have the market power to push prices below the level that would provide a reasonable profit to producers and to appropriate value at the stages of the supply chain under their control. The persistent gap between production costs and the price farmers receive is evidence the market is not correcting. The government payments make it possible for farmers to continue—they muffle the price signal—but they fail to stop dumping. As the authors see it, and as IATP has argued historically, price distortions are built into the earliest point of commodity production, with insurance and other government subsidies serving as a patch that (sort of) keeps the system going.
A second factor is the government subsidies. There is no question that without the subsidies, many more US farms would fail (Ray et al., Reference Ray, Daniel and Tiller2003; Wise, Reference Wise2005). The negative income reported by ERS and cited above confirms it. The question is whether fewer farms would reduce dumping, which is a factor of the volume of supply, not the number of farms in operation. The longer-term trend is toward consolidation and fewer, larger farms (USDA, 2012).
The third factor links the market power of agribusiness and the government programs. Until 1985, when the Farm Bill policies started to change, the US Government's non-recourse loans acted like a buyer of last resort in the market. Farmers knew that if market prices were less than the price foreseen when they borrowed money from the government for their crop, the government would accept their crop in lieu of repayment. This effectively created a price floor that the grain traders (already enjoying significant market power although the markets were not as concentrated then as they are now) had to match or beat (Morgan, Reference Morgan1979). With the elimination of the non-recourse loan, farmers lost a bargaining instrument against the market power of grain traders (Levins, Reference Levins2000).
Dumping and US farm programs
In the USA, all the major traded agricultural commodities are produced with significant government intervention. In the aftermath of the Great Depression, the USA established supply management programs to balance markets while keeping farms economically viable. Henry Wallace, US Secretary of Agriculture from 1933 to 1940, had been influenced by a visit to China where he learned about the country's long history of public stockholding as a tool to protect stable food prices and avert famine (Bodde, Reference Bodde1946). US farm programs have changed over the last 50 yr, as the USA experimented with dozens of ways to stabilize supply and keep farm prices buoyant, including target prices, non-recourse loans, production quotas, price floors, deficiency payments, payments in kind and land set-asides—not to mention import tariffs. Then, in the 1970s, Nixon's Secretary for Agriculture Earl Butz famously exhorted farmers to plant ‘fencerow to fencerow’ and was accused of supporting policies that forced farmers to ‘get big or get out’ (Scholar, Reference Scholar1973). Butz ended the land set-aside policies that were then in place, and moved policies decisively away from supply management toward expanding production and export markets (Hunter, Reference Hunter and Hunter1989). Already in the 1950s, the US Government had established programs that disposed of cereal surpluses as international food aid, which disrupted local markets in developing countries and created food dependency (Barrett and Maxwell, Reference Barrett and Maxwell2005; Cullather, Reference Cullather2011). Then in the 1980s, the US Government introduced export subsidies to support commercial exports that were threatened by the exponential growth of European production (Wolfe, Reference Wolfe1998).
Over several decades, grain traders lobbied to erode price support programs and to encourage trade liberalization. This political role is largely invisible, though some careful histories make note of it. Journalist Dan Morgan's 1981 book, Merchants of Grain, is illuminating. The book covers the origins of five dominant global grain trading firms and brings the story up through the so-called Great Grain Robbery of 1972 and its aftermath (Morgan, Reference Morgan1979). The grain trades from the USA to Russia in that year contributed to a food price crisis in international markets, and brought a series of policy changes in its wake (Shaw, Reference Shaw2007; Timmer, Reference Timmer2010). Brewster Kneen's in-depth study of Cargill is a meticulously documented account of the largest grain trader's international operations and strategies (Kneen, Reference Kneen2002). Agribusiness leaders engaged strongly as funders and members of the pro-trade International Food & Agricultural Trade Policy Council, too, whose website and policy papers are at http://www.agritrade.org. Unfortunately, the earlier history is not captured there; the organization was founded in 1987, at the time of the Uruguay Round, but the earliest policy papers on the website only date back to 2003.
The 1985 Farm Bill introduced significant changes in US farm policy, but the most radical break with post-war production management was the 1996 Farm Bill, known as ‘Freedom to Farm’. The 1996 Farm Bill shifted government policy away from supporting commodity price floors and toward providing farm income support, ostensibly (though imperfectly) decoupled from current planting decisions (Alston and Sumner, Reference Alston and Sumner2007). The move satisfied a long-standing demand from commodity traders that the government should not interfere to raise prices. With the end of those programs, however, traders were able to use their market power to pay less for commodities and the government was left with increasing demands from farmers to make up the shortfall in income that resulted. Agribusiness firms also benefitted directly from export subsidies that insulated them from risks and further consolidated their market power. Export subsidies have hardly been used in recent years, partly because prices were more buoyant between 2006 and 2013, compared with the previous several decades, and partly because governments accepted the direction of the WTO negotiations, which were tending toward a prohibition. The USA joined other WTO member states in agreeing to phase export subsidies out completely at the 10th WTO Ministerial Conference, held in Nairobi in 2015 (WTO, 2015).
The rhetoric surrounding the 1996 Farm Bill encouraged farmers to continue to expand production, urging US farmers to ‘feed a hungry world’ (and in particular China). The government and the multinational grain companies proposed export markets as a way to keep prices buoyant in the face of over-supply. A brief upward spike in some commodity prices (particularly corn) made the 1996 Farm Bill possible, politically (Orden et al., Reference Orden, Paarlberg and Roe1999). Yet in the wake of the 1996 Farm Bill reforms, commodity prices resumed their long-standing downward trend. US farmers protested, and the US Government then adopted a patchwork of emergency measures, which was codified in the 2002 Farm Bill, at which point the US Government reintroduced countercyclical payments, albeit at levels much below production costs (countercyclical because payments rose as prices fell, effectively countering the market signal) (Sumner, Reference Sumner2003; Alston and Sumner, Reference Alston and Sumner2007). Dumping levels at that time ranged from 11% for corn to 65% for cotton (Murphy et al., Reference Murphy, Lilliston and Lake2005).
From 2004, a number of factors in international commodity markets started to shift agricultural prices higher. Steady sustained economic growth in many parts of Asia increased demand for animal sourced foods (meat and dairy), and the feed they needed. Mounting concern about the need to contain greenhouse gas emissions created political pressure from environmentalists that converged with farmers and agribusinesses looking to create new markets for agricultural commodities through establishing a market for biofuels. The result in a number of countries, including the USA, was the creation of public mandates and targets to add ethanol and biodiesel to petrol and diesel fuel (Abbott et al., Reference Abbott, Hurt and Tyner2008; Murphy, Reference Murphy2008b). The deregulation of commodity futures markets, which had begun in the 1990s, culminated in a major reform in the USA in 2000 that facilitated the entry of banks, pension funds and other financial actors into speculative markets for agricultural commodities (Clapp and Helleiner, Reference Clapp and Helleiner2012; Clapp, Reference Clapp2014). This, in turn generated significantly higher short-term volatility and made it more difficult for producers and commodity processors to predict prices or supplies (High Level Panel of Experts on Food Security and Nutrition, 2011). This growth in demand, coupled with destabilizing financial pressures and a significant drop in the availability of publicly held stocks of cereals such as corn and wheat, left international commodity markets poorly prepared for supply shortfalls arising from poor harvests, as happened in 2007 and again in 2011 (Abbott et al., Reference Abbott, Hurt and Tyner2008, Reference Abbott, Hurt and Tyner2011; Headey and Fan, Reference Headey and Fan2008).
The 2008 US Farm Bill introduced further changes, including modest limits on countercyclical payments, the expansion of certain conservation programs, and new initiatives to support the expansion of biofuels production (Senate Agriculture, Nutrition and Forestry Committee, 2008). These new Farm Bill measures conformed to WTO rules, but they did nothing to curb the overproduction that ensued when prices again fell following the 2007–2008 food price crisis. Once again, farmers looked to exports to compensate for falling revenues from low prices, continuing to expand their production. Soybeans provide a dramatic example: in 2005, the USA exported $2249 million worth of soybeans to China. In 2014, trade had increased almost sevenfold, to $14,476 million (Foreign Agricultural Service, n.d.).
The 2014 Farm Bill introduced some significant changes in the way US farm programs work. Direct Payments based on historic land acreage, Countercyclical Payments (which were price-based) and the Average Revenue Election Payments (ACRE), which were based on farm incomes rather than prices, were all phased out. In their place, the government established two new programs: the Price Loss Coverage (PLC) program and the Agricultural Risk Coverage (ARC) program. The PLC program is price-based, providing a payment when national season-average farmgate prices fall below fixed reference prices. ARC is income-based; the program pays out when county average or individual farm-level revenues per acre fall below 86% of a benchmark that moves according to a 5-yr Olympic averageFootnote 4 of national prices and county or farm yields (producers choose whether to use the country average of individual farm when they enroll). Grain and oilseed producers (including peanut growers) can choose which program to enroll in, but once acres are enrolled in the PLC, farmers cannot move them out until the expiration of the Farm Bill in 2018 (Farm Service Agency, 2014).
Farm insurance programs are considered ‘non-trade distorting’ under WTO rules. Their cost does not count against the spending limits set by the terms of the Agreement on Agriculture (AoA) {WTO:1994uf, Annex 2}. Nonetheless, the ruling of the WTO Dispute Settlement Body in 2004 in a case brought by Brazil against US cotton programs found that even domestic support programs that were allowed under the rules could be considered in violation if the programs had the effect of depressing prices in international markets. The USA challenged the ruling, but it was upheld. In 2009, the USA began to make monthly payments to the Brazil Cotton Institute and committed to revise its cotton program (Ridley and Devadoss, Reference Ridley and Devadoss2012). In the final settlement, in 2014, the USA agreed to pay a further US$300 million to the Brazil Cotton Institute {USTR:2014vr}. Before 2014, insurance programs were a tiny part of US farm support programs, and they were not counted in the calculations made by the dispute judges. With their significant expansion in the 2014 Farm Bill, however, insurance programs have become yet another way for the US Government to subsidize production, incurring the risk of further legal disputes at the WTO.
Cotton growers have long received substantial subsidies under successive Farm Bills. Economists argue that in the case of cotton, the land might well be used to grow other crops were it not for the protection against imports and the level of payments provided. US cotton is not as competitive as soybeans and corn. In a simulation of the impacts of the removal of subsidies on various commodities, Ray et al. found that land allocated to cotton would decline by 12–16%, substantially more than other crops (Ray et al., Reference Ray, Daniel and Tiller2003).
US dumping of cotton was not only the subject of a formal WTO complaint by Brazil, but also a countervailing duty ruling by Turkey. Four of the world's poorest countries, Burkina Faso, Mali, Chad and Niger, formed a group—the Cotton Four—to intensify the pressure at the WTO for new rules to tighten disciplines on cotton spending. Although not a food crop, cotton can provide important livelihoods and food security benefits to smallholder producers (Traoré, Reference Traoré, Bouët and Laborde2017). Unfortunately, the financial compensation paid to Brazil was not accompanied by a change in US agricultural commodity programs. Dumping continued. African cotton farmers continue to face a highly distorted international market, as do their governments, some of which are heavily dependent on the foreign exchange earned from exports. While global prices are affected by other factors, especially the changing production and consumption patterns in China, there is little doubt that US policies continue to contribute to artificially low global prices (Lau et al., Reference Lau, Schropp and Sumner2015; Traoré, Reference Traoré, Bouët and Laborde2017).
The 2014 Farm Bill reshaped the programs supporting cotton farmers into insurance schemes, which were not problematic under the WTO rulings. The result was STAX, the Stacked Income Protection Plan, which provides revenue protection for upland cotton farmers (over 90% of US cotton production is upland cotton), based on average area yields (e.g., county level) rather than individual farm yields (Risk Management Agency, 2016).
The 2014 Farm Bill raised challenges for WTO compliance. The farm insurance programs are covered under the exempt programs listed in Annex 2 of the AoA that are not included in the Aggregate Measures of Support (AMS) calculations. Yet the US Government notification to the WTO of its spending on agriculture for 2014 listed much of its insurance spending as product-specific AMS, with only some of the spending protected by the de minimis thresholds [if the total cost of a program is <% of the value of production of that crop, the program is also exempt from the AMS total under the so-called de minimis provisions (WTO, 1994)]. This suggests that the US Government may not try to use that general exemption to continue its support for specific products. Indeed, according to the US Congressional Research Service, ‘None of the current suite of farm price and income support programs and shallow-loss crop insurance programs—MLP, PLC, ARC, SCO, STAX, DMPP,Footnote 5 and the sugar program—would qualify for the green boxFootnote 6, because they are coupled, partially or fully, to current prices and/or plantings, or receive additional TRQFootnote 7 protection from imports (as is the case for US dairy and sugar producers)’, (Schnepf, Reference Schnepf2017, p 14). Whether or not this is correct, the prospects for relief from dumping through the WTO remain dim. Not only are the talks by and large paralyzed, with the Trump Administration playing a complicating role, but none of the proposals made to date within the context of the Doha negotiating agenda would significantly limit spending on domestic support, nor would they reinvigorate regulations designed to limit supply.
US farm programs are designed to continue large-scale production of agricultural commodities that are fed into whatever market opportunities exist at a given point in time. Those markets may be for food, biofuels, animal feed and for domestic use or export. In the main, Farm Bill programs do not aim to promote stable rural livelihoods, food security or sustainable production (although a few smaller programs along those lines are included). They are designed to increase supplies of agricultural commodities to feed into international supply chains dominated by large transnational corporations, under conditions in which farmers have diminishing power to insist on prices that cover their costs of production. Despite various government conversations, including government hearings and commissions, over the years to address the steady increase in concentrated market power among agribusinesses that provide inputs or buy and process commodities, no new legislation has been passed that addresses the problem.
How have US farmers fared under this system?
The fact that US farm goods continue to be sold at prices below the cost of production seems counterintuitive, especially given that public subsidies under the Farm Bill are relatively small in comparison to overall costs of production. Examining USDA's Costs of Production for wheat in Table 1 (not counting government support or transportation costs), to take one example, illustrates the full range of costs. In a year of low prices, a farmer will not fully recover expenses such as the cost of his or her own labor (opportunity cost of unpaid labor) or the implied costs of land. ‘Capital recovery of machinery and equipment’ will in most cases mean paying back loans on those purchases or planning to replace equipment that wears out. A farmer might absorb some of those losses in the short term, but a business cannot run at a perpetual loss. To cover the revenue shortfall, farm families are pushed to seek off-farm work. Often, farm households look to other sources of employment to provide health insurance, too, as the prohibitive cost of individual health care in the USA is a major issue for farmers and their families (Economic Research Service, 2017). We have not included that cost here, but arguably it should be counted as part of total production costs.Footnote 8
US wheat production costs in dollars per planted acre

Source: USDA Economic Research Service Commodity Costs and Returns. Developed from 2009 survey base year. Fertilizer costs include commercial fertilizer, soil conditioner and manure. Other variable costs include cost of purchased irrigation water and straw bailing.
Farmers are structurally disadvantaged in the market place and often work at a loss. This in turn benefits agribusiness who are able to integrate the low costs into their value chain, allowing them to consistently make higher profits than farmers (McMichael, Reference McMichael2004). When we look at the cost of production and the movement to port and export, there are profits and losses at various stages along the supply chain, including the concentration of market for seed, fertilizer and other inputs. A significant share of these costs, however, is hidden behind proprietary contracts and vertically integrated supply chains. This leaves the public covering farmers’ losses through government assistance such as income transfers (McMichael, Reference McMichael2004; Downey, Reference Downey2016).
Agricultural economics has shown that farmers will forgo profit and maintain production in the face of losses for a long time. This is a long-observed fact of agriculture that is different than other sectors. Different explanations are offered for this behavior, including culture, and community and family ties, as well as the economic realities such as the lag that results from holding illiquid assets (land and machinery) and growing a commodity that cannot be produced ‘just in time’. It is expensive and slow to change production on a farm, especially as crops have become more specialized and farms less diverse. Periods of high prices, if left unchecked, tend to stimulate an over-reaction by farmers, resulting in more production than is warranted by demand (economists call this an ‘over-correction’). As a result, price spikes are volatile in the short-term and quickly trend back to lower prices, and high prices remain an exception not a norm (Levins and Cochrane, Reference Levins and Cochrane1996). The land is an asset that farmers borrow against when they have no capital to invest. Farmers work for themselves and can do without when profits are down. Most farms in the USA depend on a web of income that includes government payments and the earnings of members of the household who work off-farm. Rented land has become a much more common feature of US agriculture, as some land owners choose to hold on to their land title but allow neighbors to realize economies of scale (and run the risks of planting a crop) by working the land. As rural sociologists and scholars of agrarian change have long explored, the motivations for working a farm include personal, cultural and social factors that are poorly captured by micro-economic cost-benefit analysis; farms tend to be family businesses, and the investment includes family and community ties, and knowledge of specific geographies and micro-climates (the literature is vast, but the Journal of Peasant Studies and the Journal of Agrarian Change, as well as Agriculture and Human Values are all good repositories of the work, as is the creative writing of John Berger {Berger:1979vp}).
Over the last two decades, the scale of production in US agriculture has moved in two opposing directions: toward larger and very large farms, and toward a new generation of micro farms that are responding to emerging urban demand for more locally grown produce. Volatile prices contribute to that polarization, as small-sized farmers are compelled to either sell their land to bigger farms or to buy up their neighbors’ land in the hope that expansion will improve returns (Howard, Reference Howard2016). Bigger farms are better able to absorb risks and their share of US agriculture has grown. US Census data show the marked drop in the number of mid-sized farms (those with sales between $25,000 and $100,000). At the same time, the number of small farms has increased, many of which produce meat, fruits and vegetables for local markets but on a tiny scale. As of 2012, 75% of farms had <$50,000 in sales, while those with more than $1,000,000 in sales (4% of the total farms) produced 66% of total US crop values (USDA, 2012). While the growth in more sustainable local production is a welcome development, small farms remain highly dependent on off-farm income and vulnerable to failure. The absorption of medium-sized, family-owned and operated farms by bigger operators undermines the flow of capital in local economies that historically made agriculture a mainstay of rural economies across the country (McMichael, Reference McMichael2004).
The 2014 Farm Bill programs react to price drops, but they are not designed to resolve them. They compensate farmers when there is a significant drop in commodity prices but do nothing to change the market structures that make farmers price takers in their markets, whether buying from the concentrated farm input supply sector, or selling to commodity buyers. Farm incomes have been falling for the last 3 yr (Schnepf, Reference Schnepf2017), and the level of farm debt to income is now the highest since the 1980s (Wilson and Durisin, Reference Wilson and Durisin2016). Since the payments under the ARC and PLC insurance programs are based on a 5-yr Olympic average for each crop, the persistence of low prices gradually erodes the size of the payments, too (unless, as has happened many times before, the government resorts to emergency payments to avoid the political consequences of the programs’ failures). The US Government answer for decades has been to sell trade agreements and projected expanded exports as the way to grow markets and compensate for low prices, but that response has not solved farmers’ lack of bargaining power in relation to commodity traders and processors, most of whom are buying from farmers around the globe.
The US reliance on export markets has had negative impacts on farmers in developing countries, too. Under the North American Free Trade Agreement (NAFTA), for example, corn exports to Mexico increased more than 400% in the first few years of the agreement, disrupting local markets in Mexico. Based on Mexican Census data, Tim Wise estimates that more than 2 million Mexicans left agriculture in the wake of NAFTA's flood of imports, or as many as one-quarter of the farming population (Wise, Reference Wise2010). Even when dumping rates decreased during the period of high prices, existing public support programs for agriculture in Mexico, as in the USA, tended to support the largest farmers and agribusiness interests, rather than the smaller producers who had been the backbones of their rural economies (Fox & Haight, Reference Fox and Haightn.d.).
Who complains about dumping?
Dumping has generated significant tension in international trade negotiations, particularly at the WTO. The WTO debate focuses on the use of export subsidies, food aid that disrupts commercial transactions, and domestic support that encourages over-production that finds its way into international markets. In 2015, WTO member states agreed to eliminate all forms of export subsidies (WTO, 2015). Food aid continues to be an irritant in trade talks but is far less important in international markets than it used to be, and most governments are sensitive to the fact that food aid is useful as a tool for humanitarian interventions, making commercial objectives a lesser priority (Diaz-Bonilla, Reference Diaz-Bonilla2013). The continuing problem from the perspective of WTO member states is instead the high levels of domestic support provided by a few developed countries, especially the European Union, Japan and the USA. A majority of WTO member states, including some developed countries (primarily the big exporters: Canada, Australia and New Zealand), want to tighten WTO disciplines on domestic support. The current (disputed) text proposes some kind of overall cap on trade distorting support as well as measures that would give developing countries more space for domestic support while curbing the developed countries’ use of the exempted programs listed in Annex 2 of the AoA (Greenville, Reference Greenville2017; ICTSD, 2017, 2018). As part of the Doha Round of trade talks at the WTO, a group of developing countries proposed a Special Safeguard Mechanism as a protection against dumping. The measure would allow developing countries to impose temporary tariff increases to limit the harm caused by import surges. There is no agreed definition of an import surge, but broadly they are unexpectedly large increases in import volumes measured over a defined, short-term, period (Morrison, Reference Morrison2007). The G33 also proposed the concept of Special Products, to create a category of food commodities whose markets developing countries would protect because of their importance to food security and rural employment.
These WTO debates are pertinent to the dumping debate, but they focus on just one of the several complex causes of dumping explored above. Government subsidies are important, but they are not the whole story. This focus leaves important factors unaddressed, including the oligopolistic market power of international grain traders and the urgency of better internalizing the environmental costs of agriculture, not least to limit losses and waste in food systems (High Level Panel of Experts on Food Security and Nutrition, 2014).
It is not uncommon for there to exist short-term price discrepancies between domestic and export markets. No market is perfect and commodity markets are rife with market failures and imperfections, such as imperfect or delayed transmission of information concerning supply and demand. Nor are there clear indicators that determine when a ‘short-term discrepancy’ becomes a chronic problem—economists disagree (High Level Panel of Experts on Food Security and Nutrition, 2011). The numbers presented in this article, however, do not record a short-term phenomenon. For over two decades, US agricultural commodities have been dumped in world markets, highlighting a price gap between costs of production and export prices that sometimes disappears, when world prices are especially high, but reappears as soon as prices drop.
Dumping destabilizes markets. Dumping is unpredictable. Dumping has destroyed agriculture and related industries in developing countries—one of the best documented examples is Haiti's domestic rice sector, which was buried in imported rice during the 1990s (Rakitoarisoa et al., Reference Rakitoarisoa, Sharma, Hallam, Rakitoarisoa, Sharma and Hallam2011). In the past, governments were encouraged by economic advisors to overlook dumping because it provides cheap food imports for consumers. The economic argument is that countries can invest their domestic resources in other sectors if they have a cheap food supply (The World Bank Group, 1986). At the height of structural adjustment programs, agriculture was seen as a ‘backward’ sector, requiring too much labor for too little economic return. Advisors sought to get developing countries to invest in higher value-added export sectors instead (Mihevc, Reference Mihevc1995; Mkandawire and Soludo, Reference Mkandawire, Soludo, Mkandawire and Soludo2003; Chang, Reference Chang2009). More recently, the World Bank and others have thought better of this neglect of agriculture (The World Bank, 2007). Other voices in economic development have persuaded governments that undermining domestic agriculture in developing countries is a mistake, not least because undermining agriculture undermines an important source of poverty-reducing growth (Lipton, Reference Lipton1993; Hazell et al., Reference Hazell, Poulton, Wiggins and Dorward2010; Timmer, Reference Timmer2015). Dumping destroys rural livelihoods and diminishes opportunities to build local infrastructure through local exchange (Rosset, Reference Rosset2006; Rakitoarisoa et al., Reference Rakitoarisoa, Sharma, Hallam, Rakitoarisoa, Sharma and Hallam2011; Morrison and Mermigkas, Reference Morrison and Mermigkas2014). Relying on dumped agricultural production also makes low-income net food importing countries vulnerable to price spikes (Valdés and Foster, Reference Valdés and Foster2012). When prices on international markets rise sharply, poor and vulnerable countries can find themselves without a reliable supplier, as Liberia learned when its rice import contracts were broken by traders in the 2007–2008 food price crisis (Wise and Murphy, Reference Wise and Murphy2012). When the government was unable to pay higher prices for an already contracted shipment of rice, the trading company broke the contract, returned the money and left Liberia without the rice the government was relying on to protect access to food in the country. Persistent dumping undermines local production in ways that are not easily remedied because by lowering prices, dumping destroys profitability for local producers in the country receiving dumped commodities.
Who benefits from dumping?
The benefits of export-oriented agriculture tend to accrue to the largest actors, particularly the grain traders most directly involved in international markets. While farmers’ planting decisions are locked in seasonally or even longer, grain traders are set up to react very quickly to changes in markets. These companies have vastly superior access to information, an advantage that is likely to increase in the era of Big Data in agriculture (Mooney, Reference Mooney2017). Although they have significant capital investments in commodity transport infrastructure, they can offset their risks with futures trading, and their global presence and market power gives them access to buyers and sellers around the planet (Murphy et al., Reference Murphy, Burch and Clapp2012; Clapp and Isakson, Reference Clapp and Isakson2018). Grain traders can profit when prices rise or when they fall, as long as they are successfully predicting the direction of change. Grain traders have strong risk management strategies, including access to global markets and vastly more information on market conditions. If the US soy harvest fails, they can source from Brazil or Argentina; if demand in China dips, they can look for customers in Malaysia instead. As importantly, grain traders are in the business of adding value to primary commodities, whether they are fattening animals with soy or turning corn into ethanol. Cheap grain is an input which the companies are happy to keep cheap.
The risks inherent in agricultural production, such as the unpredictable (and, more recently, erratic) meteorological conditions, fall on farmers. The risks of unstable markets, too, are a problem. Limiting production is not really an option if prices are expected to fall, as no individual farm is in a position to affect the market. This means farmers, quite rationally, tend to maximize production in the hopes that higher volume will compensate for lower prices. Many US farmers use the futures market to offset their risk but as individual operators, their presence is tiny. Futures contracts have grown increasingly expensive, too, as a result of deregulation, and prices are affected in the short-run by pressures that are not strongly linked to the supply and demand for physical commodities (De Schutter, Reference De Schutter2010; Clapp, Reference Clapp2014). Deregulation of financial and commodity markets in the early 2000s enabled a rise in speculation on commodity markets and undermined price formation based on market fundamentals (High Level Panel of Experts on Food Security and Nutrition, 2011). While the Dodd–Frank financial reforms that followed the 2008 financial crisis included important reforms designed to rein in financial speculation, that legislation has been weakened by legal and congressional challenges. President Trump's administration is committed to further deregulation of financial markets.
The 21st century challenges: food security and rising volatility
The last 20 yr have seen important changes in international agricultural commodity trade. More food is grown, more food is traded internationally, and more countries are involved in growing and trading commodities (FAO, 2015). Production in Brazil, in particular, has surged, putting its production of soy and corn on a par with the previously dominant USA. There are more people in the world, in part because more people are living longer lives. More significantly from an international trade perspective, more people have larger incomes. Asia has overtaken Europe as the largest food-importing region (FAO, n.d.). Diets have changed as tens of millions of people have adapted and diversified their diets, eating relatively less food staples such as rice, and relatively more meat, fresh produce and processed foods (High Level Panel of Experts on Food Security and Nutrition, 2017b). At the same time, strong population growth in some of the world's poorest regions has kept demand strong for the three primary sources of calories worldwide (rice, corn and wheat). Meeting the steadily growing demand for food has exacerbated the unsustainable use of freshwater and topsoil and encouraged deforestation, while urbanization and climate change are shifting the geography of agricultural production and making output less predictable (Steinfeld et al., Reference Steinfeld, Gerber, Wassenaar, Castel, Rosales and de Haan2006; FAO, 2009; IPCC, 2014).
The numbers presented in this report show the extent of agricultural commodity dumping diminished during the periods of higher commodity prices in 2007–2008 and 2011–2012; despite rising costs of production, for a time most agricultural commodity prices rose faster and higher. Regions that depend heavily on agricultural commodity production and export profited from the brief moment of higher commodity prices; for example, in parts of Africa, much of Latin America and in India (Headey, Reference Headey2011, Reference Headey2014). The benefits were also felt in higher government revenues and improved conditions on farms for producers and farm workers (Wiggins and Keats, Reference Wiggins and Keats2014). But urban consumers suffered and governments faced enormous political pressure to act quickly to bring food prices back down. A range of policies came up for review in the aftermath of the price crisis; public investment in agriculture, private investment in land, price stabilization measures and social safety nets all received policy attention and funding (Wise and Murphy, Reference Wise and Murphy2012, p. 38).
Over the last few years, commodity stock levels have started to climb again. There are few supply management policies in place to curb production and many commodity prices are again depressed in international markets. All is not as it was before. The long-term shifts in the underlying conditions for supply and demand have contributed to increased awareness of how vulnerable food systems are when they rely on a few global producers and exporters. The FAO announced in 2017 that the number of people living with food insecurity in the world has risen for the first time in a decade and that climate change has played a role in that spike, particularly in the drought that has plagued parts of Africa (FAO, 2017). Increasingly, food insecure countries, particularly in Africa, are becoming more food import dependent according to UNCTAD, making the state of international markets a critical factor in their food security (UNCTAD, 2016).
While the food price crisis refocused attention on the vulnerabilities of globally interdependent food systems and the need for better risk management, the current resumption of low prices and dumping underscore the need for comprehensive solutions that allow farmers to plan their production at fair and reasonably predictable prices. Most governments acknowledge that their food security rests on both local production and trade. It is essential that trade be governed by fair and transparent rules. A crucial first step is to protect food security from agricultural dumping.
While many in the USA would agree on the need for a better Farm Bill that ensures consumers get healthier food produced more sustainably, there is not yet sufficient consensus around programs to pay farmers fair prices for their production or to rein in oligopolistic markets. In any case, those measures will only succeed if there is also renewed attention to programs to manage supplies to address climate catastrophes and other supply and price shocks rather than simply seeking to export as much as possible for as long as possible. The Conservation Stewardship Program is an example of the kind of program that would move US agriculture away from dumping: it offers a whole farm approach supports climate-resilient strategies that support soil health, water quality, perennial grasses, sustainable livestock management and cover cropping. The Union of Concerned Scientists estimates the program is worth $4.7 billion to taxpayers in the damage avoided through better management (Stanley, Reference Stanley2018). A second recent initiative could also make a difference to dumping: New Jersey Senator Cory Booker's proposed legislation to limit mergers in the agriculture sector. The bill would, ‘impose a temporary moratorium on mergers and acquisitions between large farm, food, and grocery companies, and establish a commission to strengthen antitrust enforcement in the agribusiness industry’, according to a summary put out by New Food Economy on 30 August 2018 (Bloch, Reference Bloch2018).
The return to dumping of US commodities by agribusiness occurs at a time when the US Government is challenging other countries’ agricultural programs (as the USA has challenged China at the WTO for its support prices to corn farmers as well as India's use of support prices for its public stockholding and public food distribution programs). The US approach does not acknowledge the problems in US production and exports, leading to accusations of hypocrisy from trade partners. The aggressive US stance on developing countries’ use of domestic support limits the chances for a successful outcome to the renegotiation of the AoA. The findings presented in this article underline the need for a new approach to global trade rules—an approach based on the imperative to protect, respect and fulfill the human right to food and to curb the power of transnational agribusinesses to protect more market power for farmers. New rules should respect the obligation on governments to protect food security at home, embrace the complex relationship of food systems to economic development, and recognize the importance of accountability in domestic politics in rich and poor countries alike.
Acknowledgement
Both authors especially want to thank Ben Lilliston, Daniel de la Torre Ugarte, Tim Wise and Harwood Schaffer for their thoughtful comments and Laurel Levin for her editorial assistance. We also want to recognize Mark Ritchie, who had the idea in the first place, and all those who have contributed to IATP's work on dumping over the years: Gigi DiGiacomo, Suzanne Wisniewski, Mary Beth Lake and Ben Lilliston.
Appendix
Dumping calculations
Wheat

Soybeans

Corn

Rice

Cotton



