


Several epidemiological studies have shown that elevated lipid levels in the postprandial state pose an individual risk for the development of coronary artery disease(Reference Fujioka and Ishikawa1, Reference Bell, O'Keefe and Jellinger2). Clinical studies have also shown that both the concentration and duration of postprandial lipidaemia play a role in the development and progression of atherosclerosis(Reference Le and Walter3, Reference Cohn4). All cells regulate gene expression in response to changes in the external environment. Nutrients can have a direct effect, interacting with transcription factors to regulate gene expression. This interaction between nutrients and gene response could be the key factor in the events that take place in the tissues where these nutrients are metabolised, since diet affects genes involved in lipid metabolism at the peripheral cell level. Experimental models have shown the lipid sensor response at the cellular level and its consequences on metabolism(Reference Collino, Patel and Thiemermann5), but in vivo mechanism of action in a multicellular organism, such as humans, is unknown. Fatty acid (FA) regulation of gene transcription seems to be due to the activity or abundance of at least four families of transcription factors: PPAR, liver X receptor (LXR), hepatic nuclear factor 4α and sterol regulatory element binding protein (SREBP). Except for SREBP, all these factors belong to the steroid and thyroid hormone nuclear receptor family. These genes regulate several metabolic pathways, from inflammatory and oxidative stress pathways to lipogenic and lipid metabolism pathways. In fact, the increase in the rate of lipogenesis after a meal is interesting because this may be a key factor influencing the atherogenicity of the postprandial state(Reference Hernández-Vallejo, Alqub and Luquet6). SREBP are members of the basic helix-loop-helix family of transcription factors, which have been associated with lipogenesis, adipocyte development and cholesterol homeostasis, and they transcriptionally activate a cascade of enzymes required for endogenous cholesterol, FA, TAG and phospholipid synthesis(Reference Eberle, Hegarty and Bossard7, Reference Kolehmainen, Vidal and Alhava8). They enhance the expression of multiple lipogenic genes such as FA synthase (FASN)(Reference Magana, Koo and Towle9).
LXR belongs to a family of nuclear receptors, which bind to the regulatory region of target genes and, upon ligand binding, regulate their transcription. Studies performed during the last decade have suggested that LXR are ‘cholesterol sensors’ which, in response to excess cholesterol, stimulate their transport to the liver and biliary excretion. Therefore, stimulation of LXR is a potentially useful therapeutic option for patients with dyslipidaemia(Reference Bełtowski10).
PUFA of the n-3 and n-6 family, such as arachidonic acid, EPA, DHA and linoleic acid, are competitive antagonists of the interaction between LXR and its ligands(Reference Yoshikawa, Shimano and Yahagi11). LXR agonists markedly stimulate FA synthesis (lipogenesis) in hepatocytes. This effect is partially mediated by the increased expression of SREBP1, which subsequently binds to the sterol response element within the promoter region of genes encoding numerous lipogenic enzymes(Reference Repa, Liang and Ou12).
Retinoid X receptor (RXR) is a nuclear receptor, which can modulate gene transcription by forming either homodimers or heterodimers with several other nuclear receptors, for example LXR and PPAR. In fact, to activate its target genes such as SREBP, LXR has to be associated to form a heterodimer with RXR, and some studies have shown that RXR can play a role in the control of TAG levels by activating the LXR target gene of lipogenesis(Reference Lalloyer, Pedersen and Gross13).
The objective of the present study was to determine the effect of a fat overload on the expression of nuclear sensors or genes related to lipid metabolism in peripheral cells and their association with serum lipids.
Experimental methods
Study subjects
The study included twenty-one patients (fifteen men and six women) with criteria for the metabolic syndrome, as defined by the Adult Treatment Panel III criteria(14), and with a normal oral glucose tolerance test. All the participants underwent a 60 g fat overload with a commercial preparation (Supracal©). Only water was permitted during the process, and no physical exercise was undertaken. The commercial preparation of 125 ml contains 60 g fat: 12 g are SFA, 35·35 g are MUFA and 12·75 g are PUFA. Each 100 ml contains less than 1 g lauric acid and 1 g myristic acid, 4·8 g palmitic acid, 1·4 g stearic acid, 27·7 g oleic acid, 9·6 g linoleic acid, 1·4 g behenic acid and 0·5 g lignoceric acid. The preparation contains no proteins or carbohydrates. The present study was conducted according to the guidelines laid down in the Declaration of Helsinki, and all procedures involving human subjects were approved by the Hospital ethics committee. Written informed consent was obtained from all subjects.
Study design
Before the fat overload, the participants' age as well as their height and weight to calculate their BMI was recorded. Also, waist and hip circumferences were measured with a soft tape midway between the lowest rib and the iliac crest to calculate the waist:hip ratio. In addition, blood samples were collected before and 3 and 4 h after the overload; serum and plasma were separated in aliquots within 30 min of extraction and immediately frozen at − 80°C. The same procedure was followed with the peripheral blood mononuclear cells (PBMC), which were isolated from anticoagulant-treated blood by Ficoll standard density gradient centrifugation. Briefly, an equal volume of blood and PBS was mixed, and then this was layered onto Ficoll (the same volume as blood or PBS). After centrifugation (1800 rpm, 30 min, 18°C; brake off), a white layer created under the plasma layer was aspirated, where PBMC were situated. Then, these PBMC were washed twice with PBS (1400 rpm, 10 min, 18°C; brake off) and finally were resuspended with RNAlater.
Methods
Biochemical variables were glucose, cholesterol, TAG, apo AI and apo B, all measured in a dimension autoanalyser (Dade Behring, Deerfield, IL, USA) in duplicate. Serum insulin concentration was quantified by an immunoradiometric assay (BioSource International, Camarillo, CA, USA). NEFA were measured in duplicate by standard enzymatic methods (Wako Chemicals, Richmond, VA, USA)(Reference Grundy15).
Lipid peroxidation products (malondialdehyde+4-hydroxyalkenals), GSSG, GSH and total glutathione (GSSG+GSH) levels were estimated using reagents purchased from Oxis International (Portland, OR, USA). Additionally, to determine the GSSG content, we used the following equation: GSSG = A − B; where A is the total glutathione and B is the GSH content. The protein carbonyl content was evaluated using the method of Levine et al. (Reference Levine, Garland and Oliver16).
RNA extraction and real-time quantitative PCR
PBMC RNA isolation was performed by an RNeasy Micro Kit (Qiagen, Barcelona, Spain), and the extracted RNA was treated with DNase (RNase-free DNase Set; Qiagen). For first-strand complementary DNA synthesis, a constant amount of 1 μg total RNA was reverse-transcribed using random hexamers as primers and using Transcriptor Reverse Transcriptase (Roche, Mannheim, Germany). Gene mRNA levels were assessed by real-time PCR using an ABI Prism 7000 Sequence Detection System (Applied Biosystems, Darmstadt, Germany), using TaqMan technology. The reaction was performed, following the manufacturer's protocol, in a final volume of 25 μl. The cycle programme consisted of an initial denaturing of 10 min at 95°C, then forty cycles of 15 s denaturing phase at 95°C, and 1 min annealing and extension phase at 60°C. The commercially available and prevalidated TaqMan primer/probe sets used were as follows: glyceraldehyde 3-phosphate dehydrogenase (4326317E, RefSeq. NM_002046.3, used as an endogenous control for the target gene in each reaction), FASN (Hs01005622_m1, RefSeq. NM_004104.4), SREBP1 (Hs01088691_m1, RefSeq. NM_004176.3 and NM_001005291.1), RXRα (Hs01067634_m1, RefSeq. NM_002957.4), LXRα (Hs00172885_m1, RefSeq. NM_001130102.1, NM_001130101.1 and NM_005693.2), stearoyl-coenzyme A desaturase (SCD1; Hs01682761_m1, RefSeq. NM_005063.4) and FA transport protein 1 (FATP1; Hs01587917_m1, RefSeq. NM_198580.1). A threshold cycle (C t) value was obtained for each amplification curve, and a ΔC t value was first calculated by subtracting the C t value for human glyceraldehyde 3-phosphate dehydrogenase complementary DNA from the C t value for each sample and transcript. Fold changes compared with the endogenous control were then determined by calculating 2− ΔC t, and the expression results are given as the expression ratio relative to glyceraldehyde 3-phosphate dehydrogenase gene expression, according to the manufacturer's guidelines. All the samples were quantified in duplicate, and positive and negative controls were included in all the reactions.
Statistical analysis
Data are expressed as means and standard deviations. Comparisons between experimental conditions (baseline v. post-fat overload) were made using the Wilcoxon text for paired samples. The Pearson (Spearman) correlations were made between study variables to evaluate their association. Values were considered to be statistically significant when P < 0·05 for two-tailed analysis. The analyses were performed using SPSS (version 15.0 for Windows; SPSS Iberica, Madrid, Spain).
Results
The anthropometric and biochemical variables of the study subjects and mRNA levels in the baseline and postprandial states are summarised in Table 1. After the fat overload, there was an increase in the plasma concentration of TAG, lipoperoxides, protein carbonyls and NEFA and in the mRNA levels of LXRα, RXRα and SREBP1.
(Mean values and standard deviations)
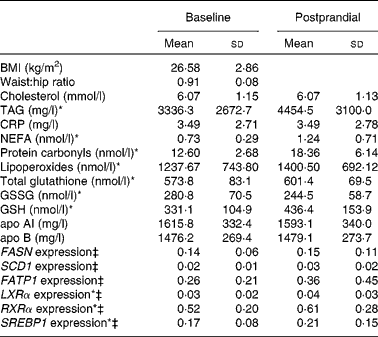
CRP, C-reactive protein; FASN, fatty acid synthase; SCD1, stearoyl-CoA desaturase; FATP1, fatty acid transport protein; LXRα, liver X receptor; RXRα, retinoid X receptor; SREBP1, sterol regulatory element binding proteins.
* Mean values were significantly different (P < 0·05).
† Intra-group comparison of means before and after the fat overload.
‡ Expression-level results are expressed as the expression ratio relative to glyceraldehyde 3-phosphate dehydrogenase gene expression by calculating 2− ΔC t, according to the manufacturer's guidelines.
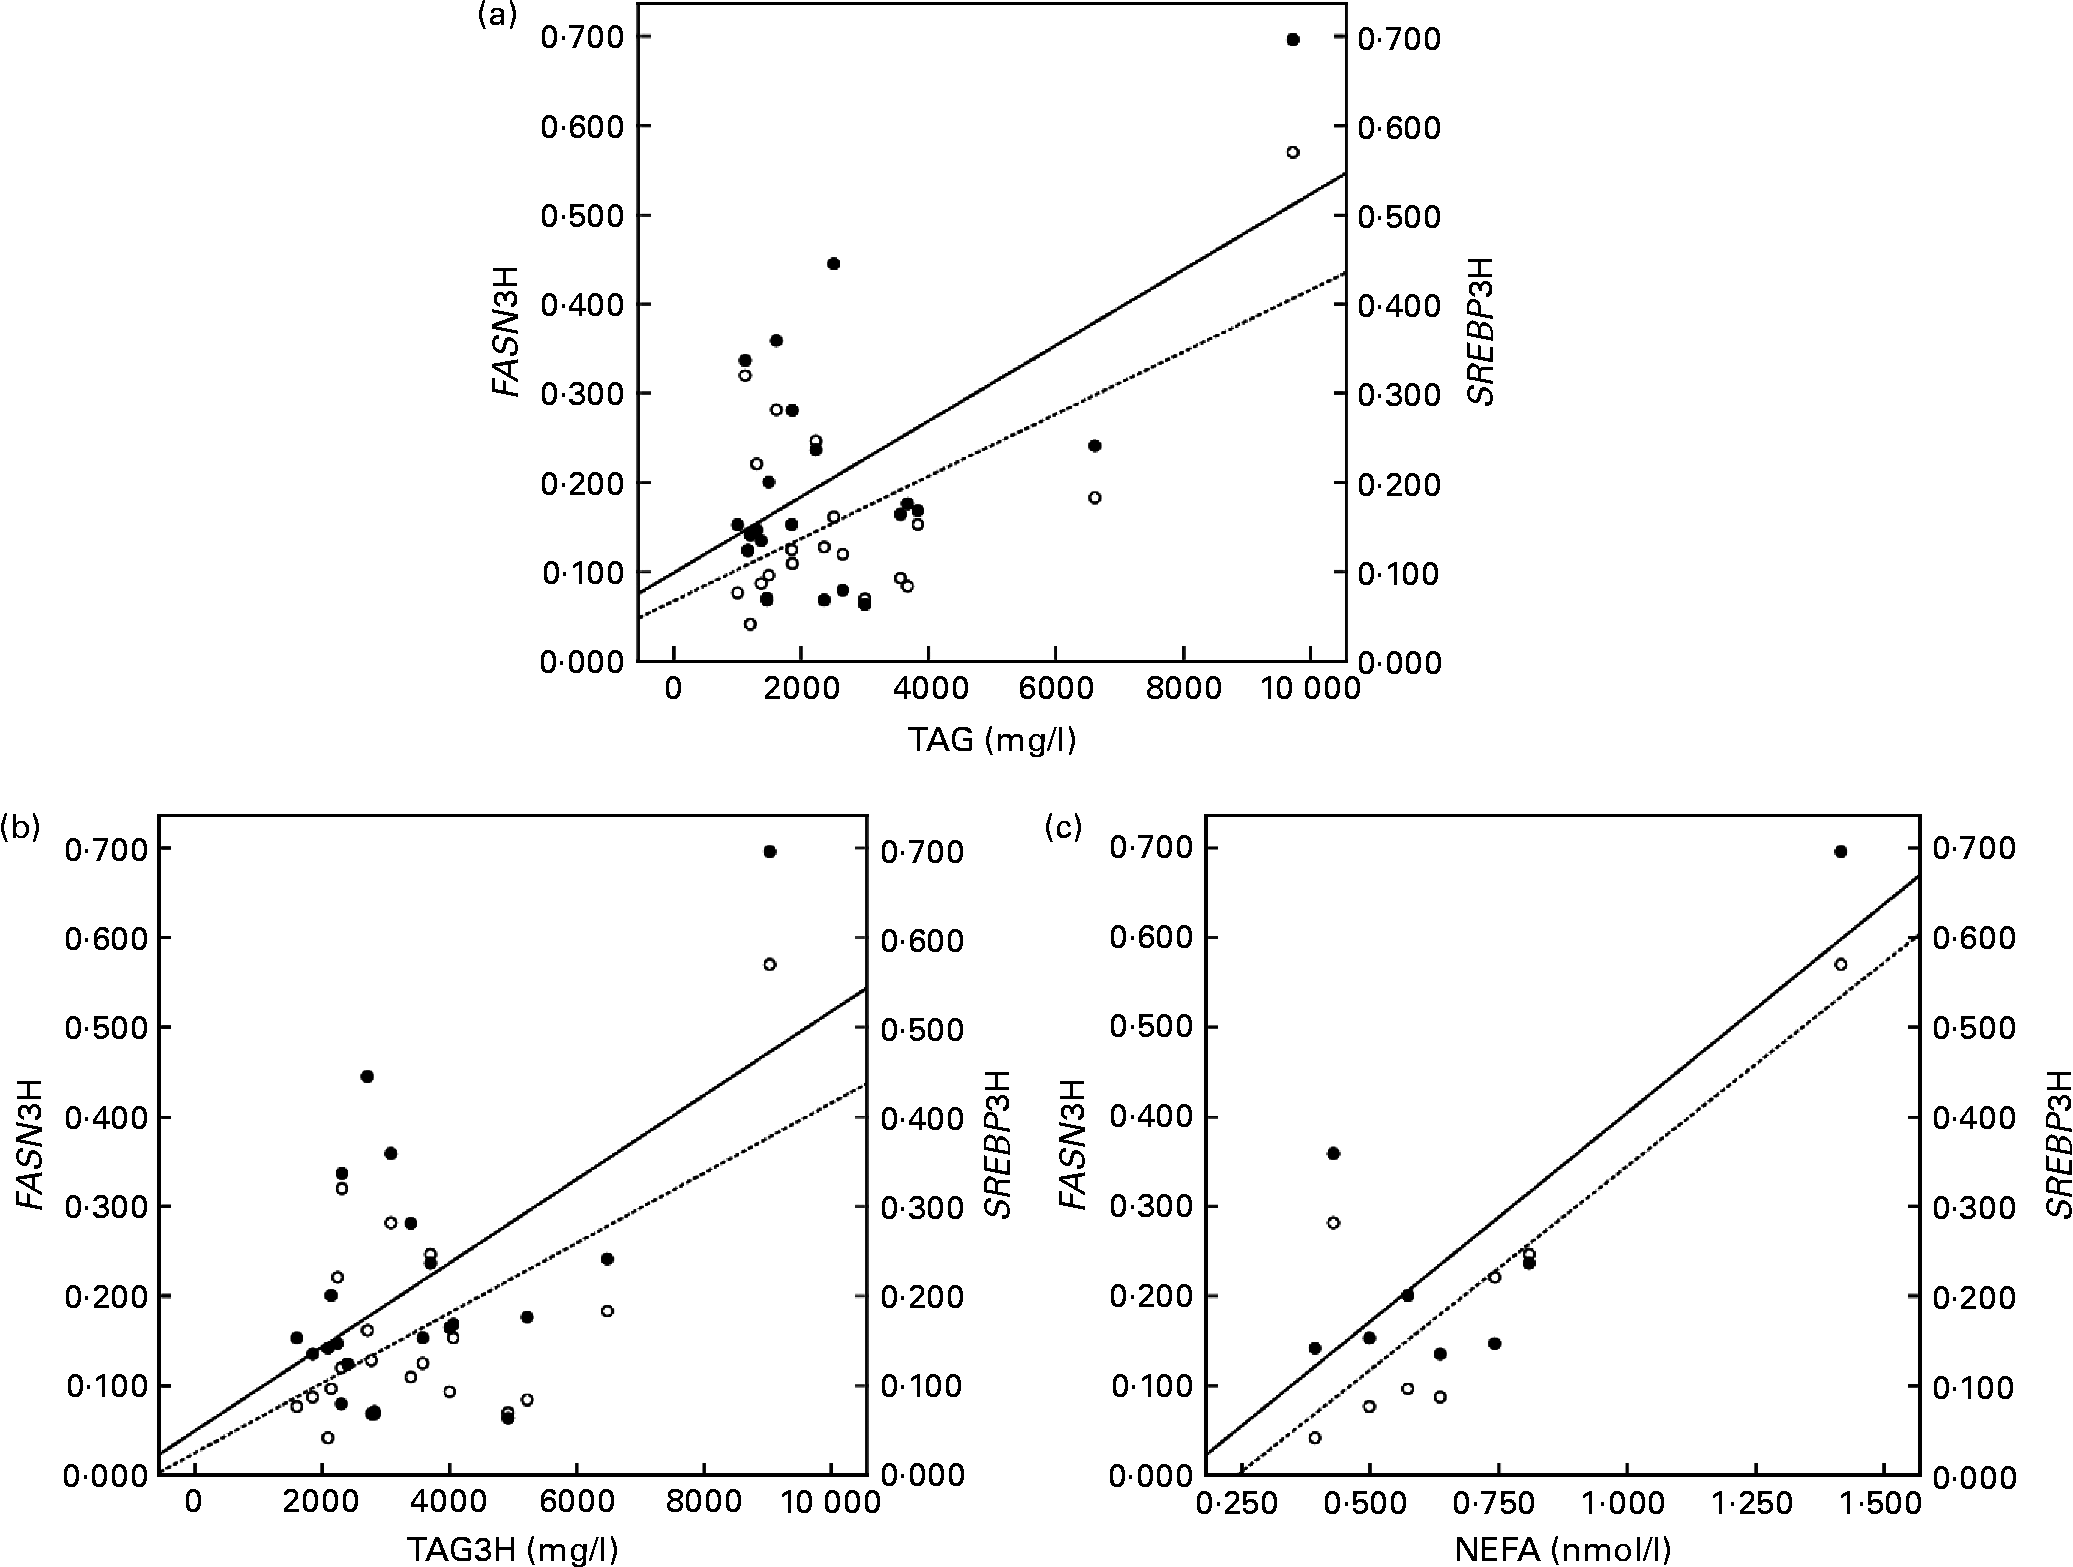
The correlation studies showed that both the baseline and postprandial plasma TAG levels correlated positively with insulin levels and with the mRNA levels of SREBP1 and FASN after the fat overload (r 0·595 and 0·592; P < 0·05, respectively, baseline; Fig. 1(a)) and (r 0·528 and 0·554; P < 0·001, respectively, postprandial; Fig. 1(b)). Likewise, baseline plasma NEFA concentrations correlated positively with FASN and SREBP1 following the fat overload (r 0·868 and 0·797; P < 0·05, respectively; Fig. 1(c)).
Linear relationship determined by Pearson's correlation coefficient test between (a) TAG at the baseline state and fatty acid synthase (FASN) mRNA levels (○ – –) and sterol regulatory element binding protein (SREBP) mRNA levels (● —) at the postprandial state (3 h later) (FASN3H and SREBP13H, respectively); FASN3H r 0·595 and SREBP1 r 0·592; P < 0·05, (b) TAG at the postprandial state (3 h later) and FASN mRNA levels (○ – –) and SREBP mRNA levels (● —) at the postprandial state (3 h later) (FASN3H and SREBP13H, respectively); FASN r 0·628 and SREBP1 r 0·554; P < 0·001, (c) NEFA at the baseline state and FASN mRNA levels (○ – –) and SREBP mRNA levels (● —) at the postprandial state (3 h later) (FASN3H and SREBP13H, respectively); FASN3H r 0·868 and SREBP1 r 0·797; P < 0·05. mRNA-level results are expressed as the expression ratio relative to glyceraldehyde 3-phosphate dehydrogenase gene expression by calculating 2− ΔC t, according to the manufacturer's guidelines.
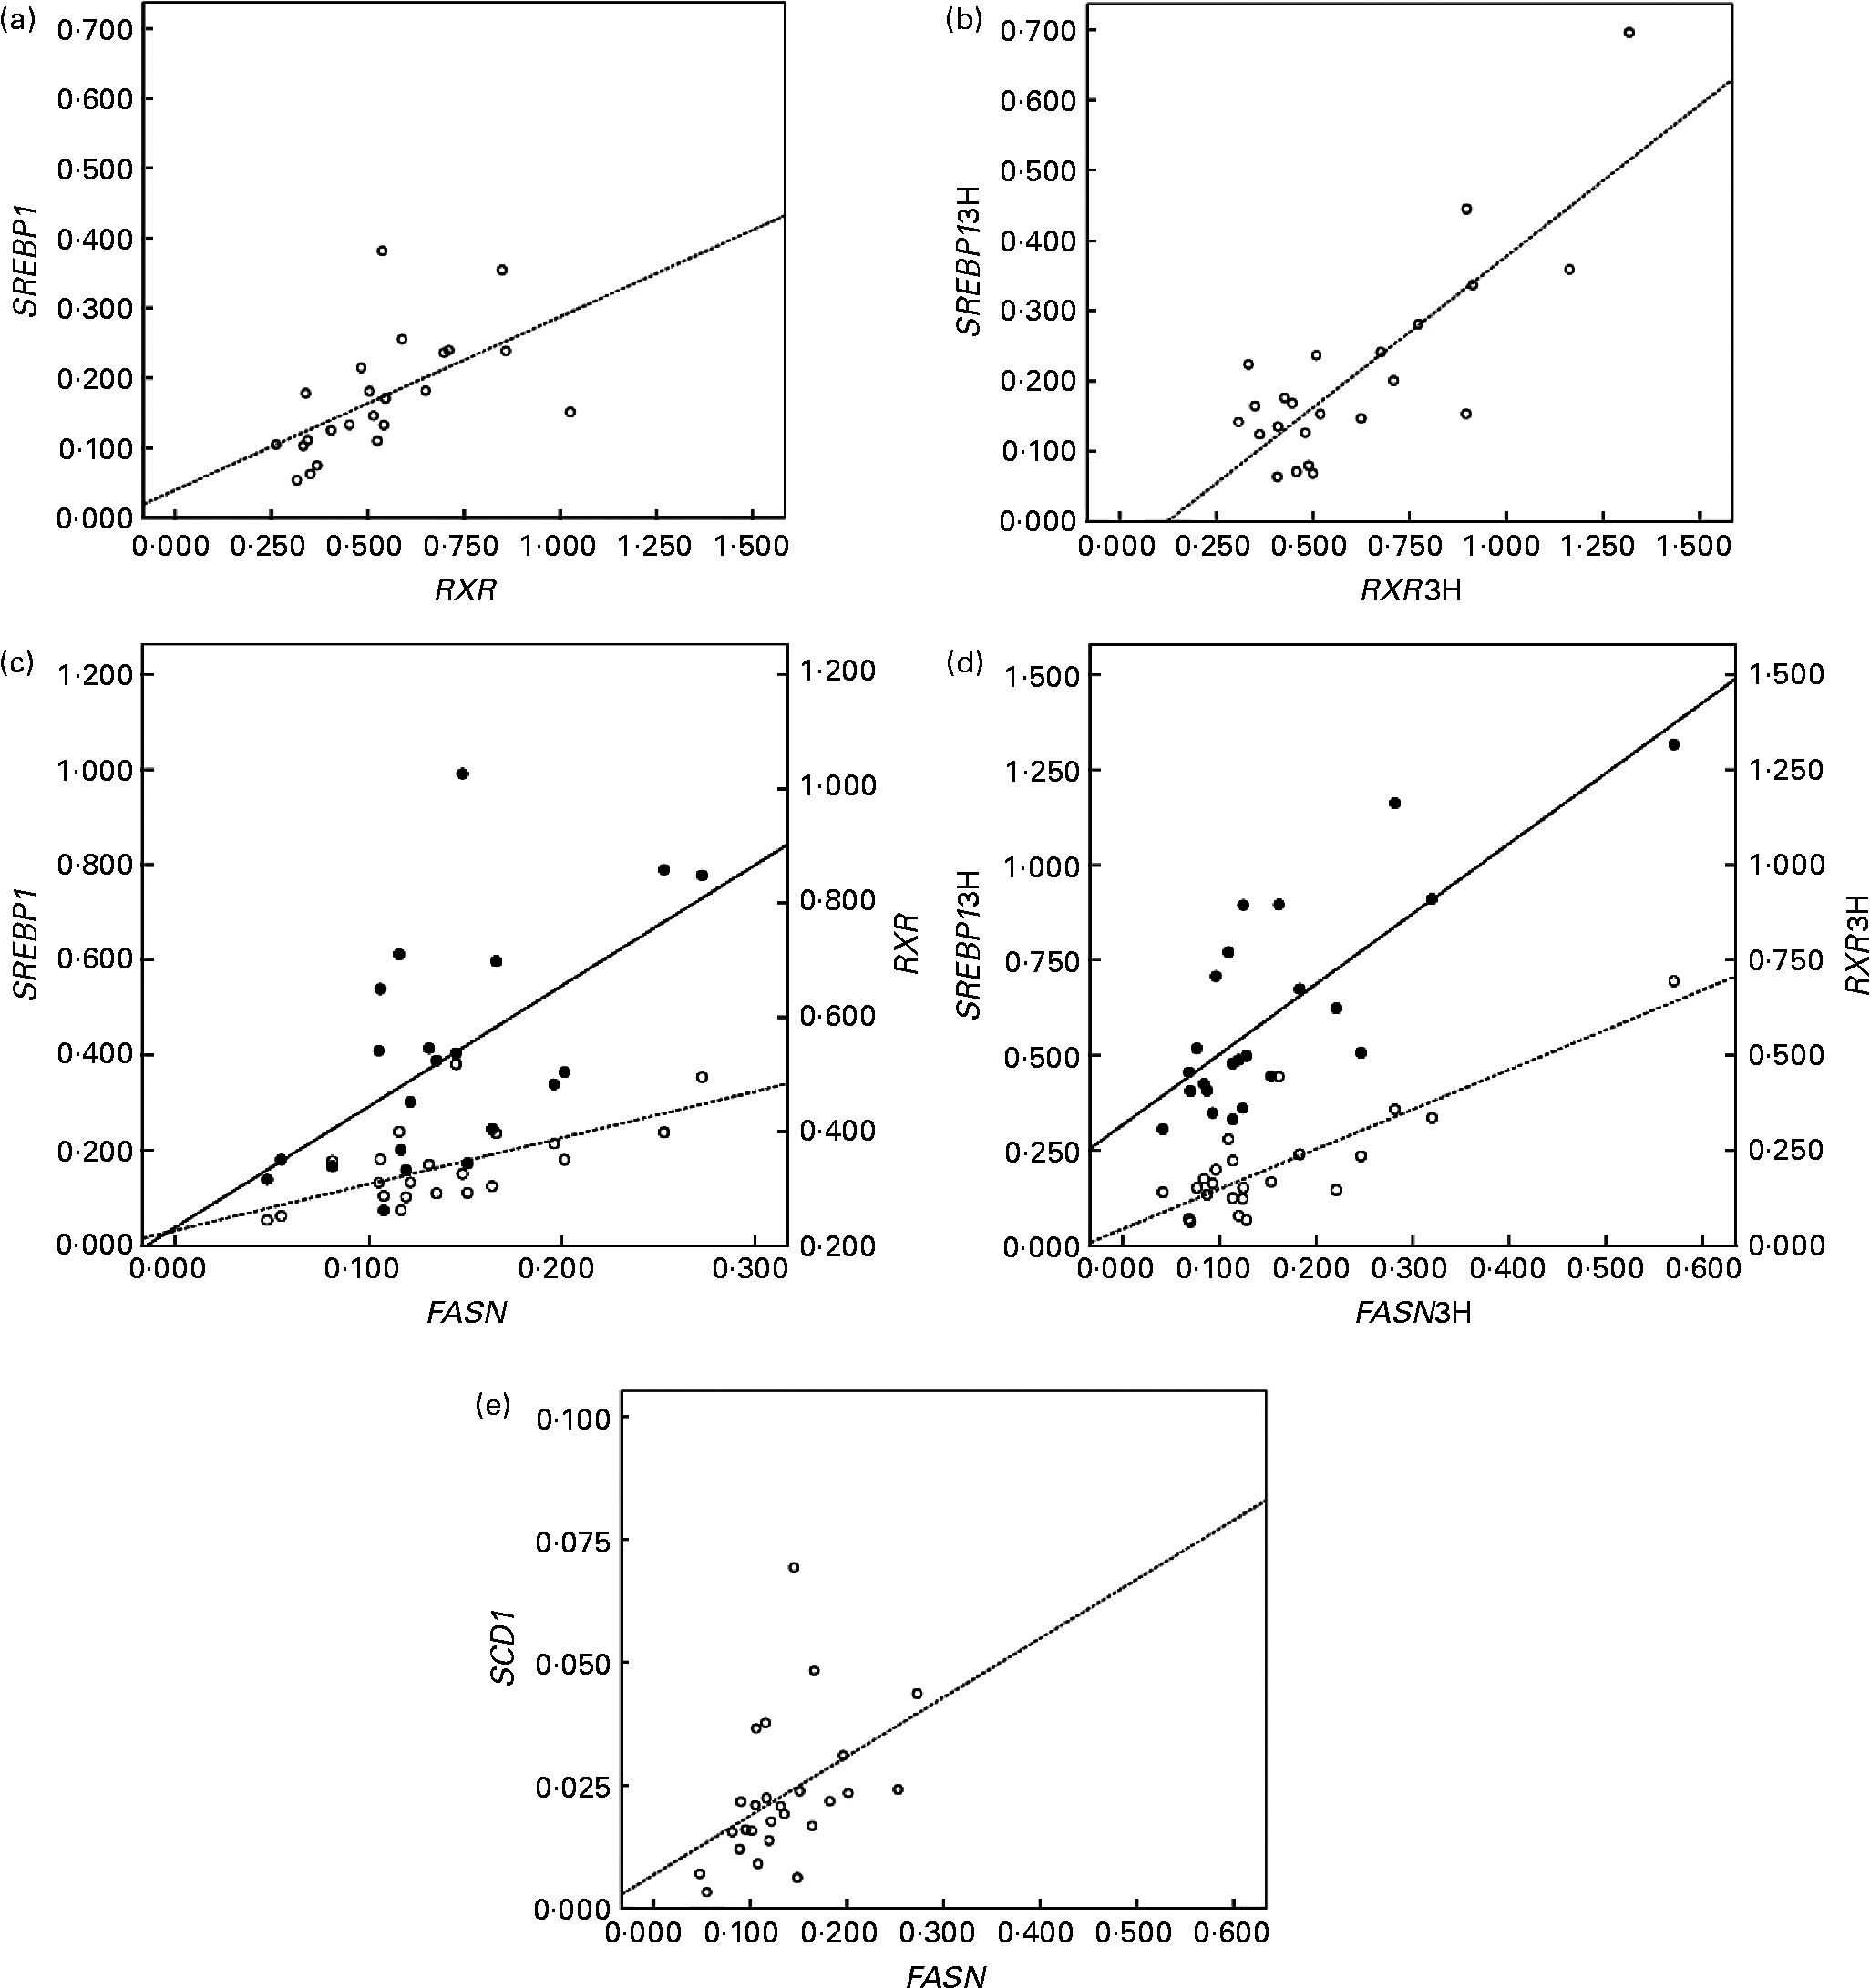
In addition, the up-regulated genes (LXRα, RXRα and SREBP1) correlated positively with lipogenic genes in peripheral cells (Fig. 2). RXRα mRNA levels correlated directly with SREBP1 at baseline (r 0·574; P < 0·05; Fig. 2(a)) and postprandially (r 0·839; P < 0·01; Fig. 2(b)). FASN mRNA levels correlated positively with RXRα and SREBP1 at baseline (r 0·594 and 0·632, respectively; P < 0·05; Fig. 2(c)), and postprandial FASN mRNA levels correlated with the postprandial mRNA levels of SREBP1 and RXRα (r 0·838 and 0·781, respectively, P < 0·01; Fig. 2(d)). Finally, the correlation of FASN mRNA levels with SCD1 mRNA levels at baseline was positive too (r 0·426; P < 0·05; Fig. 2(e)).
Linear relationship determined by Pearson's correlation coefficient test between (a) retinoid X receptor (RXR) mRNA levels and sterol regulatory element binding protein (SREBP) mRNA levels (○ – –) at the baseline state (RXRα and SREBP1, respectively); r 0·574; P < 0·01, (b) RXR mRNA levels and SREBP mRNA levels (○ – –) at the postprandial state (3 h later) (RXRα3H and SREBP13H, respectively); r 0·839; P < 0·01, (c) fatty acid synthase (FASN) mRNA levels and SREBP mRNA levels (○ – –) and RXR at the baseline state (FASN, SREBP1 and RXRα, respectively); SREBP1 r 0·632 and RXR r 0·594; P < 0·05, (d) FASN mRNA levels and SREBP mRNA levels (○ – –) and RXR (● —) at the postprandial state (3 h later) (FASN3H, SREBP13H and RXRα3H, respectively); SREBP13H r 0·838 and RXR3H r 0·781; P < 0·01, (e) FASN mRNA levels and stearoyl-coenzyme A desaturase mRNA levels (○ – –) at the baseline state (FASN and SREBP1, respectively) r 0·426; P < 0·05. mRNA-level results are expressed as the expression ratio relative to glyceraldehyde 3-phosphate dehydrogenase gene expression by calculating 2− ΔC t, according to the manufacturer's guidelines.
Baseline LXRα mRNA levels showed a direct correlation with biomarkers of oxidative stress (Table 2), i.e. baseline plasma lipoperoxide levels (r 0·902; P < 0·001), as well as with baseline GSH (r 0·612; P < 0·05) and baseline GSH with postprandial LXRα (r 0·783; P < 0·05). Baseline RXRα correlated with postprandial GSH (r 0·632; P < 0·05).
Correlations between lipogenic regulators and oxidative stress biomarkers
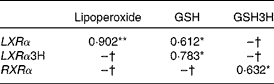
GSH3H, GSH 3 h; LXRα, liver X receptor; LXRα3H, liver X receptor 3 h; RXRα, retinoid X receptor.
*P < 0·01, **P < 0·05.
† No significant correlations.
Discussion
In the present study, we show for the first time that, in PBMC, a fat overload can lead to an increase (up-regulation) in the mRNA levels of nuclear regulators such as LXRα, RXRα and SREBP1, which are related to cell lipogenic capacity.
The type of dietary FA influences the levels of plasma lipoproteins. The down-regulation or up-regulation of genes also depends on the degree of FA saturation(Reference Clarke, Baillie and Jump17). In the present study, the fat overload contained a high proportion of MUFA and a low percentage of PUFA, mainly n-9, which explains the up-regulation of the FA target nuclear factors SREBP, RXRα and LXRα.
The association has been reported between an elevated postprandial TAG response to a fat overload and a greater risk for CVD and the metabolic syndrome(Reference Fujioka and Ishikawa1), greater inflammation, higher oxidative stress and more cardiovascular events(Reference Cardona, Túnez and Tasset18). Some years ago, our group described the genetic influence of certain apo polymorphisms on postprandial hypertriacylglycerolaemia, as well as the association between an increase in oxidative stress and plasma TAG levels in response to a fat overload(Reference Cardona, Túnez and Tasset18, Reference Macias-Gonzalez, Cardona and Queipo-Ortuño19). In the present study, we again show that a fat overload also increases the markers of oxidative stress such as glutathione, lipoperoxide and protein carbonyl levels. We have also studied the genetic expression of genes related to postprandial lipid metabolism, and a fat overload has been reported to be able to modify PPARγ expression in metabolic syndrome patients(Reference Cardona, Tunez and Tasset20). In the same way, the fat overload alters the mRNA levels of certain regulatory factors of lipid metabolism in peripheral cells.
As we have seen earlier, SREBP enhance the expression of lipogenic genes(Reference Magana, Koo and Towle9, Reference Shimomura, Matsuda and Hammer21) and are implicated in the pathophysiological development of obesity, type 2 diabetes mellitus, dyslipidaemia, atherosclerosis and the metabolic syndrome. SREBP gene expression is lower in adipose tissue from obese and type 2 diabetes mellitus patients(Reference Kolehmainen, Vidal and Alhava8, Reference Sewter, Berger and Considine22, Reference Diraison, Dusserre and Vidal23). In addition, animal models have shown that the processes of fasting and re-feeding produce an increased expression of lipogenic genes in liver cells, white adipose tissue and skeletal muscle, with a fall in SREBP1 at fasting and an increase after the intake of a carbohydrate-rich diet(Reference Eberlé, Hegarty and Bossard24). In the present study, the fat overload produced an increase in SREBP1 after its intake, probably due to the increase in dietary FA and the interconnection between lipid and carbohydrate metabolism.
RXR, when its RXRα function is altered, modifies the PPARα pathways, leading to alteration of the differentiation of preadipocytes in adipose tissue, producing obesity(Reference Imai, Jiang and Chambon25). In animal models, the loss of RXRα function causes, at the tissue level, alteration of PPARα pathways, for example FA oxidation. Reactive agents activate genes related to desaturation, such as SCD1 in muscle tissue. The present study shows that after the fat overload, there is a rise in RXR mRNA levels in peripheral cells due to an increase in FA activators of this regulatory element. In contrast, we detected no increase in SCD1 mRNA levels, probably because RXR activation enhances other specific pathways of these cells, such as the immune response or oxidative stress increase. In the present study, we observed a significant increase in LXR mRNA levels after the fat overload.
LXR seems to regulate SREBP expression in hepatic and adipose tissues(Reference Repa, Liang and Ou12, Reference Laffitte, Chao and Li26, Reference Muscat, Wagner and Hou27), which intervenes in the expression of enzymes involved in FA and TAG synthesis, such as FASN or SCD1. LXR binds directly to the SREBP promoter and activates FASN expression(Reference Ferré and Foufelle28). This is corroborated by in vivo models and in animal models without LXR, which have a reduced baseline SREBP, FASN and SCD1 expression(Reference Repa, Liang and Ou12, Reference Peet, Turley and Ma29). LXR is another nuclear receptor that forms heterodimers with RXR (Reference Hamada, Gleason and Levi30). RXR/LXR plays a relevant role in SREBP transcription activation mediated by insulin: insulin activates the SREBP promoter, leading to an increase in RXR/LXR transcriptional activity(Reference Chen, Liang and Ou31). In addition, the PPAR/RXR and LXR/RXR heterodimers have a sensor action for dietary lipids in peripheral cells(Reference Ricote, Valledor and Glass32), acting in cholesterol and NEFA homeostasis, with an important role in inflammation and atherosclerosis. Our data show that, after the fat overload, there is an increase in LXRα accompanied by an increase in RXR and SREBP mRNA levels, which confirms this hypothesis; moreover, this LXRα increase was associated with higher oxidative stress in the cells studied.
As we have seen earlier, SREBP, RXR and LXR are involved in inflammation/oxidative stress processes(Reference Sugden and Holness33), and the present results corroborate it showing the correlations positively between RXR and LXR mRNA levels and the markers of oxidative stress such as lipoperoxides and GSH, even after a fat overload.
Therefore, the main new finding is that these increases in nuclear regulator gene expression related to cell lipogenic capacity take place in peripheral cells in response to a stimulus, in this case a fat overload. In view of the results, we are aware that, although there are certain limitations in using these cells instead of adipose or hepatic tissue (hard to access), our data with PBMC corroborate previous results, even in animal models. Thus, the cellular response to an external TAG and FA increase may translate into an increased genetic expression of those genes directly implied in lipid metabolism. Our data allow the study of these pathways in peripheral cells, a much more accessible model than other tissues.
Acknowledgements
The present study was supported by the Instituto de Salud Carlos III (PS09/00997, PI081655 and CP07/0095) and Consejería de Innovación, Ciencia y Empresa (PI 325/08). There are no conflicts of interest. M. D. M. participated in drafting the manuscript, the genetic studies and in performing the statistical analysis. M. I. Q.-O. and M. C.-P. participated in the analysis of biochemical variables and in the statistical analysis. M. M. and R. E. B. were scientific advisers. F. J. T. and F. C. designed the research and participated in performing the statistical analysis. F. J. T. obtained the anthropometrical characteristics and the written consent of patients. F. C. and M. D. M. wrote the paper, and F. C. had primary responsibility for the final content.



