


1. Introduction
Over the past decades, a vast mathematical literature has been developed to describe the spread of epidemics. It has increased in recent years with the appearance of new infectious diseases (AIDS, dengue fever, COVID-19, etc.). A large part of the proposed models are based on a deterministic approach. Many of them can be found for example in the books of [Reference Brauer, Castillo-Chavez and Feng5] and [Reference Diekmann and Heesterbeek8]. In practice, however, a stochastic approach may be more relevant, especially for small or medium populations. The reader can refer on this subject to the books of [Reference Andersson and Britton1, Reference Britton and Pardoux6, Reference Daley and Gani7], for example.
Susceptible-Infected-Removed (SIR) epidemics concern infectious diseases in which the infectives remain infected for a random period of time before becoming permanently removed, through recovery or death. SIR-type models constitute a central part of the literature on epidemic theory. The overall extent of infection in such epidemics is traditionally measured by the final epidemic size, which represents the number of susceptibles who ultimately became infected. For the stochastic approach, the exact distribution of this statistic as well as different asymptotic distributions have been the subject of numerous works (see the books mentioned above and, among others, [Reference Ball2, Reference Lefèvre and Picard11, Reference Lefèvre and Simon13]).
The model. The present paper discusses an SIR-type Markovian epidemic process involving two connected populations: a relatively small local population of interest which is surrounded by a much larger external population.
(i) Within the local population, the epidemic spreads according to a bivariate Markovian SIR process. More precisely, each local infective remains infectious for an exponential time of parameter µ before being permanently removed. During this period, it can infect any of the susceptibles present, in number s say, independently and according to a Poisson process of rate βs. Many authors usually assume that  $\beta_s = \beta s$ (with β fixed) to reflect the fact that susceptibles are all equally prone to the disease. Working with a general form βs allows to model the dependence between the number of susceptible present and the speed at which a new infection occurs. For example, the choice $\beta_s = \beta s^{\lambda}$ (λ > 0) makes the infection rate non-linear in s which amounts to incorporating a certain group effect of the susceptibles (see the seminal paper by [Reference Severo17]). Of course, it is natural to take the function βs strictly increasing in s: the more susceptible people there are, the higher is the rate of infection.
(ii) The external population is also subject to an SIR epidemic process. However, due to its large size, the number of external susceptibles can be considered almost constant, so that the course of infection can be approximated by a linear birth–death process (see e.g. [Reference Barbour and Reinert4, Reference Lefèvre and Utev15] in a more general framework). Thus, each external infective is contagious for a random duration during which it can cause new external infections. After this period, the infective is permanently removed from the population.
(iii) The two populations are linked because the large epidemic is also a source of infection within the local population. Indeed, each external infective can enter the local population and remain there temporarily. During the visit, it can contact any of the s susceptibles present at the modified rate  $\alpha \beta_s$, where α < 1 (resp. α > 1) means that it is less (resp. more) infectious than an internal infective; on the other hand, it is no longer capable of generating external infections. An infected internal susceptible becomes exactly like an internal infective. If the external infective ever returns outside, this will of course strengthen the power of external infection; in this sense, there is a cross influence between the two populations.
The rules for external infectives to enter the local population can be quite complex and specified in various ways (e.g. by direct access, via a queue in a waiting room, subject to limited capacity of the local population). This is also true for their stay times inside the local population (e.g. by requiring several tasks to be completed before being allowed out). In the current model, entry rules and stay times are general and modeled using an arbitrary Markovian queueing system. In practice, this system only needs to be partially defined by Laplace-type transforms, independent of other dynamics of the epidemic process. These transforms will therefore be the necessary input to obtain the desired results; later they will be explicitly determined in particular situations.
Let us emphasize that the local population here is supposed to be closed: there is neither immigration nor emigration apart from temporary visits from external infectives.
Some applications. This model is of potential interest in several areas. In health care, the local setting could be a hospital or nursing home in which the susceptibles are the residents and the external infectives are the visitors. It is then important to estimate how many residents will be infected during the evolution of the epidemic.
In insurance risk theory, the local population could represent people who have taken out insurance against a given epidemic risk (as in [Reference Lefèvre, Picard and Simon12] where the susceptibles pay premiums and the infectives benefit from coverage for care costs). The question is then how the progression of the epidemic in the external population affects the level of the premiums paid by susceptibles.
In terms of reliability, the local structure could be a set of load-dependent components subject to cascading failures (as described by [Reference Dobson, Carreras and Newman9] for electrical power transmission). With interconnected systems, it then becomes relevant to quantify the benefit, positive or not, of opening to the outside.
Note that models involving several types of infectives have been studied previously, notably by [Reference Picard and Lefèvre16] for a multipopulation extension of the SIR epidemic, and by [Reference Ball, Britton and Trapman3] for an immigration of infected people implying that the disease never disappears. The model examined here is therefore different since it takes the appearance of a queueing system with an internal SIR structure.
Our objective. The epidemic ends at time T when there is no longer any source of infection in the local and external populations. We are mainly interested in the number of individuals who were finally infected in the two populations.
For this purpose, we first build a family of martingales which includes information on the numbers  $(S_t,I_t)$ of susceptibles and infectives in the local population at time t, the numbers $(J_t,V_t)$ of external infectives in the two populations at time t, and the numbers $(E_t, R_t)$ where Et counts the times an external infective entered the local structure and Rt counts the external infectives removed from both populations up to time t.
The end time T corresponding to a stopping time for the epidemic, we can then apply the classical theorems of stopping time or convergence of martingales. This will provide us with the exact distribution sought for the final population state  $(S_T,E_T,R_T)$, in particular its moments and linear correlations.
The paper is organized as follows. In Section 2, we construct a family of martingales for the proposed general epidemic model. We then use these martingales to obtain the distribution of the final epidemic size. For this, we are led to separately discuss the cases where the infection dies out in a finite time or not. In Section 3, we focus on the special model where the external infection is represented by a linear birth-death process. The reproduction number for this epidemic is also derived and a different, more standard, recursive approach is presented. Section 4 concerns two variants of the preceding epidemic model. In the first, an external infective enters the local population only once, while in the second, access is restricted by a limited capacity of the local population. For the latter model, the external infection process loses its linearity, which greatly complicates the analysis. In Section 5, we numerically illustrate some of the results and show possible influences of the external infection.
2. The final epidemic state distribution
For the local population, the numbers of susceptibles and infectives present at time t are denoted, as usual, by St and It. Initially,  $S_0=n$ and $I_0=m$.
Infectives from the external population can be inside or outside the local population in the course of time. So, we denote:
 \begin{align*}
&J_t, \mbox{the number of external infectives inside the local population at time } t, \mbox{and}\\
&V_t, \mbox{the number of external infectives outside the local population at time } t.
\end{align*}
\begin{align*}
&J_t, \mbox{the number of external infectives inside the local population at time } t, \mbox{and}\\
&V_t, \mbox{the number of external infectives outside the local population at time } t.
\end{align*} The external process  $\{(J_t,V_t), t\geq 0\}$ is an arbitrary Markov queueing process, with initially $J_0=m_J$ and $V_0=m_V$. Note that Jt and Vt could be multivariate vectors. This may occur, for example, when the disease has several stages of infection, or when a visitor must perform successive tasks among the local population before being able to return outside.
Of course, the model could be extended to the case where internal infectives are also represented by multivariate vectors (see e.g. [Reference Simon18]). This is not discussed here for clarity.
Example. Before starting the analysis, let us present a so-called basic epidemic process which is covered by our model. For the local population,  $\{(S_t,I_t), t\geq 0\}$ is a SIR Markovian process with infection rate βs (with s susceptibles) and removal rate µ per infective. For the external population, $\{(J_t,V_t), t\geq 0\}$ is assumed to be described by a linear branching process. Specifically, any of the Vt external infectives gives birth to a new external infective at rate γ or is removed at rate η. Each of them can enter the local population at rate λ and thus moves from the class V to J. While in the local population, it can infect a local susceptible (among s) at rate $\alpha \beta_s$. Any of the Jt external infectives returns to the external population at rate ν or is removed at rate κ. The whole epidemic
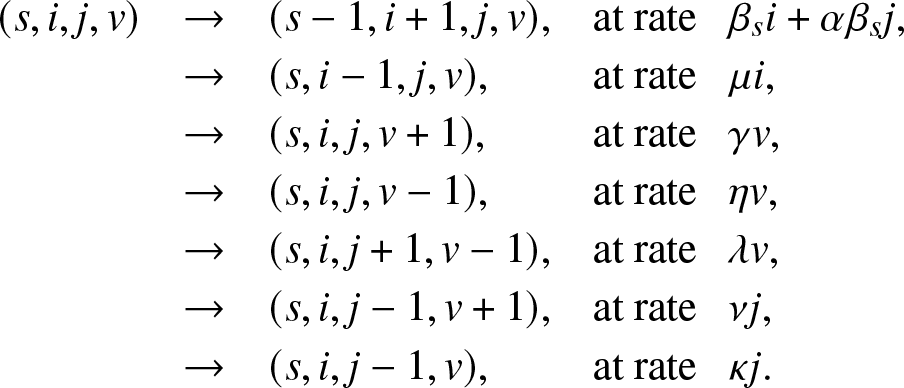
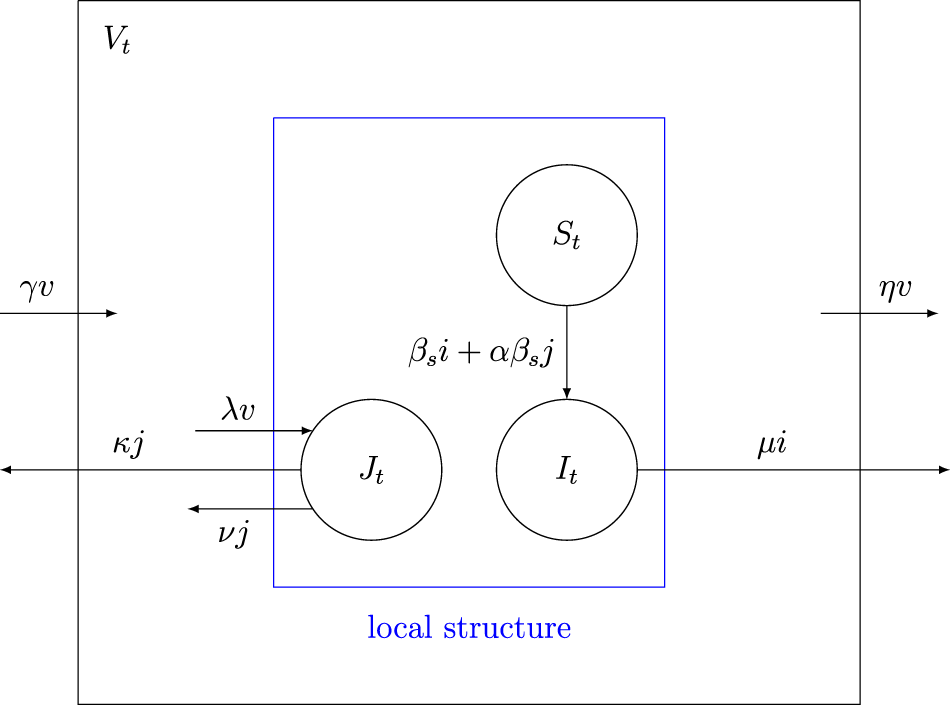
  $\{(S_t,I_t,J_t,V_t), t \ge 0\}$ is then represented by a Markovian process whose instantaneous transitions are:
 \begin{equation}
\begin{array}{lcll}
(s,i,j,v) & \rightarrow & (s-1,i+1,j,v), & \text{at rate}\,\,\, ~ \beta_s i + \alpha \beta_s j,\\
& \rightarrow & (s,i-1,j,v) ,& \text{at rate}\,\,\,\ \mu i,\\
& \rightarrow & (s,i,j,v+1) ,& \text{at rate}\,\,\,\ \gamma v,\\
& \rightarrow & (s,i,j,v-1) ,& \text{at rate}\,\,\,\ \eta v,\\
& \rightarrow & (s,i,j+1,v-1) ,& \text{at rate}\,\,\,\ \lambda v,\\
& \rightarrow & (s,i,j-1,v+1) ,& \text{at rate}\,\,\,\ \nu j,\\
& \rightarrow & (s,i,j-1,v) ,& \text{at rate}\,\,\,\ \kappa j.
\end{array}
\end{equation}
\begin{equation}
\begin{array}{lcll}
(s,i,j,v) & \rightarrow & (s-1,i+1,j,v), & \text{at rate}\,\,\, ~ \beta_s i + \alpha \beta_s j,\\
& \rightarrow & (s,i-1,j,v) ,& \text{at rate}\,\,\,\ \mu i,\\
& \rightarrow & (s,i,j,v+1) ,& \text{at rate}\,\,\,\ \gamma v,\\
& \rightarrow & (s,i,j,v-1) ,& \text{at rate}\,\,\,\ \eta v,\\
& \rightarrow & (s,i,j+1,v-1) ,& \text{at rate}\,\,\,\ \lambda v,\\
& \rightarrow & (s,i,j-1,v+1) ,& \text{at rate}\,\,\,\ \nu j,\\
& \rightarrow & (s,i,j-1,v) ,& \text{at rate}\,\,\,\ \kappa j.
\end{array}
\end{equation}Figure 1 graphically illustrates the possible transitions with the corresponding rates. This example will be discussed in more detail in Section 3.
Diagram of the basic epidemic process with its transition rates.
Let us return to the general model. The epidemic ends as soon as there is no longer a source of infection in the population, i.e. at the stopping time:
 \begin{equation*}
T = \inf\{t\ge 0 \,|\, I_t=0 \,\mbox{and } J_t=V_t=0\}.
\end{equation*}
\begin{equation*}
T = \inf\{t\ge 0 \,|\, I_t=0 \,\mbox{and } J_t=V_t=0\}.
\end{equation*} The local population  $\{(S_t, I_t), t\geq 0\}$ has a bounded state space and without the external infectives, it would end with the extinction, in a finite time, of the internal infectives. Therefore, T is almost surely (a.s.) finite if and only if the external epidemic $\{(J_t,V_t), t\geq 0\}$ dies out almost surely in a finite time.
2.1. A martingale approach
As announced, the evolution of the external infection may only be partially modeled at first. Let us denote,
 \begin{align*}
&E_t, \mbox{the number of times an external infective entered the local population up to } t, \mbox{and}\\
&R_t, \mbox{the number of external infectives removed from both populations up to } t.
\end{align*}
\begin{align*}
&E_t, \mbox{the number of times an external infective entered the local population up to } t, \mbox{and}\\
&R_t, \mbox{the number of external infectives removed from both populations up to } t.
\end{align*}The only information we will need about the process  $\{(J_t,V_t), t\geq 0\}$ is the following Laplace-like transforms: for $k\in \{0,\ldots , n\}$ and $y,z\in (0,1]$,
 \begin{equation}
g_{k,y,z}(\,j,v) = \mathbb{E}\left[ y^{E_T} z^{R_T} \, \mathbb{1}_{\{T \lt \infty, \, C_k\}} \,\big|\, (S_0,I_0)=(k,0), (J_0, V_0)=(\,j,v) \right], \quad j,v \in \mathbb{N}_0,
\end{equation}
\begin{equation}
g_{k,y,z}(\,j,v) = \mathbb{E}\left[ y^{E_T} z^{R_T} \, \mathbb{1}_{\{T \lt \infty, \, C_k\}} \,\big|\, (S_0,I_0)=(k,0), (J_0, V_0)=(\,j,v) \right], \quad j,v \in \mathbb{N}_0,
\end{equation}where Ck is the event that the k initial susceptibles all escape the infection generated by an external epidemic initiated by  $(J_0,V_0)=(\,j,v)$ infectives ( $\mathbb{N}_0=\{0,1,\ldots\}$). These transforms, assumed here known, will be made explicit in Sections 3 and 4 for particular situations.We start by deriving a family of martingales for the process $\{(S_t, I_t, J_t, V_t, E_t, R_t), t\geq 0\}$.
Proposition 2.1. For each  $k\in \{0,\ldots,n\}$ and any $y,z \in (0,1]$, consider the process:
 \begin{equation}
M_k(t) = \pi_k(S_t) \, y^{E_t} \, z^{R_t} \, q(k)^{S_t+I_t} \, g_{k,y,z}(J_t,V_t), \quad t\geq 0,
\end{equation}
\begin{equation}
M_k(t) = \pi_k(S_t) \, y^{E_t} \, z^{R_t} \, q(k)^{S_t+I_t} \, g_{k,y,z}(J_t,V_t), \quad t\geq 0,
\end{equation} using the notation (2.2) for  $g_{k,y,z}(J_t,V_t)$. Then, $\{M_k(t), t\geq 0\}$ is a martingale if:
 \begin{equation}
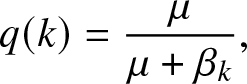
q(k) = \frac{\mu}{\mu+\beta_k},
\end{equation}
\begin{equation}
q(k) = \frac{\mu}{\mu+\beta_k},
\end{equation}and
 \begin{equation}
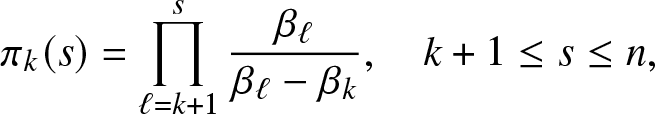
\pi_k(s) = \prod_{\ell=k+1}^{s} \frac{\beta_{\ell}}{\beta_{\ell}-\beta_{k}}, \quad k+1\leq s\leq n,
\end{equation}
\begin{equation}
\pi_k(s) = \prod_{\ell=k+1}^{s} \frac{\beta_{\ell}}{\beta_{\ell}-\beta_{k}}, \quad k+1\leq s\leq n,
\end{equation} with  $\pi_n(n)\equiv 1$.
Proof. To begin with, we look for bounded functions f and h such that the process:
 \begin{equation*}
M(t)=f(S_t,I_t) \, h(J_t,V_t) \, y^{E_t} z^{R_t}, \quad t\geq 0,
\end{equation*}
\begin{equation*}
M(t)=f(S_t,I_t) \, h(J_t,V_t) \, y^{E_t} z^{R_t}, \quad t\geq 0,
\end{equation*}is a martingale with respect to  $(\mathcal{F}_t)_{t \ge 0}$, the σ-algebra generated by the epidemic model up to time t. For that, we fix $t_0\ge 0$ and define the conditional expectations:
 \begin{equation*}
m(t) = \mathbb{E}\left[ M(t) \,|\, \mathcal{F}_{t_0} \right], \quad t\geq t_0.
\end{equation*}
\begin{equation*}
m(t) = \mathbb{E}\left[ M(t) \,|\, \mathcal{F}_{t_0} \right], \quad t\geq t_0.
\end{equation*}It then suffices to find functions  $f(\cdot,\cdot)$ and $h(\cdot,\cdot)$ such as the right derivative of m(t), denoted $m_r^{\prime} ( t )$, equals 0 for all $t \geq t_0$.
To differentiate m(t), we use  $\mathcal{F}_{t_0} \subseteq \mathcal{F}_{t}$ and the tower property to write:
 \begin{equation}
m(t+dt) = \mathbb{E}\left[ M(t+dt) \,|\, \mathcal{F}_{t_0} \right]
= \mathbb{E}\left(\mathbb{E}\left[ M(t+dt) \,|\, \mathcal{F}_{t} \right] \,\big|\, \mathcal{F}_{t_0}\right).
\end{equation}
\begin{equation}
m(t+dt) = \mathbb{E}\left[ M(t+dt) \,|\, \mathcal{F}_{t_0} \right]
= \mathbb{E}\left(\mathbb{E}\left[ M(t+dt) \,|\, \mathcal{F}_{t} \right] \,\big|\, \mathcal{F}_{t_0}\right).
\end{equation}In (2.6), consider the conditional expectation at time t + dt given  $\mathcal{F}_{t}$. During the time interval $(t, t+dt)$, the local entity can know only three events: the infection of a susceptible, the elimination of an infective or neither of the two, the other possibilities occurring with a probability o(dt). So, we can write that up to o(dt),
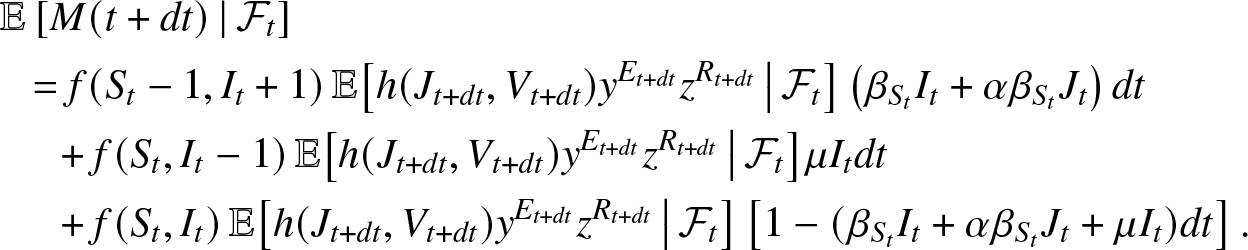 \begin{align*}
&\mathbb{E}\left[ M(t+dt) \,|\, \mathcal{F}_{t} \right] \\
&~~= f(S_t-1, I_t+1) \,\mathbb{E}\big[ h(J_{t+dt}, V_{t+dt}) y^{E_{t+dt}} z^{R_{t+dt}} \, \big| \, \mathcal{F}_{t} \big] \left(\beta_{S_t}I_t + \alpha\beta_{S_t} J_t\right) dt\\
&~~~~~+ f(S_t, I_t-1) \,\mathbb{E}\big[ h(J_{t+dt}, V_{t+dt}) y^{E_{t+dt}} z^{R_{t+dt}} \, \big| \, \mathcal{F}_{t} \big] \mu I_t dt\\
&~~~~~+ f(S_t, I_t) \,\mathbb{E}\big[ h(J_{t+dt}, V_{t+dt}) y^{E_{t+dt}} z^{R_{t+dt}} \, \big| \, \mathcal{F}_{t} \big] \left[1 - (\beta_{S_t} I_t + \alpha \beta_{S_t} J_t + \mu I_t) dt\right].
\end{align*}
\begin{align*}
&\mathbb{E}\left[ M(t+dt) \,|\, \mathcal{F}_{t} \right] \\
&~~= f(S_t-1, I_t+1) \,\mathbb{E}\big[ h(J_{t+dt}, V_{t+dt}) y^{E_{t+dt}} z^{R_{t+dt}} \, \big| \, \mathcal{F}_{t} \big] \left(\beta_{S_t}I_t + \alpha\beta_{S_t} J_t\right) dt\\
&~~~~~+ f(S_t, I_t-1) \,\mathbb{E}\big[ h(J_{t+dt}, V_{t+dt}) y^{E_{t+dt}} z^{R_{t+dt}} \, \big| \, \mathcal{F}_{t} \big] \mu I_t dt\\
&~~~~~+ f(S_t, I_t) \,\mathbb{E}\big[ h(J_{t+dt}, V_{t+dt}) y^{E_{t+dt}} z^{R_{t+dt}} \, \big| \, \mathcal{F}_{t} \big] \left[1 - (\beta_{S_t} I_t + \alpha \beta_{S_t} J_t + \mu I_t) dt\right].
\end{align*}Subtract m(t) from both sides of this equality, divide by dt and take the limit  $dt \to 0^+$. Using (2.6), we obtain by the dominated convergence theorem:
 \begin{align}
m_r^{\prime}(t) &= \mathbb{E}\bigg[f(S_t-1, I_t+1) h(J_{t}, V_{t}) y^{E_{t}} z^{R_{t}} \left(\beta_{S_t}I_t + \alpha\beta_{S_t} J_t\right) \nonumber\\
&\qquad~+ f(S_t, I_t-1) h(J_{t}, V_{t}) y^{E_{t}} z^{R_{t}} \mu I_t\\
&\qquad~ - f(S_t, I_t) h(J_{t}, V_{t}) y^{E_{t}} z^{R_{t}} (\beta_{S_t} I_t + \alpha \beta_{S_t} J_t + \mu I_t) \nonumber \\
&\qquad~ +f(S_t, I_t)\lim_{dt\to 0^+} \frac{1}{dt} \Big(\mathbb{E}\big[h(J_{t+dt}, V_{t+dt}) y^{E_{t+dt}} \, z^{R_{t+dt}} \, \big| \, \mathcal{F}_{t} \big] - h(J_{t}, V_{t}) y^{E_{t}} z^{R_{t}}\Big) \, \bigg| \, \mathcal{F}_{t_0} \bigg]. \nonumber
\end{align}
\begin{align}
m_r^{\prime}(t) &= \mathbb{E}\bigg[f(S_t-1, I_t+1) h(J_{t}, V_{t}) y^{E_{t}} z^{R_{t}} \left(\beta_{S_t}I_t + \alpha\beta_{S_t} J_t\right) \nonumber\\
&\qquad~+ f(S_t, I_t-1) h(J_{t}, V_{t}) y^{E_{t}} z^{R_{t}} \mu I_t\\
&\qquad~ - f(S_t, I_t) h(J_{t}, V_{t}) y^{E_{t}} z^{R_{t}} (\beta_{S_t} I_t + \alpha \beta_{S_t} J_t + \mu I_t) \nonumber \\
&\qquad~ +f(S_t, I_t)\lim_{dt\to 0^+} \frac{1}{dt} \Big(\mathbb{E}\big[h(J_{t+dt}, V_{t+dt}) y^{E_{t+dt}} \, z^{R_{t+dt}} \, \big| \, \mathcal{F}_{t} \big] - h(J_{t}, V_{t}) y^{E_{t}} z^{R_{t}}\Big) \, \bigg| \, \mathcal{F}_{t_0} \bigg]. \nonumber
\end{align} According to (2.7), we see that the condition  $m_r^{\prime}(t) =0$ is certainly satisfied if the two following identities are verified. On the one hand, by imposing that the terms of factor It have zero sum, we ask that,
 \begin{equation}
(\beta_s +\mu) f(s,i) = \beta_s \,f(s-1,i+1) + \mu f(s,i-1), \quad \mbox{for all } s, i.
\end{equation}
\begin{equation}
(\beta_s +\mu) f(s,i) = \beta_s \,f(s-1,i+1) + \mu f(s,i-1), \quad \mbox{for all } s, i.
\end{equation}On the other hand, the remaining terms are also required to be zero sum, i.e.
 \begin{align}
0 &= \mathbb{E}\bigg[\Big(f(S_t-1, I_t+1) - f(S_t, I_t)\Big) h(J_{t}, V_{t}) y^{E_{t}} z^{R_{t}} \alpha \beta_{S_t}J_t \nonumber \\
&\qquad~+f(S_t, I_t)\lim_{dt\to 0^+} \frac{1}{dt} \Big(\mathbb{E}\big[h(J_{t+dt}, V_{t+dt}) y^{E_{t+dt}} z^{R_{t+dt}} \, \big| \, \mathcal{F}_{t} \big] - h(J_{t}, V_{t}) y^{E_{t}} z^{R_{t}}\Big) \, \bigg| \, \mathcal{F}_{t_0} \bigg].
\end{align}
\begin{align}
0 &= \mathbb{E}\bigg[\Big(f(S_t-1, I_t+1) - f(S_t, I_t)\Big) h(J_{t}, V_{t}) y^{E_{t}} z^{R_{t}} \alpha \beta_{S_t}J_t \nonumber \\
&\qquad~+f(S_t, I_t)\lim_{dt\to 0^+} \frac{1}{dt} \Big(\mathbb{E}\big[h(J_{t+dt}, V_{t+dt}) y^{E_{t+dt}} z^{R_{t+dt}} \, \big| \, \mathcal{F}_{t} \big] - h(J_{t}, V_{t}) y^{E_{t}} z^{R_{t}}\Big) \, \bigg| \, \mathcal{F}_{t_0} \bigg].
\end{align}From here, we decide to focus on a function f which is of the form:
 \begin{equation}
f(s,i) = q^{s+i} r(s), \,\,\, \mbox{for all } s, i,
\end{equation}
\begin{equation}
f(s,i) = q^{s+i} r(s), \,\,\, \mbox{for all } s, i,
\end{equation} where  $r(\cdot)$ and q are to be fixed. The relation (2.8) then reduces to:
 \begin{equation*}
(\beta_s +\mu) q r(s) = \beta_s q r(s-1) + \mu r(s),
\end{equation*}
\begin{equation*}
(\beta_s +\mu) q r(s) = \beta_s q r(s-1) + \mu r(s),
\end{equation*}or equivalently,
 \begin{equation}
[(\beta_s+\mu)q - \mu]r(s) = \beta_s q r(s-1).
\end{equation}
\begin{equation}
[(\beta_s+\mu)q - \mu]r(s) = \beta_s q r(s-1).
\end{equation} Let us set any value of k in  $\{0,\ldots,n\}$ and choose q so that the bracket to the left of (2.11) vanishes when s = k. This means that $q \equiv q(k)$ is given by the announced expression (2.4). Moreover, (2.11) then implies that $r(s)=0$ for s < k and
 \begin{equation}
(\beta_s-\beta_k)r(s) = \beta_s r(s-1), \,\,\, \mbox{for } s \gt k.
\end{equation}
\begin{equation}
(\beta_s-\beta_k)r(s) = \beta_s r(s-1), \,\,\, \mbox{for } s \gt k.
\end{equation} Fix now the value of k by requiring  $r(k)=1$. The recursion (2.12) then gives $r(s)\equiv \pi_k(s)$ as indicated in formula (2.5).
Consequently, f defined by (2.10) is denoted, using (2.4) and (2.5), as  $f_k(S_t,I_t) = q(k)^{S_t+I_t}\pi_k(S_t)$. By injecting this function into (2.9) and noting that $\pi_k(S_t-1)-\pi_k(S_t)=-\beta_k \pi_k(S_t)$, the identity (2.9) becomes:
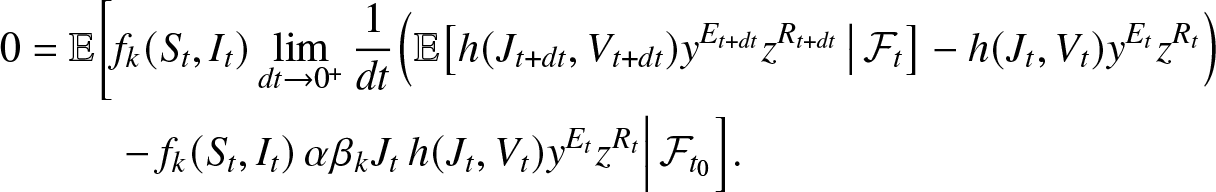 \begin{align}
0 &=\mathbb{E}\bigg[f_k(S_t, I_t)\lim_{dt\to 0^+} \frac{1}{dt} \Big(\mathbb{E}\big[h(J_{t+dt}, V_{t+dt}) y^{E_{t+dt}} z^{R_{t+dt}} \,\big|\, \mathcal{F}_t \big] - h(J_{t}, V_{t}) y^{E_t} z^{R_t}\Big) \nonumber\\
&\qquad~-f_k(S_t, I_t) \, \alpha \beta_k J_t\, h(J_{t}, V_{t}) y^{E_{t}} z^{R_{t}}\Big| \, \mathcal{F}_{t_0} \Big].
\end{align}
\begin{align}
0 &=\mathbb{E}\bigg[f_k(S_t, I_t)\lim_{dt\to 0^+} \frac{1}{dt} \Big(\mathbb{E}\big[h(J_{t+dt}, V_{t+dt}) y^{E_{t+dt}} z^{R_{t+dt}} \,\big|\, \mathcal{F}_t \big] - h(J_{t}, V_{t}) y^{E_t} z^{R_t}\Big) \nonumber\\
&\qquad~-f_k(S_t, I_t) \, \alpha \beta_k J_t\, h(J_{t}, V_{t}) y^{E_{t}} z^{R_{t}}\Big| \, \mathcal{F}_{t_0} \Big].
\end{align} After division by  $y^{E_t} z^{R_t}$, we see that a sufficient condition to have (2.13) is that for all $j,v$,
 \begin{equation}
\lim_{dt\to 0^+} \frac{1}{dt} \Big(\mathbb{E}\big[ h(J_{dt}, V_{dt}) y^{E_{dt}} z^{R_{dt}} \,\big|\, (J_0,V_0)=(\,j,v)\big] - h(\,j,v)\Big)
= \alpha \beta_k\, j h(\,j,v).
\end{equation}
\begin{equation}
\lim_{dt\to 0^+} \frac{1}{dt} \Big(\mathbb{E}\big[ h(J_{dt}, V_{dt}) y^{E_{dt}} z^{R_{dt}} \,\big|\, (J_0,V_0)=(\,j,v)\big] - h(\,j,v)\Big)
= \alpha \beta_k\, j h(\,j,v).
\end{equation} Thus, it remains to show that  $g_{k,y,z}(\,j,v)$ defined by (2.2) is indeed a solution of equation (2.14). Conditioning on whether or not there is infection of a susceptible during $(0,dt)$, we express this expectation as:
 \begin{align*}
g_{k,y,z}(\,j,v) = \mathbb{E}\left[ y^{E_T} z^{R_T} \, \mathbb{1}_{\{T \lt \infty,\, C_k\}} \,\big|\, (S_0,I_0)=(k,0), (J_0, V_0)=(\,j,v), C_k(dt) \right] (1-\alpha\beta_k\, j dt),
\end{align*}
\begin{align*}
g_{k,y,z}(\,j,v) = \mathbb{E}\left[ y^{E_T} z^{R_T} \, \mathbb{1}_{\{T \lt \infty,\, C_k\}} \,\big|\, (S_0,I_0)=(k,0), (J_0, V_0)=(\,j,v), C_k(dt) \right] (1-\alpha\beta_k\, j dt),
\end{align*} where  $C_k(dt)$ is the event that the k initial susceptibles escape the infection during $(0,dt)$. By the Markov property, we can rewrite this identity as:
 \begin{align}
g_{k,y,z}(\,j,v) = \mathbb{E}\left[ g_{k,y,z}(J_{dt},V_{dt}) y^{E_{dt}} z^{R_{dt}} \,\big|\, (S_0,I_0)=(k,0), (J_0, V_0)=(\,j,v), C_k(dt) \right] (1-\alpha \beta_k\, j dt).
\end{align}
\begin{align}
g_{k,y,z}(\,j,v) = \mathbb{E}\left[ g_{k,y,z}(J_{dt},V_{dt}) y^{E_{dt}} z^{R_{dt}} \,\big|\, (S_0,I_0)=(k,0), (J_0, V_0)=(\,j,v), C_k(dt) \right] (1-\alpha \beta_k\, j dt).
\end{align} Taking the limit  $dt \to 0^+$, we obtain from (2.15) the desired equation (2.14).
Note that the coefficients q(k) in (2.4) have a simple probabilistic interpretation: q(k) represents the probability that an internal infective in presence of a fixed group of k susceptibles will not infect any of them during its infectious period. A probabilistic interpretation of the coefficients  $\pi_k(s)$ in (2.5) is also possible but more involved; it is not included for simplicity.
Now, we will exploit the family of martingales (2.3) to determine the final state distribution of the epidemic model. For this purpose, we will distinguish the cases where T is almost surely finite or not. Recall that extinction is almost sure if and only if the external epidemic  $\{(J_t,V_t), t\geq 0\}$ effectively dies out. In the notation (2.2), this means that,
 \begin{equation*}
T \lt \infty ~ \text{a.s.} ~~ \Leftrightarrow ~~ g_{0,1,1}(m_J,m_V) = 1.
\end{equation*}
\begin{equation*}
T \lt \infty ~ \text{a.s.} ~~ \Leftrightarrow ~~ g_{0,1,1}(m_J,m_V) = 1.
\end{equation*}2.2. When extinction of infection is almost sure
If the external epidemic ends almost surely in finite time,  $I_T=J_T=V_T=0$ and the distribution of the final epidemic state $(S_T, E_T, R_T)$ is provided by the relations (2.16) below:
Proposition 2.2. When  $T \lt \infty$ almost surely, then for any $y,z \in (0,1]$,
 \begin{equation}
\mathbb{E}\left[ \pi_k(S_T) \, q(k)^{S_T} \, y^{E_T} \, z^{R_T} \right] = \pi_k(n)\, q(k)^{n+m}\, g_{k,y,z}(m_J,m_V), \quad k\in \{0,\ldots,n\}.
\end{equation}
\begin{equation}
\mathbb{E}\left[ \pi_k(S_T) \, q(k)^{S_T} \, y^{E_T} \, z^{R_T} \right] = \pi_k(n)\, q(k)^{n+m}\, g_{k,y,z}(m_J,m_V), \quad k\in \{0,\ldots,n\}.
\end{equation}Proof. Fix  $k\in \{0,\ldots,n\}$ and let $y,z \in (0,1]$. The parameter q(k) and the function $g_{k,y,z}(\cdot,\cdot)$ being lesser than 1, the martingale $\{M_k(t), t\geq 0\}$ obtained in (2.3) is bounded in expectation by $\mathbb{E}\left[ \pi_k(n) \right] \lt \infty$ and thus is uniformly integrable. Moreover, T is, for this martingale, a stopping time which is almost surely finite by hypothesis. Therefore, we can apply the optional stopping theorem, and this directly gives the result (2.16) using $g_{k,y,z}(0,0) = 1$.
A lot of information follows from (2.16). Let  $\mathbb{1}_{\{.\}}$ be the indicator variable of the event $\{.\}$. So, denoting,
 \begin{equation*}
x_s(y,z) = \mathbb{E}\big(y^{E_T} z^{R_T} \,\mathbb{1}_{\{S_T=s\}}\big), \quad 0\leq s \leq n,
\end{equation*}
\begin{equation*}
x_s(y,z) = \mathbb{E}\big(y^{E_T} z^{R_T} \,\mathbb{1}_{\{S_T=s\}}\big), \quad 0\leq s \leq n,
\end{equation*}we write (2.16) in explicit form as:
 \begin{equation}
\sum_{s=k}^{n} \pi_k(s) \, q(k)^{s} \, x_s(y,z) = \pi_k(n) \, q(k)^{n+m} \, g_{k,y,z}(m_J,m_V),
\quad k\in \{0,\ldots,n\}.
\end{equation}
\begin{equation}
\sum_{s=k}^{n} \pi_k(s) \, q(k)^{s} \, x_s(y,z) = \pi_k(n) \, q(k)^{n+m} \, g_{k,y,z}(m_J,m_V),
\quad k\in \{0,\ldots,n\}.
\end{equation} This constitutes a triangular system of n + 1 linear equations for the n + 1 unknown expectations  $x_s(y,z), 0\leq s \leq n$. In particular, the probabilities of escaping infection in the local structure, $\mathbb{P}\left( S_T=s \right)$, are obtained by solving this system when $y=z=1$. The probabilities $\mathbb{P}\left( S_T=s,E_T=u,R_T=r \right)$ can also be derived by differentiating (2.17) u (resp. r) times with respect to y (resp. z), then taking $y,z \to 0^+$.
The probability generating function of  $(E_T,R_T)$ is given by (2.17) after setting k = 0, hence
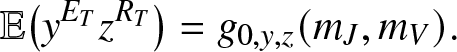 \begin{equation}
\mathbb{E}\big(y^{E_T}z^{R_T}\big) = g_{0,y,z}(m_J,m_V).
\end{equation}
\begin{equation}
\mathbb{E}\big(y^{E_T}z^{R_T}\big) = g_{0,y,z}(m_J,m_V).
\end{equation} Differentiating (2.18) k (resp. l) times with respect to y (resp. z), then taking  $y,z \to 0^+$ yields the joint probabilities $\mathbb{P}\left( E_T = k, R_T=l \right)$. Similarly, differentiating (2.18) and taking $y=z=1$ yields the joint moments of $(E_T, R_T)$.
The joint moments of  $(S_T,R_T)$ can also be found. Denoting
 \begin{equation*}
v_s = \mathbb{E}\big(R_T \,\mathbb{1}_{\{S_T=s\}}\big), \quad 0\leq s \leq n,
\end{equation*}
\begin{equation*}
v_s = \mathbb{E}\big(R_T \,\mathbb{1}_{\{S_T=s\}}\big), \quad 0\leq s \leq n,
\end{equation*} we differentiate (2.16) with respect to z and take  $y=z=1$, hence the linear equations:
 \begin{equation*}
\sum_{s=k}^{n} \pi_k(s) \, q(k)^{s} \, v_s = \pi_k(n) \, q(k)^{n+m} \, \Big[\frac{d}{dz}g_{k,y,z}(m_J,m_V)\Big]_{y=z=1}, \quad k\in \{0,\ldots,n\}.
\end{equation*}
\begin{equation*}
\sum_{s=k}^{n} \pi_k(s) \, q(k)^{s} \, v_s = \pi_k(n) \, q(k)^{n+m} \, \Big[\frac{d}{dz}g_{k,y,z}(m_J,m_V)\Big]_{y=z=1}, \quad k\in \{0,\ldots,n\}.
\end{equation*} After solving this system, we can calculate  $\mathbb{E}(S_T R_T) = \sum_{s=1}^n s v_s$. Combined with previous results, this gives the covariance between ST and RT. Of course, the joint moments of $(S_T,E_T)$ are obtained in a similar way.
2.3. When extinction of infection is not almost sure
This time, there is a strictly positive probability that the external epidemic never dies out. Since T is not almost surely finite, we can no longer apply the optional stopping theorem. Instead, we use a well-known convergence theorem for martingales to show that the result (2.16) still holds true in cases where T is finite.
Proposition 2.3. When  $T=\infty$ is possible, then for any $y,z \in (0,1]$,
 \begin{align}
\mathbb{E}\left[ \pi_k(S_T)\, q(k)^{S_T} \, y^{E_T} \, z^{R_T} \, \mathbb{1}_{\{T \lt \infty\}} \right]
= \pi_k(n) \, q(k)^{n+m} \, g_{k,y,z}(m_J,m_V),\quad k\in \{0,\ldots,n\}.
\end{align}
\begin{align}
\mathbb{E}\left[ \pi_k(S_T)\, q(k)^{S_T} \, y^{E_T} \, z^{R_T} \, \mathbb{1}_{\{T \lt \infty\}} \right]
= \pi_k(n) \, q(k)^{n+m} \, g_{k,y,z}(m_J,m_V),\quad k\in \{0,\ldots,n\}.
\end{align}Proof. Fix again  $k\in \{0, \ldots,n\}$ and let $y,z \in (0,1]$. As indicated before, the martingale $\{M_k(t), t\geq 0\}$ in (2.3) is uniformly integrable. So, we can apply Doob’s second martingale convergence theorem, namely that there exists a random variable $M_k(\infty)$ such that $M_k(t)$ converges to $M_k(\infty)$ both almost surely and in L 1. Moreover, $\mathbb{E}[M_k(\infty)|\mathcal{F}_t]=M_k(t)$ for all $t\geq 0$, which implies that $\mathbb{E}[M_k(\infty)]=M_k(0)$. In the present case, this last identity becomes explicitly:
 \begin{align}
\mathbb{E}\left[ \pi_k(S_{\infty}) \, q(k)^{S_{\infty}+I_{\infty}} \, g_{k,y,z}(J_{\infty},V_{\infty}) \, y^{E_{\infty}} z^{R_{\infty}} \right]
= \pi_k(n) \, q(k)^{n+m} \,g_{k,y,z}(m_J,m_V).
\end{align}
\begin{align}
\mathbb{E}\left[ \pi_k(S_{\infty}) \, q(k)^{S_{\infty}+I_{\infty}} \, g_{k,y,z}(J_{\infty},V_{\infty}) \, y^{E_{\infty}} z^{R_{\infty}} \right]
= \pi_k(n) \, q(k)^{n+m} \,g_{k,y,z}(m_J,m_V).
\end{align} Let us decompose the left expectation of (2.20) into a sum of two identical terms but including an additional indicator to specify that T is finite or infinite. When  $T \lt \infty$, it is clear that $I_{\infty} = J_{\infty} = V_{\infty} = 0$ and $(S_{\infty},E_{\infty},R_{\infty})=(S_T,E_T,R_T)$, so that
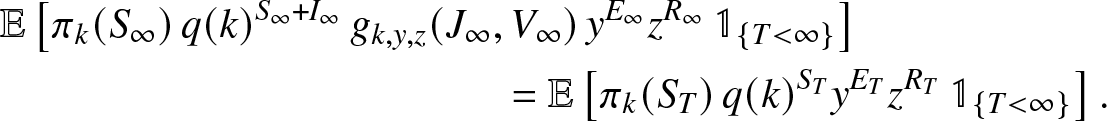 \begin{align}
&\mathbb{E}\left[ \pi_k(S_{\infty}) \,q(k)^{S_{\infty}+I_{\infty}} \, g_{k,y,z}(J_{\infty},V_{\infty}) \, y^{E_{\infty}} z^{R_{\infty}} \, \mathbb{1}_{\{T \lt \infty\}} \right]\nonumber\\
& \qquad\qquad\qquad\qquad\qquad\qquad = \mathbb{E}\left[ \pi_k(S_T)\, q(k)^{S_T} y^{E_T} z^{R_T} \, \mathbb{1}_{\{T \lt \infty\}} \right].
\end{align}
\begin{align}
&\mathbb{E}\left[ \pi_k(S_{\infty}) \,q(k)^{S_{\infty}+I_{\infty}} \, g_{k,y,z}(J_{\infty},V_{\infty}) \, y^{E_{\infty}} z^{R_{\infty}} \, \mathbb{1}_{\{T \lt \infty\}} \right]\nonumber\\
& \qquad\qquad\qquad\qquad\qquad\qquad = \mathbb{E}\left[ \pi_k(S_T)\, q(k)^{S_T} y^{E_T} z^{R_T} \, \mathbb{1}_{\{T \lt \infty\}} \right].
\end{align} When  $T=\infty$, the infected external population ends up exploding. As Vt and $J_t \to \infty$, we have $y^{E_t}$ and $z^{R_t} \to 0$ (for $y,z \neq 1$). Now, q(k) and $g_{k,y,z}(\cdot,\cdot)$ are $\leq 1$, and therefore the variable $M_k(\infty)$ is almost surely equal to 0. By the L 1 convergence, we then get,
 \begin{align}
\mathbb{E}\left[ \pi_k(S_{\infty}) \, q(k)^{S_{\infty}+I_{\infty}} \, g_{k,y,z}(J_{\infty},V_{\infty}) \, y^{E_{\infty}} z^{R_{\infty}} \, \mathbb{1}_{\{T=\infty\}} \right] = 0.
\end{align}
\begin{align}
\mathbb{E}\left[ \pi_k(S_{\infty}) \, q(k)^{S_{\infty}+I_{\infty}} \, g_{k,y,z}(J_{\infty},V_{\infty}) \, y^{E_{\infty}} z^{R_{\infty}} \, \mathbb{1}_{\{T=\infty\}} \right] = 0.
\end{align}Inserting (2.21) and (2.22) in (2.20), we deduce the formula (2.19).
The system of n + 1 relations (2.19) can be exploited exactly as was done with (2.16) when the infection almost surely dies out. For example, the joint distribution of  $(S_T,E_T,R_T)$ is obtained in the same way as before by first determining the expectations:
 \begin{equation*}
x_s(y,z)=\mathbb{E}\big(y^{E_T}z^{R_T}\mathbb{1}_{\{T \lt \infty, S_T=s\}}\big), \quad 0\leq s \leq n,
\end{equation*}
\begin{equation*}
x_s(y,z)=\mathbb{E}\big(y^{E_T}z^{R_T}\mathbb{1}_{\{T \lt \infty, S_T=s\}}\big), \quad 0\leq s \leq n,
\end{equation*}from the triangular system (2.19).
3. Back to the basic epidemic process
In this section, we continue the analysis when the external infection process is described by a linear branching model. The rates of the basic epidemic model are then given by (2.1) and shown in Figure 1.
3.1. The reproduction number  $\mathcal{R}_0$

To begin, we will rewrite, in a more standard form, the condition guaranteeing that the end of the epidemic T is almost surely finite.
Proposition 3.1. T is almost surely finite if and only if  $\mathcal{R}_0 \le 1$ where
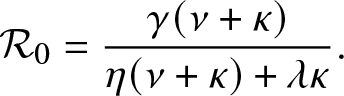 \begin{equation}
\mathcal{R}_0 = \frac{\gamma (\nu + \kappa)}{\eta(\nu + \kappa) + \lambda \kappa}.
\end{equation}
\begin{equation}
\mathcal{R}_0 = \frac{\gamma (\nu + \kappa)}{\eta(\nu + \kappa) + \lambda \kappa}.
\end{equation}Proof. As stated before, T is almost surely finite if and only if the external process  $\{(J_t,V_t), t\geq 0\}$ dies out almost surely in a finite time. This process is a Markovian branching model in which individuals (all of whom are infectious) can alternate between two states during their lifetime, namely inside or outside the local population. Moreover, any new infective necessarily begins its life outside and cannot give rise to external infectives while it is in the local population. For such a process, it is well-established that the infection terminates almost surely in a finite time if and only if $\mathcal{R}_0 \equiv \mathbb{E}(\mathcal{N}) \leq 1$, where $\mathcal{N}$ is the total number of external infectives generated by an individual who starts inside the large population.
Now, following a simple probabilistic reasoning, we see that
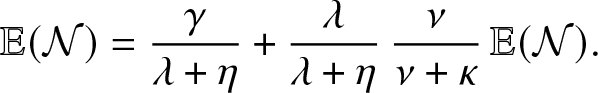 \begin{equation*}
\mathbb{E}(\mathcal{N}) = \frac{\gamma}{\lambda + \eta} + \frac{\lambda}{\lambda + \eta} \, \frac{\nu}{\nu + \kappa} \, \mathbb{E}(\mathcal{N}).
\end{equation*}
\begin{equation*}
\mathbb{E}(\mathcal{N}) = \frac{\gamma}{\lambda + \eta} + \frac{\lambda}{\lambda + \eta} \, \frac{\nu}{\nu + \kappa} \, \mathbb{E}(\mathcal{N}).
\end{equation*} The formula (3.1) for  $\mathcal{R}_0$ then follows.
In the epidemic literature, the coefficient  $\mathcal{R}_0$ is referred to as the reproduction number (or threshold parameter) of the model. Note that from (3.1), $\mathcal{R}_0$ can be expressed as:
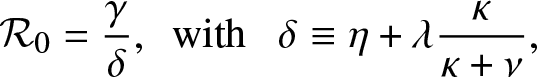 \begin{equation*}
\mathcal{R}_0 = \frac{\gamma}{\delta},\,\,\, \mbox{with } \,\,\, \delta \equiv \eta + \lambda \frac{\kappa}{\kappa + \nu},
\end{equation*}
\begin{equation*}
\mathcal{R}_0 = \frac{\gamma}{\delta},\,\,\, \mbox{with } \,\,\, \delta \equiv \eta + \lambda \frac{\kappa}{\kappa + \nu},
\end{equation*}which is an intuitive result since γ is the infection rate of an external infective while δ is its overall removal rate when time spent inside the local population is not taken into account.
Alternatively, we can rewrite  $\mathcal{R}_0$ as:
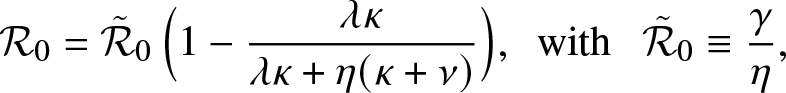 \begin{equation*}
\mathcal{R}_0 = \tilde{\mathcal{R}}_0 \, \Big(1 - \frac{\lambda \kappa}{\lambda \kappa + \eta (\kappa + \nu)}\Big),\,\,\, \mbox{with } \,\,\, \tilde{\mathcal{R}}_0 \equiv \frac{\gamma}{\eta},
\end{equation*}
\begin{equation*}
\mathcal{R}_0 = \tilde{\mathcal{R}}_0 \, \Big(1 - \frac{\lambda \kappa}{\lambda \kappa + \eta (\kappa + \nu)}\Big),\,\,\, \mbox{with } \,\,\, \tilde{\mathcal{R}}_0 \equiv \frac{\gamma}{\eta},
\end{equation*} where  $\tilde{\mathcal{R}}_0$ is the threshold parameter for a linear birth-and-death process with birth rate γ and death rate η. This formula points out how the external epidemic is affected by the local structure: without it, the mean number of infections per infective would be $\tilde{\mathcal{R}}_0$, whereas with it, this mean number is reduced to the value $\mathcal{R}_0$.
3.2. Applying the general method
We wish to particularize some of the results obtained in Section 2 to the epidemic model (2.1). Let us first return to the function  $g_{k,y,z}(\,j,v)$ introduced in (2.2). As the external branching process is linear, the infectives of the two types have independent infection behaviors. Consequently, $g_{k,y,z}(\,j,v)$ is the product of two functions with respective powers j and v. In other words, it is of the form:
 \begin{equation}
g_{k,y,z}(\,j,v) = \left(p_{k,y,z}\right)^j \left(\rho_{k,y,z}\right)^v, \quad j,v\in \mathbb{N}_0,
\end{equation}
\begin{equation}
g_{k,y,z}(\,j,v) = \left(p_{k,y,z}\right)^j \left(\rho_{k,y,z}\right)^v, \quad j,v\in \mathbb{N}_0,
\end{equation} where  $p_{k,y,z}$ (resp. $\rho_{k,y,z}$) denotes the expectation (2.2) when $(J_0, V_0)=(1,0)$ (resp. $(0,1)$). The expression of these expectations is derived below.
Proposition 3.2. In the formula (3.2) of  $g_{k,y,z}(\,j,v), the expectation
  p_{k,y,z}$ is given by:
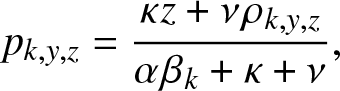 \begin{equation}
p_{k,y,z} = \frac{\kappa z + \nu \rho_{k,y,z}}{\alpha \beta_k + \kappa + \nu},
\end{equation}
\begin{equation}
p_{k,y,z} = \frac{\kappa z + \nu \rho_{k,y,z}}{\alpha \beta_k + \kappa + \nu},
\end{equation} and  $\rho_{k,y,z}$ is the smallest root of the quadratic equation in x:
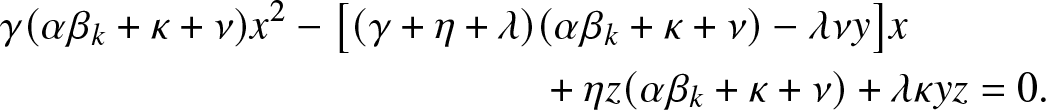 \begin{align}
&\gamma (\alpha \beta_k +\kappa + \nu) x^2 - \big[(\gamma +\eta + \lambda)(\alpha \beta_k +\kappa + \nu) -\lambda \nu y\big] x \nonumber\\
& \qquad\qquad\qquad\qquad\qquad\qquad\quad + \eta z (\alpha \beta_k +\kappa + \nu) + \lambda \kappa yz = 0.
\end{align}
\begin{align}
&\gamma (\alpha \beta_k +\kappa + \nu) x^2 - \big[(\gamma +\eta + \lambda)(\alpha \beta_k +\kappa + \nu) -\lambda \nu y\big] x \nonumber\\
& \qquad\qquad\qquad\qquad\qquad\qquad\quad + \eta z (\alpha \beta_k +\kappa + \nu) + \lambda \kappa yz = 0.
\end{align}Proof. Consider  $g_{k,y,z}(\,j,v)$ defined in (2.2). By conditioning on the first admissible event in the process $\{(S_t,I_t,J_t,V_t), t \ge 0\}$, we easily obtain that:
 \begin{align}
& (\alpha \beta_k\, j +\nu j + \kappa j + \gamma v +\eta v + \lambda v) g_{k,y,z}(\,j,v)
= \nu j g_{k,y,z}(\,j-1,v+1) + \kappa j z g_{k,y,z}(\,j-1,v) \nonumber\\
& \qquad\qquad\qquad\qquad + \gamma v g_{k,y,z}(\,j,v+1) + \eta v z g_{k,y,z}(\,j,v-1) + \lambda v y g_{k,y,z}(\,j+1, v-1),
\end{align}
\begin{align}
& (\alpha \beta_k\, j +\nu j + \kappa j + \gamma v +\eta v + \lambda v) g_{k,y,z}(\,j,v)
= \nu j g_{k,y,z}(\,j-1,v+1) + \kappa j z g_{k,y,z}(\,j-1,v) \nonumber\\
& \qquad\qquad\qquad\qquad + \gamma v g_{k,y,z}(\,j,v+1) + \eta v z g_{k,y,z}(\,j,v-1) + \lambda v y g_{k,y,z}(\,j+1, v-1),
\end{align} with the boundary condition  $g_{k,y,z}(0,0)=1$.
Now, identify the terms in j and v on both sides of (3.6). This gives the following two relations:
 \begin{align}
&(\alpha \beta_k +\kappa + \nu) g_{k,y,z}(\,j,v) = \kappa z g_{k,y,z}(\,j-1,v) + \nu g_{k,y,z}(\,j-1,v+1), \nonumber\\
&(\gamma +\eta + \lambda) g_{k,y,z}(\,j,v) = \gamma g_{k,y,z}(\,j,v+1) + \eta z g_{k,y,z}(\,j,v-1) + \lambda y g_{k,y,z}(\,j+1,v-1).
\end{align}
\begin{align}
&(\alpha \beta_k +\kappa + \nu) g_{k,y,z}(\,j,v) = \kappa z g_{k,y,z}(\,j-1,v) + \nu g_{k,y,z}(\,j-1,v+1), \nonumber\\
&(\gamma +\eta + \lambda) g_{k,y,z}(\,j,v) = \gamma g_{k,y,z}(\,j,v+1) + \eta z g_{k,y,z}(\,j,v-1) + \lambda y g_{k,y,z}(\,j+1,v-1).
\end{align} Inserting (3.2) for  $g_{k,y,z}(\,j,v)$, the system (3.6) simplifies to:
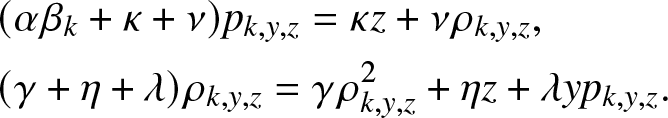 \begin{align}
&(\alpha \beta_k +\kappa + \nu)p_{k,y,z} = \kappa z + \nu \rho_{k,y,z}, \nonumber \\
&(\gamma +\eta + \lambda)\rho_{k,y,z} = \gamma \rho_{k,y,z}^2 + \eta z + \lambda y p_{k,y,z}.
\end{align}
\begin{align}
&(\alpha \beta_k +\kappa + \nu)p_{k,y,z} = \kappa z + \nu \rho_{k,y,z}, \nonumber \\
&(\gamma +\eta + \lambda)\rho_{k,y,z} = \gamma \rho_{k,y,z}^2 + \eta z + \lambda y p_{k,y,z}.
\end{align} The first identity of (3.7) provides precisely the formula (3.3) for  $p_{k,y,z}$. The substitution in the second identity of (3.7) leads to the quadratic equation (3.4) to be satisfied by $\rho_{k,y,z}$. We can verify that (3.4) has two positive roots located on either side of 1. Given its definition, $\rho_{k,y,z}$ thus corresponds to the smallest solution.
The analysis made in Section 2 is of application with  $g_{k,y,z}(\,j,v)$ given by (3.2)-(3.4). So, the formula (2.18) for example becomes:
 \begin{equation}
\mathbb{E}\big(y^{E_T}z^{R_T}\big) = \left(p_{0,y,z}\right)^{m_J} \left(\rho_{0,y,z}\right)^{m_V}.
\end{equation}
\begin{equation}
\mathbb{E}\big(y^{E_T}z^{R_T}\big) = \left(p_{0,y,z}\right)^{m_J} \left(\rho_{0,y,z}\right)^{m_V}.
\end{equation} When  $\mathcal{R}_0 \lt 1$, the first moments of $(E_T, R_T)$ are finite and their expressions obtained by differentiating (3.8) are given by:
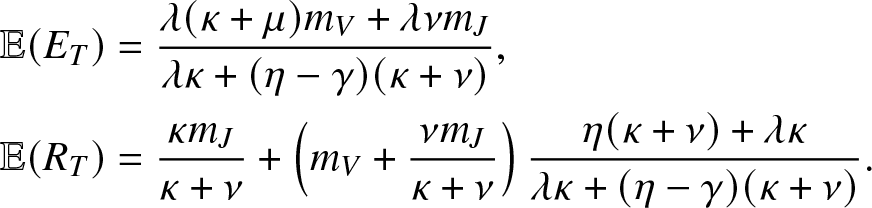 \begin{align}
& \mathbb{E}(E_T) = \frac{\lambda (\kappa + \mu)m_V +\lambda \nu m_J}{\lambda \kappa + (\eta-\gamma)(\kappa + \nu)}, \nonumber \\
& \mathbb{E}(R_T) = \frac{\kappa m_J }{\kappa + \nu} + \left(m_V+\frac{\nu m_J}{\kappa + \nu} \right)\frac{\eta (\kappa + \nu) + \lambda \kappa}{\lambda \kappa + (\eta-\gamma)(\kappa + \nu)}.
\end{align}
\begin{align}
& \mathbb{E}(E_T) = \frac{\lambda (\kappa + \mu)m_V +\lambda \nu m_J}{\lambda \kappa + (\eta-\gamma)(\kappa + \nu)}, \nonumber \\
& \mathbb{E}(R_T) = \frac{\kappa m_J }{\kappa + \nu} + \left(m_V+\frac{\nu m_J}{\kappa + \nu} \right)\frac{\eta (\kappa + \nu) + \lambda \kappa}{\lambda \kappa + (\eta-\gamma)(\kappa + \nu)}.
\end{align} Analogously, we have seen that when  $\mathcal{R}_0 \gt 1$, the extinction probability corresponds to $g_{0,1,1}(m_J,m_V)$. From there, it is easy to find that:
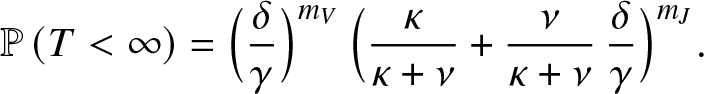 \begin{equation*}
\mathbb{P}\left( T \lt \infty \right) = \Big(\frac{\delta}{\gamma}\Big)^{m_V} \, \Big(\frac{\kappa}{\kappa+\nu}+ \frac{\nu}{\kappa+\nu} \,\frac{\delta}{\gamma}\Big)^{m_J}.
\end{equation*}
\begin{equation*}
\mathbb{P}\left( T \lt \infty \right) = \Big(\frac{\delta}{\gamma}\Big)^{m_V} \, \Big(\frac{\kappa}{\kappa+\nu}+ \frac{\nu}{\kappa+\nu} \,\frac{\delta}{\gamma}\Big)^{m_J}.
\end{equation*}3.3. An alternative method when ${\mathcal{R}}_0\leq 1$

Thanks to the linearity of the external branching, it is possible to obtain the distribution of ST by a more classic recursive method. To do this, the model is reformulated in an equivalent manner by considering that the susceptible population is only subject to one source of infection at a time.
More precisely, let  $\mathcal{R}_0 \leq 1$ and, for the moment, set ET, the total number of external entries in the local population, equal to u.
(i) First, we follow the infections made by the  $m_J + u$ external infectives inside the local population. This is the same as following the infections of a single infective with infectious period D distributed as an Erlang( $m_J+u,\kappa+\nu$) and whose infection rate is $\alpha \beta_s$ when s susceptibles are present. Let $p_{\ell}(m_J+u)$ be the probability that this individual infects $\ell$ susceptibles among the n initial ones.
(ii) Then, we follow the infections made by each internal infective taken one after the other. The infection rate here is βs for s susceptibles. Such a change in temporal scale is a trick often applied in the study of (collective) SIR epidemic models (see e.g. [Reference Lefèvre and Utev15]).
We want to determine  $\mathbb{E}[a(S_T)]$ where $a(\ldots)$ is any real function. Of course, this will provide us with the desired distribution of ST. To calculate this expectation, we will condition precisely on the event $(E_T=u)$. Let us define
 \begin{equation}
h(s,i) = \mathbb{E}\left[ a(S_T)\,|\, (S_0, I_0)=(s,i), (J_0,V_0)=(0,0) \right], \quad s,i \geq 0,
\end{equation}
\begin{equation}
h(s,i) = \mathbb{E}\left[ a(S_T)\,|\, (S_0, I_0)=(s,i), (J_0,V_0)=(0,0) \right], \quad s,i \geq 0,
\end{equation} which means that the epidemic considered here starts with s susceptibles and i infectives and there is no external infection. Obviously,  $h(s,0) = a(s)$ and $h(0,i) = a(0)$.
Proposition 3.3. For  $u\geq 0$,
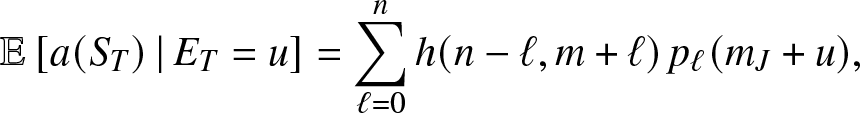 \begin{equation}
\mathbb{E}\left[ a(S_T) \,|\,E_T = u \right] = \sum_{\ell = 0}^n h(n-\ell, m+\ell) \, p_{\ell}(m_J+u),
\end{equation}
\begin{equation}
\mathbb{E}\left[ a(S_T) \,|\,E_T = u \right] = \sum_{\ell = 0}^n h(n-\ell, m+\ell) \, p_{\ell}(m_J+u),
\end{equation} where for  $s,i \gt 0$,
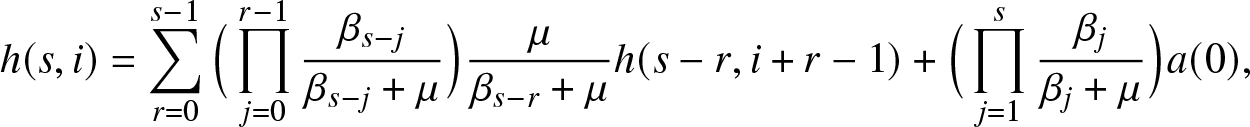 \begin{align}
h(s,i) = \sum_{r=0}^{s-1} \Big(\prod_{j=0}^{r-1} \frac{\beta_{s-j}}{\beta_{s-j} + \mu} \Big) \frac{\mu}{\beta_{s-r} + \mu}h(s-r,i+r-1) + \Big(\prod_{j=1}^{s} \frac{\beta_j}{\beta_j + \mu} \Big) a(0),
\end{align}
\begin{align}
h(s,i) = \sum_{r=0}^{s-1} \Big(\prod_{j=0}^{r-1} \frac{\beta_{s-j}}{\beta_{s-j} + \mu} \Big) \frac{\mu}{\beta_{s-r} + \mu}h(s-r,i+r-1) + \Big(\prod_{j=1}^{s} \frac{\beta_j}{\beta_j + \mu} \Big) a(0),
\end{align} and for  $0\leq \ell \leq n$,
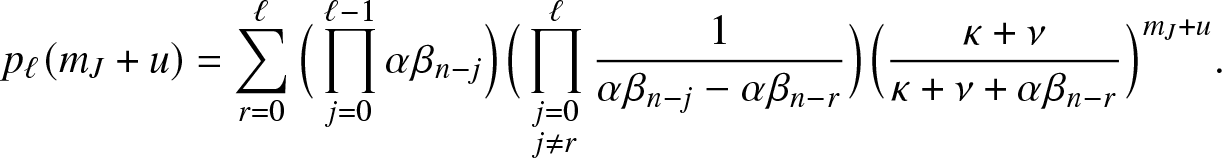 \begin{align}
p_{\ell}(m_J+u) = \sum_{r=0}^{\ell} \Big(\prod_{j=0}^{\ell-1} \alpha \beta_{n-j}\Big) \Big(\prod_{\substack{j=0 \\ j\neq r}}^{\ell}\frac{1}{\alpha \beta_{n-j}-\alpha \beta_{n-r}}\Big) \Big(\frac{\kappa+\nu}{\kappa+\nu+\alpha \beta_{n-r}}\Big)^{m_J+u}.
\end{align}
\begin{align}
p_{\ell}(m_J+u) = \sum_{r=0}^{\ell} \Big(\prod_{j=0}^{\ell-1} \alpha \beta_{n-j}\Big) \Big(\prod_{\substack{j=0 \\ j\neq r}}^{\ell}\frac{1}{\alpha \beta_{n-j}-\alpha \beta_{n-r}}\Big) \Big(\frac{\kappa+\nu}{\kappa+\nu+\alpha \beta_{n-r}}\Big)^{m_J+u}.
\end{align}Proof. The formula (3.11) is immediate from the definition (3.10) and by considering the number  $\ell$ of infections due to $m_J+u$ external visits. The formula (3.12) follows by conditioning on the number of infections made by the first infective activated in a collective epidemic.
There are different ways to evaluate the probabilities  $p_{\ell}(m_J+u)$. A simple method is to work with the density $f_\ell(\cdot)$ of a hypoexponential distribution of parameters $(\alpha\beta_n, \alpha\beta_{n-1}, \ldots, \alpha\beta_{n -\ell+1})$. Reasoning as in Proposition 2.1 of [Reference Lefèvre and Simon14], we then have,
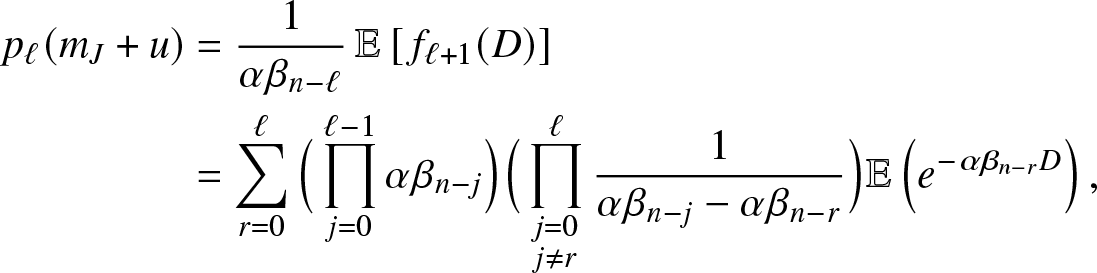 \begin{align*}
p_{\ell}(m_J+u) &= \frac{1}{\alpha \beta_{n-\ell}}\, \mathbb{E}\left[\, f_{\ell+1}(D) \right]\\
&= \sum_{r=0}^{\ell} \Big(\prod_{j=0}^{\ell-1} \alpha \beta_{n-j}\Big) \Big(\prod_{\substack{j=0 \\ j\neq r}}^{\ell}\frac{1}{\alpha \beta_{n-j}-\alpha \beta_{n-r}}\Big) \mathbb{E}\left(e^{-\alpha \beta_{n-r}D}\right),
\end{align*}
\begin{align*}
p_{\ell}(m_J+u) &= \frac{1}{\alpha \beta_{n-\ell}}\, \mathbb{E}\left[\, f_{\ell+1}(D) \right]\\
&= \sum_{r=0}^{\ell} \Big(\prod_{j=0}^{\ell-1} \alpha \beta_{n-j}\Big) \Big(\prod_{\substack{j=0 \\ j\neq r}}^{\ell}\frac{1}{\alpha \beta_{n-j}-\alpha \beta_{n-r}}\Big) \mathbb{E}\left(e^{-\alpha \beta_{n-r}D}\right),
\end{align*}which gives (3.13) since D has an Erlang distribution.
In the special case where  $\alpha \beta_s$ is of the affine form $b s$, then $p_{\ell}(m_J+u)=\mathbb{P}\left( Z=\ell \right)$ where the random variable Z has a mixed binomial distribution with exponent n and randomized success probability $1- \exp(-b D)$. Note that, of course, $\mathbb{E}[a(S_T)|R_T = r]$ could be determined in the same way.
Now, from (3.11), we directly obtain:
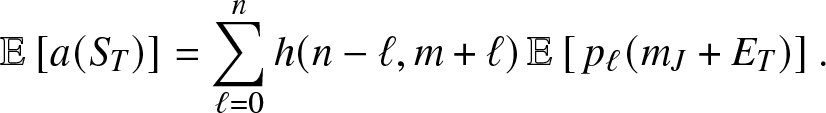 \begin{equation}
\mathbb{E}\left[ a(S_T) \right] = \sum_{\ell=0}^n h(n-\ell, m+\ell)\, \mathbb{E}\left[\, p_{\ell}(m_J+E_T) \right].
\end{equation}
\begin{equation}
\mathbb{E}\left[ a(S_T) \right] = \sum_{\ell=0}^n h(n-\ell, m+\ell)\, \mathbb{E}\left[\, p_{\ell}(m_J+E_T) \right].
\end{equation} Moreover, we get from (3.13), after denoting  $q_r=(\kappa+\nu)/(\kappa+\nu+\alpha \beta_{n-r})$,
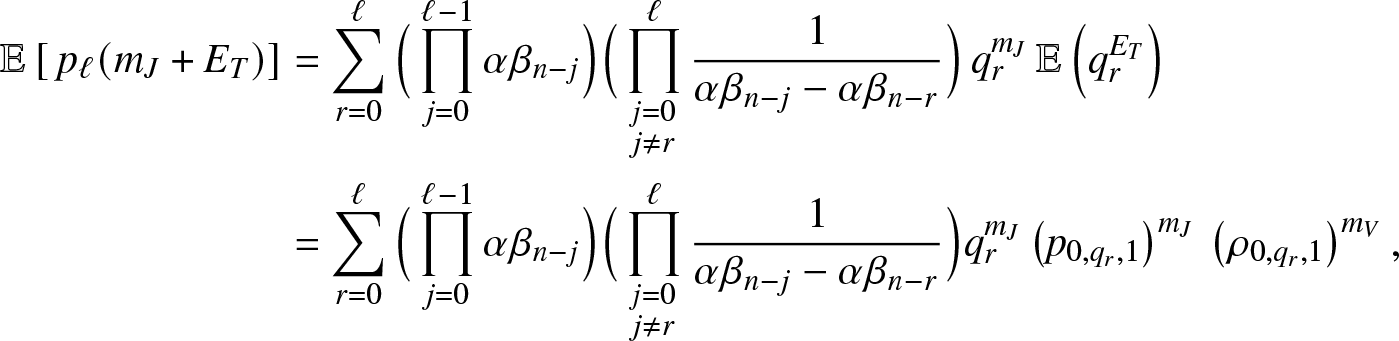 \begin{align}
\mathbb{E}\left[\, p_{\ell}(m_J+E_T) \right] &= \sum_{r=0}^{\ell} \Big(\prod_{j=0}^{\ell-1} \alpha \beta_{n-j}\Big) \Big(\prod_{\substack{j=0 \\ j\neq r}}^{\ell}\frac{1}{\alpha \beta_{n-j}-\alpha \beta_{n-r}}\Big) \, q_r^{m_J} \, \mathbb{E}\left(q_r^{E_T}\right) \nonumber\\
&= \sum_{r=0}^{\ell} \Big(\prod_{j=0}^{\ell-1} \alpha \beta_{n-j}\Big) \Big(\prod_{\substack{j=0 \\ j\neq r}}^{\ell}\frac{1}{\alpha \beta_{n-j}-\alpha \beta_{n-r}}\Big) q_r^{m_J} \left(p_{0,q_r,1}\right)^{m_J} \, \left(\rho_{0,q_r,1}\right)^{m_V},
\end{align}
\begin{align}
\mathbb{E}\left[\, p_{\ell}(m_J+E_T) \right] &= \sum_{r=0}^{\ell} \Big(\prod_{j=0}^{\ell-1} \alpha \beta_{n-j}\Big) \Big(\prod_{\substack{j=0 \\ j\neq r}}^{\ell}\frac{1}{\alpha \beta_{n-j}-\alpha \beta_{n-r}}\Big) \, q_r^{m_J} \, \mathbb{E}\left(q_r^{E_T}\right) \nonumber\\
&= \sum_{r=0}^{\ell} \Big(\prod_{j=0}^{\ell-1} \alpha \beta_{n-j}\Big) \Big(\prod_{\substack{j=0 \\ j\neq r}}^{\ell}\frac{1}{\alpha \beta_{n-j}-\alpha \beta_{n-r}}\Big) q_r^{m_J} \left(p_{0,q_r,1}\right)^{m_J} \, \left(\rho_{0,q_r,1}\right)^{m_V},
\end{align}for which we used the formula (3.8). Inserting (3.15) into (3.14) gives the desired result.
4. Two variants of the basic epidemic
Let us return to the basic epidemic process of Section 3. We will discuss two variants of this model for which the entry of external infectives into the local population is partially restricted: either an external infective can only access a small number of times, or the reception capacity of the local population is limited, with direct or random access.
4.1. With a limited number of accesses
Suppose that each external infective can only enter the local population once. Before its first visit, this infective propagates the infection at the rate γ 0 and is removed at the rate η 0. After one visit, the infective if returned to the large population can no longer enter the local population, and its infection and removal rates become γ 1 and η 1. Obviously, the model could be more general and allow for several possible visits.
This time, Vt is a bivariate vector  $(V_t^{(0)}, V_t^{(1)})$ where $V_t^{(0)} $ is the number of external infectives who have never entered the local population until time t, and $V_t^{(1)}$ those who have visited the local population once. The instantaneous transitions of the epidemic $\{(S_t,I_t,J_t,V_t^{(0)}, V_t^{(1)}), t \ge 0\}$ are thus
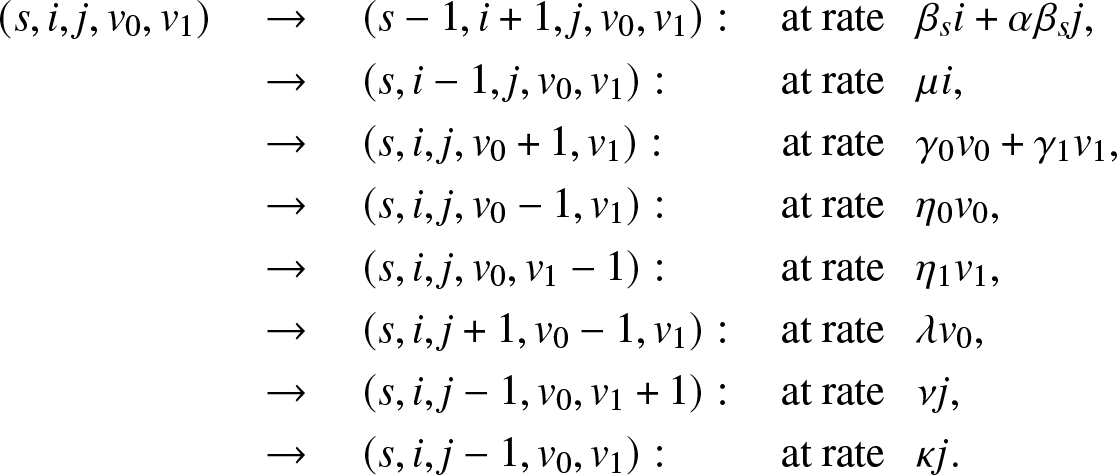 \begin{align}
(s,i,j,v_0,v_1) \quad & \rightarrow \quad (s-1,i+1,j,v_0,v_1): \quad \text{at rate}\,\,\,\ \beta_s i+\alpha \beta_s j, \nonumber\\
& \rightarrow \quad (s,i-1,j,v_0,v_1) : \quad\quad\ \ \text{at rate}\,\,\,\ \mu i,\nonumber\\
& \rightarrow \quad (s,i,j,v_0+1,v_1) : \!\ \quad\quad\ \ \text{at rate}\,\,\,\ \gamma_0 v_0 + \gamma_1 v_1,\nonumber\\
& \rightarrow \quad (s,i,j,v_0-1,v_1) : \quad\quad\ \ \text{at rate}\,\,\,\ \eta_0 v_0,\nonumber\\
& \rightarrow \quad (s,i,j,v_0,v_1-1) : \quad\quad\ \ \text{at rate}\,\,\,\ \eta_1 v_1,\nonumber\\
& \rightarrow \quad (s,i,j+1,v_0-1,v_1) : \quad \text{at rate}\,\,\,\ \lambda v_0,\nonumber\\
& \rightarrow \quad (s,i,j-1,v_0,v_1+1) : \quad \text{at rate}\,\,\,\ \nu j,\nonumber\\
& \rightarrow \quad (s,i,j-1,v_0,v_1) : \quad\quad\ \ \text{at rate}\,\,\,\ \kappa j.
\end{align}
\begin{align}
(s,i,j,v_0,v_1) \quad & \rightarrow \quad (s-1,i+1,j,v_0,v_1): \quad \text{at rate}\,\,\,\ \beta_s i+\alpha \beta_s j, \nonumber\\
& \rightarrow \quad (s,i-1,j,v_0,v_1) : \quad\quad\ \ \text{at rate}\,\,\,\ \mu i,\nonumber\\
& \rightarrow \quad (s,i,j,v_0+1,v_1) : \!\ \quad\quad\ \ \text{at rate}\,\,\,\ \gamma_0 v_0 + \gamma_1 v_1,\nonumber\\
& \rightarrow \quad (s,i,j,v_0-1,v_1) : \quad\quad\ \ \text{at rate}\,\,\,\ \eta_0 v_0,\nonumber\\
& \rightarrow \quad (s,i,j,v_0,v_1-1) : \quad\quad\ \ \text{at rate}\,\,\,\ \eta_1 v_1,\nonumber\\
& \rightarrow \quad (s,i,j+1,v_0-1,v_1) : \quad \text{at rate}\,\,\,\ \lambda v_0,\nonumber\\
& \rightarrow \quad (s,i,j-1,v_0,v_1+1) : \quad \text{at rate}\,\,\,\ \nu j,\nonumber\\
& \rightarrow \quad (s,i,j-1,v_0,v_1) : \quad\quad\ \ \text{at rate}\,\,\,\ \kappa j.
\end{align}Let us first derive a condition for T to be almost surely finite.
Proposition 4.1. T is almost surely finite if and only if  $\mathcal{R}_0 \le 1$ where
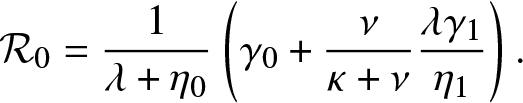 \begin{equation}
\mathcal{R}_0 = \frac{1}{\lambda + \eta_0} \left(\gamma_0 + \frac{\nu}{\kappa + \nu} \frac{\lambda \gamma_1}{\eta_1} \right).
\end{equation}
\begin{equation}
\mathcal{R}_0 = \frac{1}{\lambda + \eta_0} \left(\gamma_0 + \frac{\nu}{\kappa + \nu} \frac{\lambda \gamma_1}{\eta_1} \right).
\end{equation}Proof. As for Proposition 3.1, T is almost surely finite if and only if the process  $\{(J_t,V_t^{(0)}, V_t^{(1)}), t\geq 0\}$ dies out almost surely in a finite time. This happens if and only if $\mathcal{R}_0 \equiv \mathbb{E}(\mathcal{N}) \leq 1$, where $\mathcal{N}$ is the total number of external infectives generated by a given external infective during its whole lifetime.
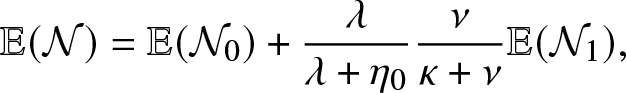
Now, we see here that
 \begin{equation}
\mathbb{E}(\mathcal{N})=\mathbb{E}(\mathcal{N}_0) + \frac{\lambda}{\lambda + \eta_0} \frac{\nu}{\kappa+\nu}\mathbb{E}(\mathcal{N}_1),
\end{equation}
\begin{equation}
\mathbb{E}(\mathcal{N})=\mathbb{E}(\mathcal{N}_0) + \frac{\lambda}{\lambda + \eta_0} \frac{\nu}{\kappa+\nu}\mathbb{E}(\mathcal{N}_1),
\end{equation} where  $\mathcal{N}_0$ is the number of external infections generated by an infective before visiting the local population and $\mathcal{N}_1$ is the number of external infections generated by an infective after having visited the local population. By a direct reasoning, we get
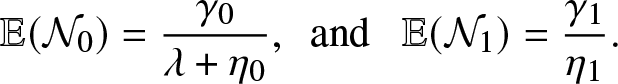 \begin{equation}
\mathbb{E}(\mathcal{N}_0)=\frac{\gamma_0}{\lambda + \eta_0}, \,\,\,\mbox{and } \,\,\,\mathbb{E}(\mathcal{N}_1) = \frac{\gamma_1}{\eta_1}.
\end{equation}
\begin{equation}
\mathbb{E}(\mathcal{N}_0)=\frac{\gamma_0}{\lambda + \eta_0}, \,\,\,\mbox{and } \,\,\,\mathbb{E}(\mathcal{N}_1) = \frac{\gamma_1}{\eta_1}.
\end{equation} Combining (4.3) and (4.4), we obtain the formula (4.2) for  $\mathcal{R}_0$.
Let us then define the expectation  $g_{k,y,z}(\,j,v_0,v_1)$ by directly adapting the definition (2.2). As the branching model is again linear, this function has a product form like (3.2), i.e.
 \begin{equation}
g_{k,y,z}(\,j,v_0,v_1) = \left(p_{k,y,z}\right)^{j} \, \left(\rho_{k,y,z}\right) ^{v_0}\, \left(\sigma_{k,y,z}\right)^{v_1},\quad j,v_0,v_1 \in \mathbb{N}_0,
\end{equation}
\begin{equation}
g_{k,y,z}(\,j,v_0,v_1) = \left(p_{k,y,z}\right)^{j} \, \left(\rho_{k,y,z}\right) ^{v_0}\, \left(\sigma_{k,y,z}\right)^{v_1},\quad j,v_0,v_1 \in \mathbb{N}_0,
\end{equation} where  $p_{k,y,z},\rho_{k,y,z}$ and $\sigma_{k,y,z}$ are to be determined. This is done below.
Proposition 4.2. In the formula (4.5) of  $g_{k,y,z}(\,j,v_0,v_1)$,
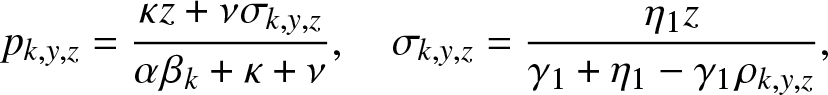 \begin{equation}
p_{k,y,z} = \frac{\kappa z + \nu \sigma_{k,y,z}}{\alpha \beta_k + \kappa + \nu}, ~~~~ \sigma_{k,y,z} = \frac{\eta_1 z}{\gamma_1 + \eta_1 - \gamma_1 \rho_{k,y,z}},
\end{equation}
\begin{equation}
p_{k,y,z} = \frac{\kappa z + \nu \sigma_{k,y,z}}{\alpha \beta_k + \kappa + \nu}, ~~~~ \sigma_{k,y,z} = \frac{\eta_1 z}{\gamma_1 + \eta_1 - \gamma_1 \rho_{k,y,z}},
\end{equation} and  $\rho_{k,y,z}$ is the smallest root of the cubic equation in x:
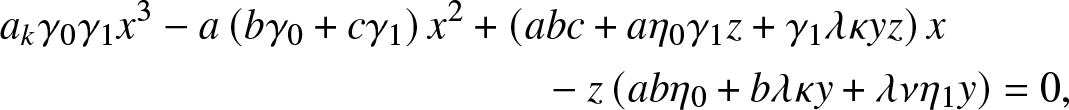 \begin{align}
&a_k\gamma_0\gamma_1 x^3 - a\left(b\gamma_0+c\gamma_1 \right)x^2
+ \left(abc+ a\eta_0\gamma_1 z+\gamma_1\lambda\kappa yz\right)x \nonumber\\
&\qquad\qquad\qquad\qquad\qquad\qquad\quad - z \left(ab\eta_0+b\lambda\kappa y + \lambda \nu \eta_1 y \right) =0,
\end{align}
\begin{align}
&a_k\gamma_0\gamma_1 x^3 - a\left(b\gamma_0+c\gamma_1 \right)x^2
+ \left(abc+ a\eta_0\gamma_1 z+\gamma_1\lambda\kappa yz\right)x \nonumber\\
&\qquad\qquad\qquad\qquad\qquad\qquad\quad - z \left(ab\eta_0+b\lambda\kappa y + \lambda \nu \eta_1 y \right) =0,
\end{align} where  $a_k,b,c$ are the constants $a_k=\alpha \beta_k +\kappa + \nu, b=\gamma_1 + \eta_1$ and $c=\gamma_0 + \eta_0 +\lambda$.
Proof. Conditioning on the first possible event in the epidemic, we see that  $g_{k,y,z}(\,j,v_0,v_1)$ satisfies the relation:
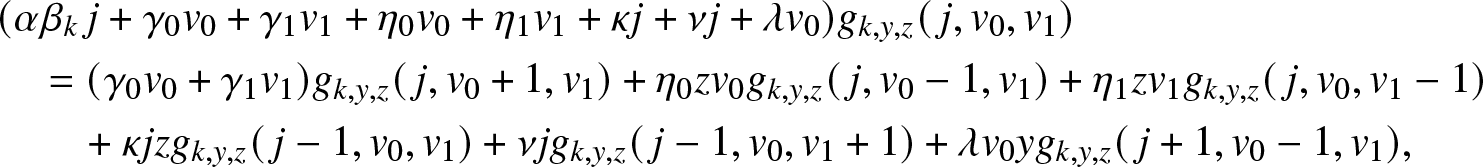 \begin{align}
& (\alpha \beta_k\, j +\gamma_0 v_0 + \gamma_1 v_1 + \eta_0 v_0 +\eta_1 v_1 + \kappa j + \nu j + \lambda v_0) g_{k,y,z}(\,j,v_0,v_1) \nonumber\\
& \quad = (\gamma_0 v_0 + \gamma_1 v_1) g_{k,y,z}(\,j,v_0+1,v_1) + \eta_0 z v_0 g_{k,y,z}(\,j,v_0-1,v_1) + \eta_1 z v_1 g_{k,y,z}(\,j,v_0,v_1-1) \nonumber\\
& \quad ~~~~+ \kappa j z g_{k,y,z}(\,j-1,v_0,v_1) + \nu j g_{k,y,z}(\,j-1,v_0,v_1+1)+ \lambda v_0 y g_{k,y,z}(\,j+1,v_0-1,v_1),
\end{align}
\begin{align}
& (\alpha \beta_k\, j +\gamma_0 v_0 + \gamma_1 v_1 + \eta_0 v_0 +\eta_1 v_1 + \kappa j + \nu j + \lambda v_0) g_{k,y,z}(\,j,v_0,v_1) \nonumber\\
& \quad = (\gamma_0 v_0 + \gamma_1 v_1) g_{k,y,z}(\,j,v_0+1,v_1) + \eta_0 z v_0 g_{k,y,z}(\,j,v_0-1,v_1) + \eta_1 z v_1 g_{k,y,z}(\,j,v_0,v_1-1) \nonumber\\
& \quad ~~~~+ \kappa j z g_{k,y,z}(\,j-1,v_0,v_1) + \nu j g_{k,y,z}(\,j-1,v_0,v_1+1)+ \lambda v_0 y g_{k,y,z}(\,j+1,v_0-1,v_1),
\end{align} with the condition  $g_{k,y,z}(0,0,0)=1$. Using (4.5) and identifying the coefficients of $j, v_0, v_1$ in (4.8), we obtain the following three equations:
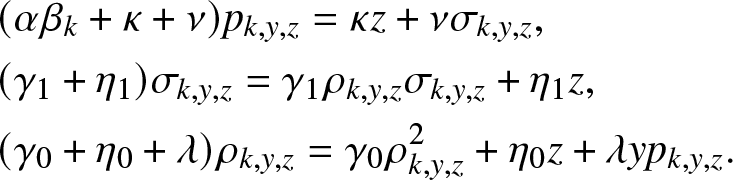 \begin{align}
&(\alpha \beta_k +\kappa +\nu)p_{k,y,z} = \kappa z + \nu \sigma_{k,y,z}, \nonumber\\
&(\gamma_1 + \eta_1)\sigma_{k,y,z} = \gamma_1 \rho_{k,y,z}\sigma_{k,y,z} + \eta_1 z, \nonumber\\
&(\gamma_0 + \eta_0 +\lambda)\rho_{k,y,z} = \gamma_0 \rho_{k,y,z}^2 + \eta_0 z + \lambda y p_{k,y,z}.
\end{align}
\begin{align}
&(\alpha \beta_k +\kappa +\nu)p_{k,y,z} = \kappa z + \nu \sigma_{k,y,z}, \nonumber\\
&(\gamma_1 + \eta_1)\sigma_{k,y,z} = \gamma_1 \rho_{k,y,z}\sigma_{k,y,z} + \eta_1 z, \nonumber\\
&(\gamma_0 + \eta_0 +\lambda)\rho_{k,y,z} = \gamma_0 \rho_{k,y,z}^2 + \eta_0 z + \lambda y p_{k,y,z}.
\end{align} From (4.9), we easily deduce the announced results (4.6) and (4.7). Note that (4.9) is a quadratic equation similar to the one encountered in (3.4). For any value of  $p_{k,y,z} \in (0,1]$, it admits two positive solutions located on either side of 1. We can then verify that (4.7) has three roots, two of which are greater than 1 and the smallest is in $[0,1]$, hence a unique admissible solution to (4.7).
In particular, as for (3.8), we have from (4.5) that:
 \begin{equation*}
\mathbb{E}\big(y^{E_T}z^{R_T}\big) = \left(p_{0,y,z}\right)^{m_J} \, \left(\rho_{0,y,z}\right)^{m_{V_0}} \, \left(\sigma_{0,y,z}\right)^{m_{V_1}}.
\end{equation*}
\begin{equation*}
\mathbb{E}\big(y^{E_T}z^{R_T}\big) = \left(p_{0,y,z}\right)^{m_J} \, \left(\rho_{0,y,z}\right)^{m_{V_0}} \, \left(\sigma_{0,y,z}\right)^{m_{V_1}}.
\end{equation*} When  $\mathcal{R}_0 \lt 1$, the first moments of $(E_T,R_T)$ are finite. Using (4.6), (4.7), we then find
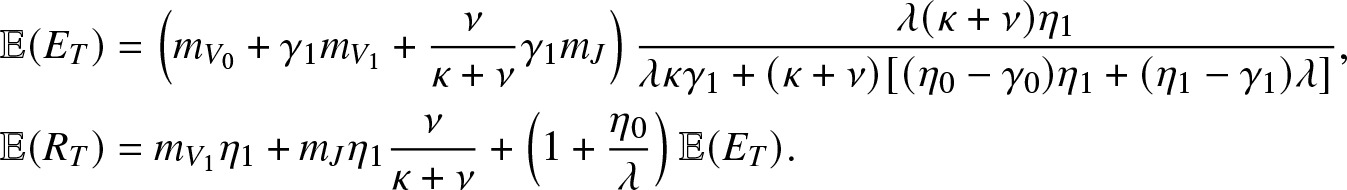 \begin{align*}
& \mathbb{E}(E_T) = \left(m_{V_0}+\gamma_1 m_{V_1} + \frac{\nu}{\kappa+\nu}\gamma_1 m_{J}\right) \frac{\lambda(\kappa+\nu)\eta_1}{\lambda \kappa \gamma_1 + (\kappa+\nu)[(\eta_0-\gamma_0)\eta_1 + (\eta_1-\gamma_1)\lambda]}, \\
& \mathbb{E}(R_T) = m_{V_1} \eta_1+ m_J\eta_1 \frac{\nu}{\kappa+\nu} + \left(1+\frac{\eta_0}{\lambda}\right)\mathbb{E}(E_T).
\end{align*}
\begin{align*}
& \mathbb{E}(E_T) = \left(m_{V_0}+\gamma_1 m_{V_1} + \frac{\nu}{\kappa+\nu}\gamma_1 m_{J}\right) \frac{\lambda(\kappa+\nu)\eta_1}{\lambda \kappa \gamma_1 + (\kappa+\nu)[(\eta_0-\gamma_0)\eta_1 + (\eta_1-\gamma_1)\lambda]}, \\
& \mathbb{E}(R_T) = m_{V_1} \eta_1+ m_J\eta_1 \frac{\nu}{\kappa+\nu} + \left(1+\frac{\eta_0}{\lambda}\right)\mathbb{E}(E_T).
\end{align*}4.2. With a limited reception capacity
Suppose the local population has a reception capacity maximum of  $c \in \mathbb{N}_0$. In addition, as soon as a place is vacant, any external infective is authorized to enter directly into the local population (i.e. access is direct); it can then be removed at the rate κ. So, compared to the model (3.1), the parameter λ is no longer introduced and ν = 0 here. For the infectives of the local structure, the infection and removal rates remain equal to βs and µ.
To illustrate such a situation, let us consider as a local structure a hospital with only c rooms available and in which all external infectives want to be treated as soon as possible. Thus, as long as there are external infectives ( $V\geq 1$), the c rooms of the local structure are all occupied, and they will remain so until the time τ when there are no more visitors, i.e.
 \begin{equation*}
\tau = \inf\{t \gt 0 \,|\, V_t=0\}.
\end{equation*}
\begin{equation*}
\tau = \inf\{t \gt 0 \,|\, V_t=0\}.
\end{equation*} At this point, the external infection is over and the epidemic in the local population will continue for some time until the c visitors and the internal infectives are all removed. Therefore, the event  $(T \lt \infty)$ is equivalent to $(\tau \lt \infty)$.
For this model, a very different property is that the expectation  $g_{k,y,z}(\,j,v)$ no longer has a simple product form as in (3.2) and (4.5). Indeed, $v\geq 1$ necessarily implies that j = c. Its expression nevertheless remains quite simple to determine. As usual, $1_{\{.\}}$ denotes the indicator function of $\{.\}$.
Proposition 4.3. For  $0\leq j\leq c$ and $v \in \mathbb{N}_0$,
 \begin{equation}
g_{k,y,z}(\,j,v) = \Big(\frac{z\kappa}{\kappa + \alpha \beta_k}\Big)^c\, h_{k,y,z}(c,v) \, 1_{\{v\geq 1,j=c\}} + \Big(\frac{z\kappa}{\kappa + \alpha \beta_k}\Big)^j \, 1_{\{v=0\}},
\end{equation}
\begin{equation}
g_{k,y,z}(\,j,v) = \Big(\frac{z\kappa}{\kappa + \alpha \beta_k}\Big)^c\, h_{k,y,z}(c,v) \, 1_{\{v\geq 1,j=c\}} + \Big(\frac{z\kappa}{\kappa + \alpha \beta_k}\Big)^j \, 1_{\{v=0\}},
\end{equation} where  $h(v)\equiv h_{k,y,z}(c,v)$ satisfies the recursion $h(0)=1$ and,
 \begin{equation}
(c\alpha \beta_k + c\kappa + \eta v + \gamma v) h(v) = (c\kappa y + \eta z v) h(v-1) + \gamma v h(v+1), \quad v\geq 1.
\end{equation}
\begin{equation}
(c\alpha \beta_k + c\kappa + \eta v + \gamma v) h(v) = (c\kappa y + \eta z v) h(v-1) + \gamma v h(v+1), \quad v\geq 1.
\end{equation}Proof. Suppose first that  $V_0=v\geq 1$, and thus $J_0=c$. In the spirit of (2.3), we denote,
 \begin{equation}
h_{k,y,z}(c,v) = \mathbb{E}\left[ y^{E_{\tau}} z^{R_{\tau}} \, \mathbb{1}_{\{\tau \lt \infty, C_k\}} \,\big|\, (S_0,I_0)=(k,0), (J_0, V_0)=(c,v) \right],
\end{equation}
\begin{equation}
h_{k,y,z}(c,v) = \mathbb{E}\left[ y^{E_{\tau}} z^{R_{\tau}} \, \mathbb{1}_{\{\tau \lt \infty, C_k\}} \,\big|\, (S_0,I_0)=(k,0), (J_0, V_0)=(c,v) \right],
\end{equation} where Ck is the event that the k initial suceptibles are not contaminated until time τ. Conditioning on the first admissible event in the process  $\{(S_t,I_t,J_t,V_t), t \geq 0\}$, we easily see that $h(v)\equiv h_{k,y,z}(c,v)$ satisfies the announced recursion (4.11).
Now, at time  $\tau, V_{\tau}=0$ and there are c visitors present in the local population. Thus, $h(v)=h(0)$ and from (4.12), we have,
 \begin{align*}
h(0) = z^c \, r_k(c),
\end{align*}
\begin{align*}
h(0) = z^c \, r_k(c),
\end{align*}after denoting
 \begin{equation}
r_k(\,j) = \mathbb{P}\left( C_k\,|\, (S_0,I_0)=(k,0), (J_0, V_0)=(\,j,0) \right), \quad 0\leq j\leq c.
\end{equation}
\begin{equation}
r_k(\,j) = \mathbb{P}\left( C_k\,|\, (S_0,I_0)=(k,0), (J_0, V_0)=(\,j,0) \right), \quad 0\leq j\leq c.
\end{equation} Moreover,  $r_k(0)=1$ and for $j\geq 1$, we get,
 \begin{align*}
(\alpha \beta_k\, j + \kappa j) r_k(\,j) = \kappa j r_k(\,j-1),
\end{align*}
\begin{align*}
(\alpha \beta_k\, j + \kappa j) r_k(\,j) = \kappa j r_k(\,j-1),
\end{align*}so that,
 \begin{equation}
r_k(\,j) = \Big(\frac{\kappa}{\kappa + \alpha \beta_k}\Big)^j, \quad 0\leq j\leq c.
\end{equation}
\begin{equation}
r_k(\,j) = \Big(\frac{\kappa}{\kappa + \alpha \beta_k}\Big)^j, \quad 0\leq j\leq c.
\end{equation} Finally, it is clear from (4.12), (4.13) that  $g_{k,y,z}(\,j,v)$ can be expressed as:
 \begin{equation*}
g_{k,y,z}(\,j,v) = h_{k,y,z}(c,v) \, z^c \, r_k(c) \, 1_{\{v\geq 1,j=c\}} + z^j\, r_k(\,j) \, 1_{\{v=0\}}.
\end{equation*}
\begin{equation*}
g_{k,y,z}(\,j,v) = h_{k,y,z}(c,v) \, z^c \, r_k(c) \, 1_{\{v\geq 1,j=c\}} + z^j\, r_k(\,j) \, 1_{\{v=0\}}.
\end{equation*} As long as there are external individuals waiting outside the local structure, the process  $\{J_t, t\geq 0\}$ remains fixed at level c. Thus, the process $\{V_t, t\geq 0\}$ is an absorbing birth-death process with birth rates $\gamma v$ and death rates $\kappa c + \eta v$. In fact, recursion (4.11) is classic in this framework and can be solved by standard methods. Since $T \lt \infty$ when this infection process dies out in a finite time, it is also well known that:
 \begin{equation*}
(T \lt \infty)\, \mbox{a.s.} ~\Leftrightarrow ~ \sum_{j=0}^{\infty} \big(\prod_{v=1}^{j} \frac{\kappa c + \eta v}{\gamma v}\big) = \infty.
\end{equation*}
\begin{equation*}
(T \lt \infty)\, \mbox{a.s.} ~\Leftrightarrow ~ \sum_{j=0}^{\infty} \big(\prod_{v=1}^{j} \frac{\kappa c + \eta v}{\gamma v}\big) = \infty.
\end{equation*} In that case, the variable RT is almost surely finite and corresponds to the total number of births before extinction (including the mJ initial external infectives inside the local structure). The expectations  $\mathbb{E}(R_T)$ and $\mathbb{E}(E_T)$, for example, can be calculated from classical recurrences in the same vein as (4.11).
Without direct access. Suppose that the local structure still has capacity c but external infectives can again enter at rate λ (i.e. access is random). Thus, the epidemic process is characterized by the rates (2.2) except that the entry rate λ is replaced by  $\lambda 1_{\{\,j \lt c\}}$.
In this case, the recursion for  $g_{k,y,z}(\,j,v)$ is more intricated and becomes:
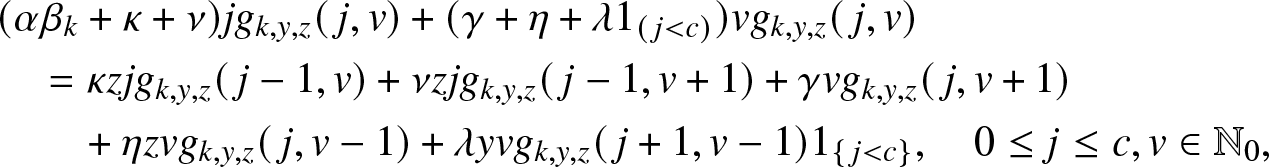 \begin{align}
&(\alpha \beta_k +\kappa +\nu)j g_{k,y,z}(\,j,v) + (\gamma +\eta +\lambda 1_{(\,j \lt c)}) v g_{k,y,z}(\,j,v) \nonumber\\
& \quad = \kappa z j g_{k,y,z}(\,j-1,v) + \nu z j g_{k,y,z}(\,j-1,v+1) + \gamma v g_{k,y,z}(\,j,v+1) \nonumber\\
&\quad ~~~~ + \eta z v g_{k,y,z}(\,j,v-1) + \lambda y v g_{k,y,z}(\,j+1,v-1) 1_{\{\,j \lt c\}}, \quad 0\leq j\leq c, v\in \mathbb{N}_0,
\end{align}
\begin{align}
&(\alpha \beta_k +\kappa +\nu)j g_{k,y,z}(\,j,v) + (\gamma +\eta +\lambda 1_{(\,j \lt c)}) v g_{k,y,z}(\,j,v) \nonumber\\
& \quad = \kappa z j g_{k,y,z}(\,j-1,v) + \nu z j g_{k,y,z}(\,j-1,v+1) + \gamma v g_{k,y,z}(\,j,v+1) \nonumber\\
&\quad ~~~~ + \eta z v g_{k,y,z}(\,j,v-1) + \lambda y v g_{k,y,z}(\,j+1,v-1) 1_{\{\,j \lt c\}}, \quad 0\leq j\leq c, v\in \mathbb{N}_0,
\end{align} with  $g_{k,y,z}(0,0)=1$. Obviously, $g_{k,y,z}(\,j,v)$ is no longer of simple product form. The computation of $g_{k,y,z}(\,j,v)$ from (4.15) requires the use of further tools. One possibility is to note that the generator of the process $\{(V_t,J_t), t\geq 0\}$ can be structured as a level-dependent Quasi-Birth-and-Death process where Vt represents the level and Jt the phase, and then apply some of the results presented, e.g. in the book by [Reference Latouche and Ramaswami10].
5. Some numerical examples
Let us illustrate the application of some of the obtained results. For the sake of brevity, we will mainly focus on the basic epidemic model of Section 3.
Figures 2 and 3 show how several statistics of interest vary as the entry rate λ increases. For these examples, the epidemic starts with n = 50 susceptibles,  $m_V=10$ external infectives, $m=m_J=0$ other infectives, and the different rates are $\beta_s = 1.5 s/n, \alpha = 0.5$, µ = 1, γ = 0.75, η = 1, $\nu=\kappa = 0.5$.
The coefficient  $\mathcal{R}_0$ (left) and the number $\mathbb{E}(R_T)$ (right) as functions of the rate λ in the model of Section 3. The data are n = 50, $m_V=10$, $m=m_J=0$, and $\beta_s = 1.5s/n$, α = 0.5, µ = 1, γ = 0.75, η = 1, $\nu=\kappa = 0.5$.

The numbers  $\mathbb{E}(n-S_T)$ (left) and $\mathbb{E}(R_{TOT})$ (right) as functions of the rate λ in the model of Section 3. The data are n = 50, $m_V=10$, $m=m_J=0$, and $\beta_s = 1.5s/n$, α = 0.5, µ = 1, γ = 0.75, η = 1, $\nu=\kappa = 0.5$.
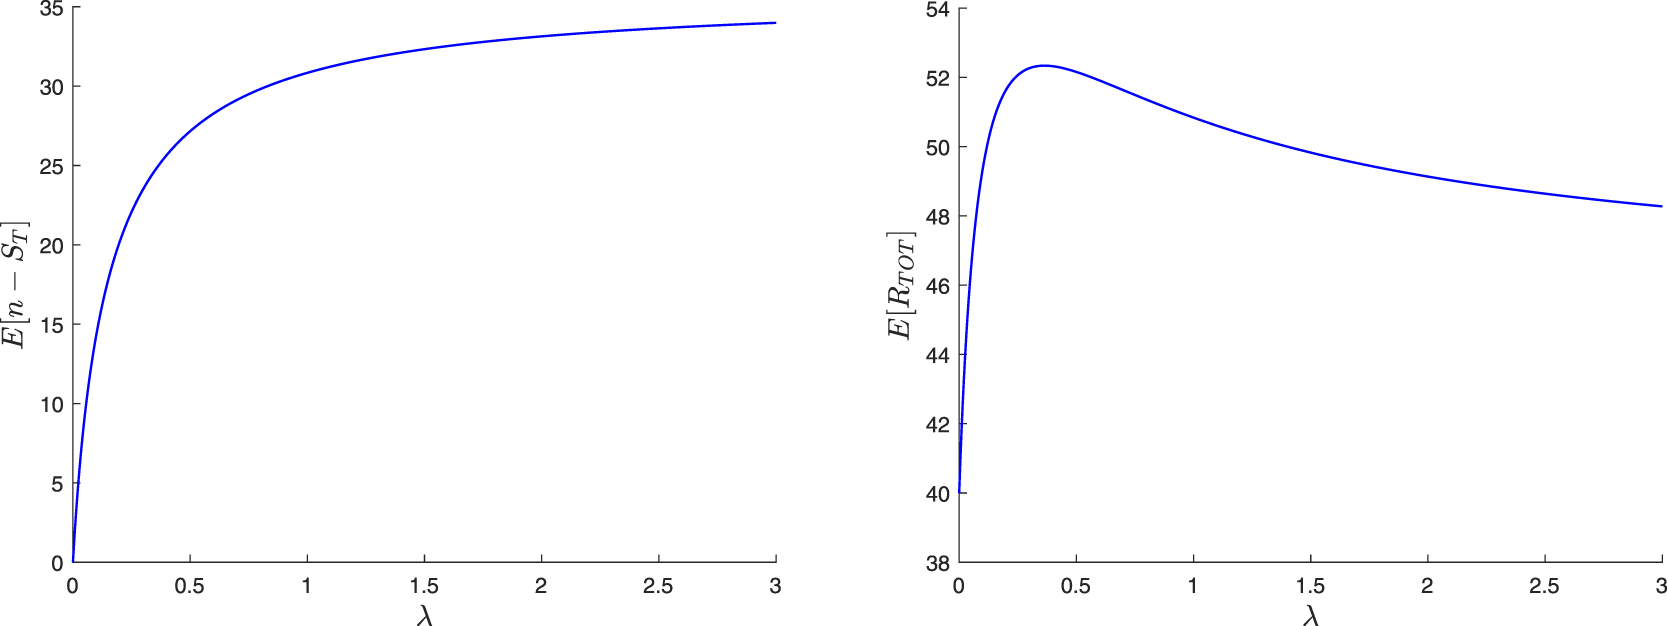
In Figure 2, we plot the graph of  $\mathcal{R}_0$ (given by (3.1)) and the expected final number of external removals, $\mathbb{E}(R_T)$ (given by (3.9)), as functions of the entry rate λ. Note that $\mathcal{R}_0 \lt 1$ for the chosen parameters, so $\mathbb{E}(R_T) \lt \infty$. According to the formulas used, we see that the two curves are in fact decreasing in λ. This is not surprising because with a higher value of λ, there are more external inputs and therefore less possibility of reproduction.
In Figure 3, the first graph shows that the opposite happens for the expected total number of removals in the local population,  $\mathbb{E}(n-S_T)$ (obtained from (3.11) in the affine case): of course this number increases from 0 with λ. The second graph concerns the expected total number of removals from both populations, i.e. $\mathbb{E}(R_{TOT})$ where $R_{TOT} = R_T + (n-S_T)$. This number increases rapidly for small values of λ and then decreases slowly. Thus, minimizing $\mathbb{E}(R_{TOT})$ implies taking λ = 0, i.e. preventing any access to the local population. The reason for this is that the epidemic spreads very slowly in the external population ( $\gamma/\eta$ is small), and it would die out quickly without intervention: here then, the addition of a local structure makes the situation globally worse.
On the other hand, the situation is different when the external epidemic is stronger. This is illustrated in Figure 4 where the parameters have not changed except that now γ = 1.5 (instead of 0.75). Here,  $\mathcal{R}_0 \gt 1$ for $\lambda \in (0,1)$. For this range of values, the first graph shows that $\mathbb{E}(n-S_T)$ starts high due to the non-zero probability that the external infectious population will explode. Then, it decreases quite sharply with λ > 1. In the second graph, $\mathbb{E}(R_{TOT})$ is infinite for $\lambda \in (0,1)$, then decreases sharply from λ = 1. In such a case, the presence of the local structure has a considerable positive impact on the expected total damage caused by the epidemic.


Figure 5 examines now the dependence on the external infection rate γ. The initial population sizes are the same as before, but the rates are changed to  $\beta_s = 2s/n$, α = 0.5, µ = 1, η = 2, $\nu=\kappa = 1$ and λ = 0.5 or 2. In all cases, we have $\mathcal{R}_0 \lt 1$. The first graph illustrates that, as expected, $\mathbb{E}(S_T)$ decreases with γ. We also observe that $\mathbb{E}(S_T)$ is smaller for λ = 2 than for λ = 0.5. Together with the second graph drawing $\mathbb{E}(R_{TOT})$, this confirms the observation made with Figure 3 that the presence of the local structure can be a handicap (regarding the global number of infections) when the external epidemic is too weak (for γ < 1.5). However, the second graph shows that a local structure with a higher entry rate λ can be beneficial when γ is sufficiently high (i.e. after the crossing of the two curves).
The numbers  $\mathbb{E}(S_T)$ (left) and $\mathbb{E}(R_{TOT})$ (right) as functions of the external infection rate γ in the model of Section 3, for λ = 0.5 or 2. The data are n = 50, $m_V=10$, $m=m_J=0$, and $\beta_s = 2s/n$, α = 0.5, µ = 1, η = 2, $\nu=\kappa = 1$.
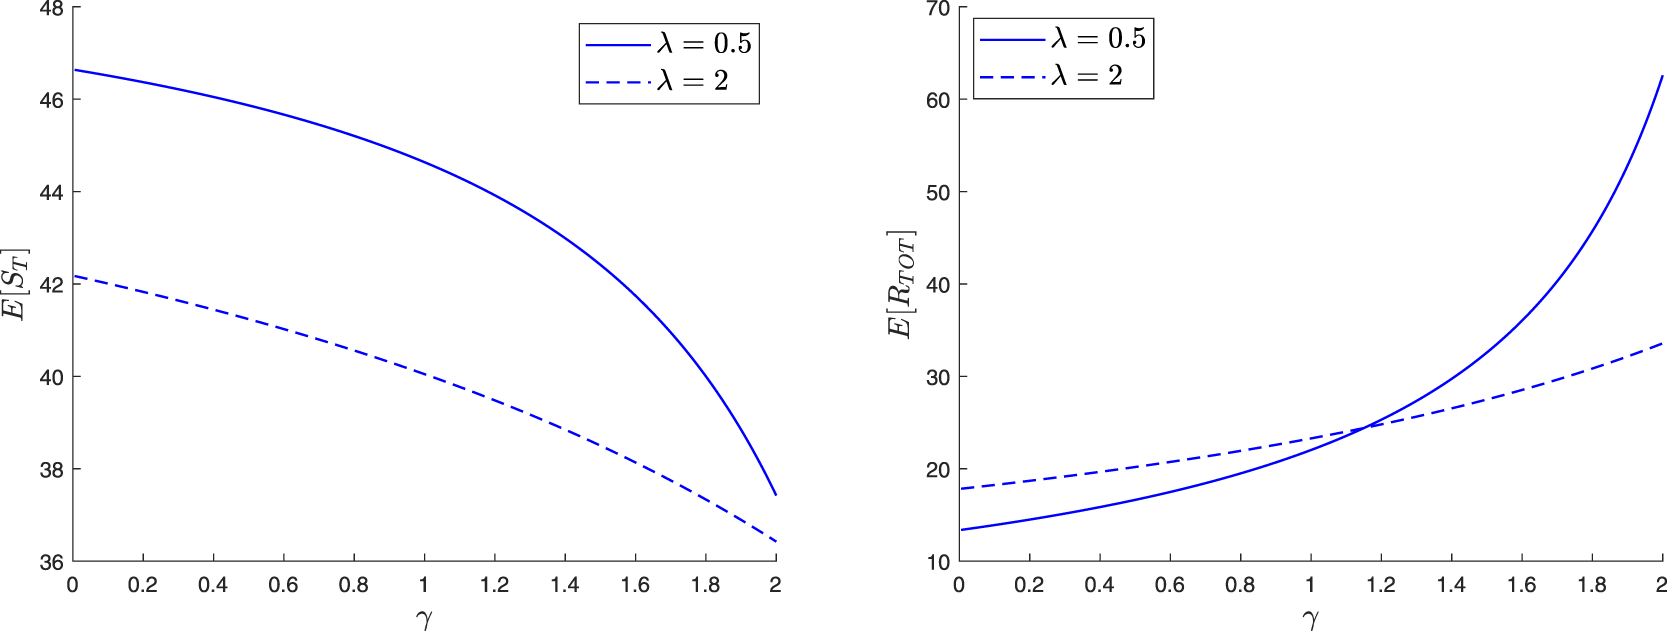
Figure 6 provides the correlations between RT, the total number of external infections, and  $n-S_T$, the total number of internal infections. The model is again that of Section 3 with n = 50, $m_V=10$, $m=m_J=0$, and $\beta_s = 0.5s/n$, α = 2, µ = 1, η = 2, ν = 0, κ = 1. On the left, the correlations are given as a function of λ for γ = 0.75 or 1.5, and on the right, as a function of the external infection rate γ for λ = 0.5 or 2. To obtain these correlations, we write $\mathbb{E}(R_T S_T) = \sum_{s=0}^{n}\mathbb{E}(R_T \,\mathbb{1}_{\{S_T=s\}})$, and the terms in the sum are computed by solving the system (2.17) after differentiation in y and with $y=z=1$. Moreover, the expectations and variances of RT and ST are obtained by differentiation in (2.18). As expected, the correlations are positive and we note that they increase with λ except for large values of λ (as seen before, the local structure then has a negative effect). A similar result is observed with γ when it is not too high.
The correlations between RT and  $n-S_T$ in the model of Section 3, as functions of the rate λ for γ = 0.75 or 1.5 (left), and of the external infection rate γ for λ = 0.5 or 2 (right). The data are n = 50, $m_V=10$, $m=m_J=0$, and $\beta_s = 0.5s/n$, α = 2, µ = 1, η = 2, ν = 0, κ = 1.
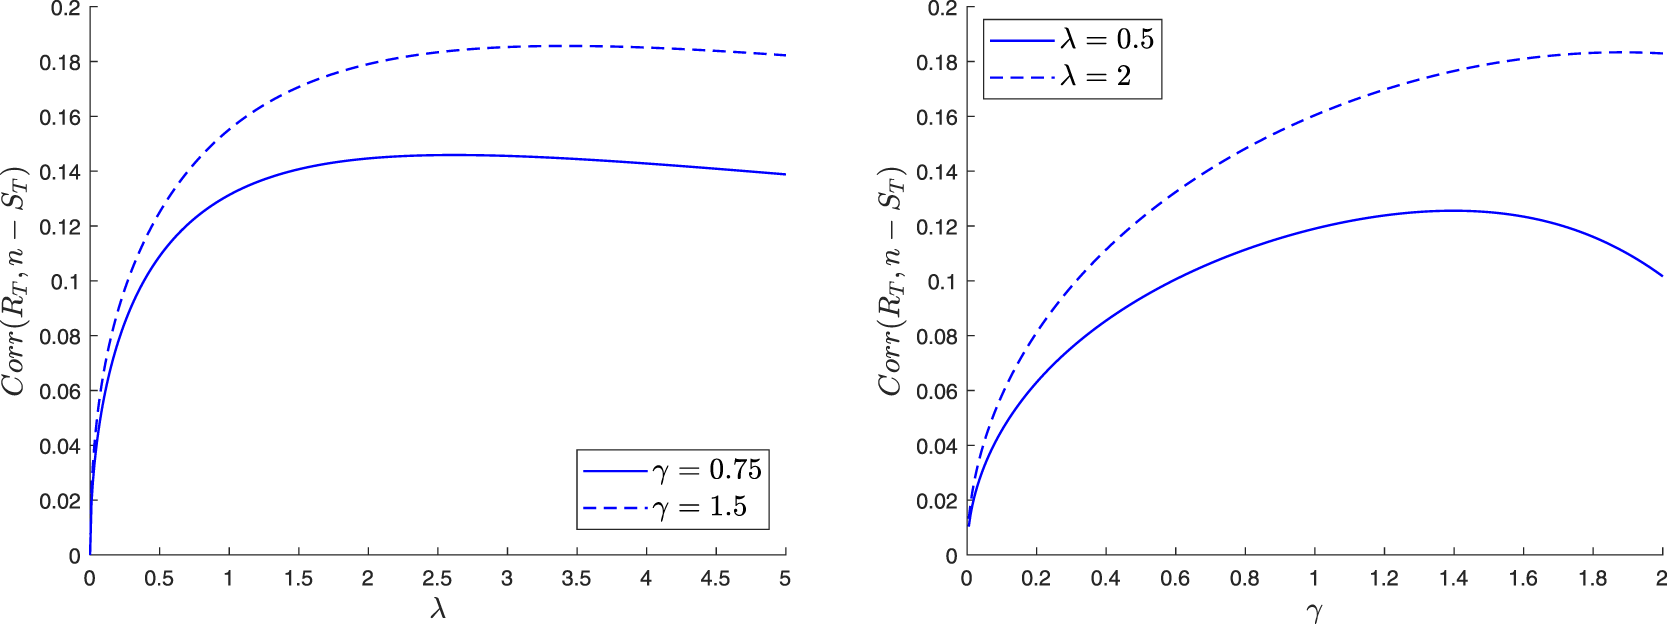
The number  $\mathbb{E}(R_{TOT})$ as function of the external infection rate γ 1 in the model of Section 4.1, for λ = 0.5 or 2 and $\gamma_0=1.5$ (left) or $\gamma_0=2$ (right). The data are n = 50, $m_{V_0}=10$, $m_{V_1}=m=m_J=0$, and $\beta_s = 2s/n$, α = 0.5, µ = 1, $\eta_0=\eta_1=1$, $\nu=\kappa=1$.
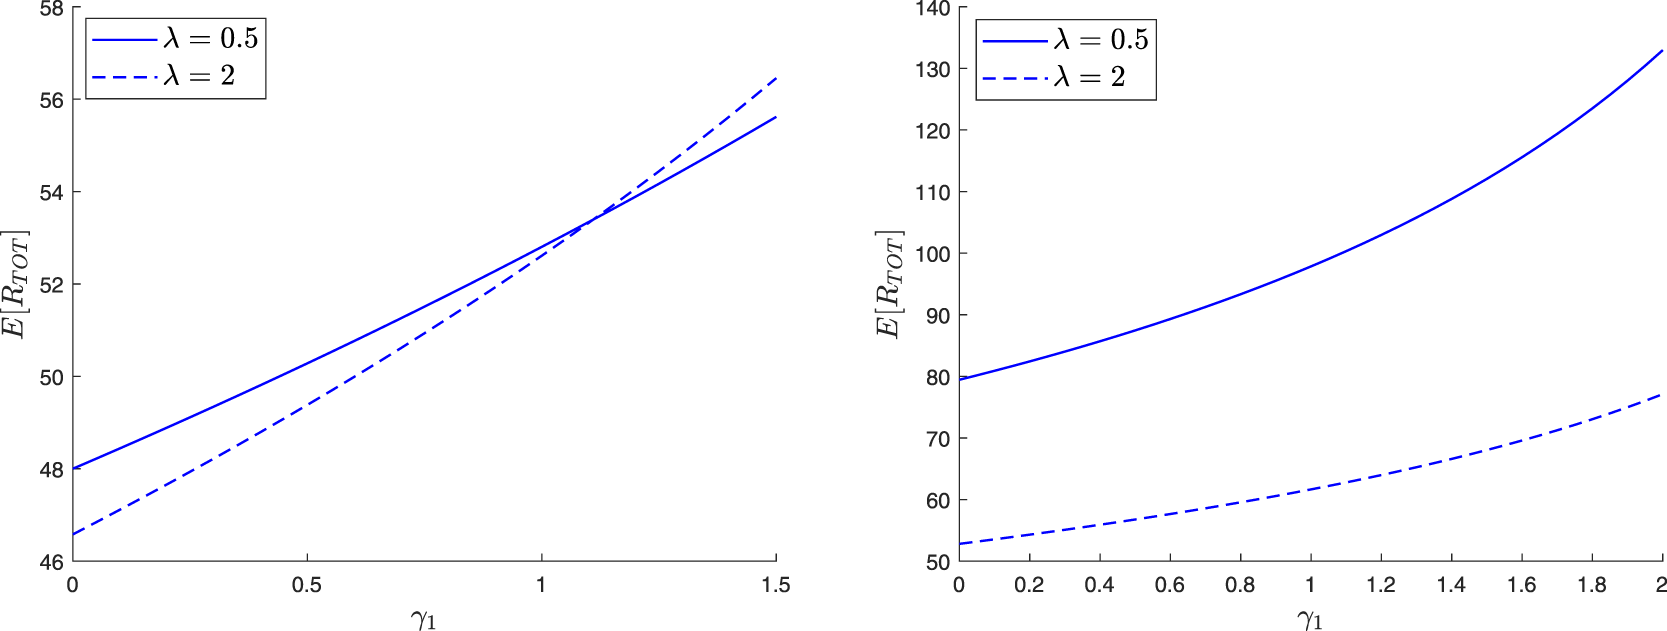
Finally, we move on to the model with limited access presented in Section 4.1. The purpose of Figure 7 is to show the influence of the external infection rate γ 1 on the statistic  $\mathbb{E}(R_{TOT})$. The initial population sizes are n = 50, $m_{V_0}=10$, $m_{V_1}=m=m_J=0$, and the rates are $\beta_s=2s/n$, α = 0.5, µ = 1, $\gamma_0=0.8$, $\eta_0=\eta_1=1$, $\nu=\kappa=1$, λ = 0.5 or 2 and $\gamma_0=1.5$ (left graph) or $\gamma_0=2$ (right graph). Note that we take $\gamma_1\le\gamma_0$ with the idea that after a first visit to the local population, the external infectives have already received some care and become less contagious. Compared to Figure 3, we see here that the choice of a higher entry rate λ leads much more often to an improvement in the final situation. Indeed, there is now an added benefit to visiting the local population as it makes the infectives less contagious when they return outside the local structure. The empirical conclusions from before (i.e. the presence of the local structure worsens the global outcome when the external epidemic is weak) apply less often, only for smaller values of γ 1 and when γ 0 is very close to γ 1.
Acknowledgments
We thank the editor and referees for valuable comments and suggestions. The work of C. Lefèvre was carried out within the DIALog Research Chair under the aegis of the Risk Foundation, an initiative of CNP Assurances.
Funding statement
M. Simon is grateful to the Belgian FRS-FNRS for its partial support through a grant Crédit de Recherche.
Competing interests
The authors declare no conflict of interest.


 Open access