


The degree of complexity in survey design depends on the nature of the research question, just as the method of data collection influences the choice of sampling technique. For example, straightforward telephone interviews allow relatively simple sample designs, but comprehensive nutrition surveys tend to be longer and more complex. Moreover, collection of reliable anthropometric data involves face-to-face interviewing. To improve efficiency and reduce costs, nutrition and physical activity surveys often use complicated sample designs, involving stratified multistage sampling techniques. These designs can include the use of stratification, clustering and unequal probabilities of selection for different individuals. The resulting sample is not spread evenly throughout the population, but occurs in groups or clusters.
The 2007 Australian National Children's Nutrition and Physical Activity Survey (ANCNPAS07)( 1 ) was undertaken to obtain food, nutrient, physical activity and anthropometric data on a national sample of children aged 2–16 years. The purpose of the survey was to enable food, beverage, supplement and nutrient intakes and physical activity levels among children to be assessed against relevant national guidelines. For these data, the use of clustering, unequal selection probabilities, stratification and sample weighting led to estimates having a sampling variance different from that which would have been obtained using a simple random sample (SRS). An SRS gives each possible sample the same chance of selection and means that the sample is spread approximately evenly through the population. For an SRS the calculation of estimates and associated standard errors is relatively straightforward. Standard methods of statistical analysis assume that an SRS has been obtained.
If the analysis of a nutrition survey ignores the complex design, the results will be methodologically unsound and subject to serious dispute. Typically confidence intervals will be too small, leading to inflation of type I error rates. That is, statistical significance is found when there is no real effect. The problem is not solved merely by using the sample weights which account for differences in selection probabilities, although this is often incorrectly assumed. In fact this view is implicitly encouraged if the survey data are released with, for example, no cluster information. Even when an analysis uses sample weights and the contribution of the clustering to the overall design effect is low, use of standard analysis will not reflect the impact of the weights on variances. The use of sampling weights and the impact of complex sampling methods on survey analysis have received considerable attention over the past two decades( Reference Clark and Steel 2 – Reference Pfeffermann 5 ).
The importance of properly accounting for sampling weights and the sample design is strongly emphasized in well-established surveys in the USA, for example the National Health and Nutrition Examination Survey (NHANES). Information on the NHANES website( 6 ) states that:
For NHANES datasets, the use of sampling weights and sample design variables is recommended for all analyses because the sample design is a clustered design and incorporates differential probabilities of selection. If you fail to account for the sampling parameters, you may obtain biased estimates and overstate significance levels.
Moreover the National Center for Health Statistics (NCHS) Analytic and Reporting Guidelines( 7 ) state (p. 7) that ‘Sample weights and the stratification and clustering of the design must be incorporated into an analysis to get proper estimates and standard errors of estimates’ and that proper variance estimation procedures be used.
The aim of the study reported here was to assess the impact of complex survey design used in the ANCNPAS07 on prevalence estimates for intakes of groups of foods in the population of Australian children.
Methods
Data for the present analysis were obtained from the Australian Social Science Data Archive, Australian National University(
1
) under agreed conditions for research. The data made available for the analysis were de-identified and separate ethical approval was not required. The study reported here used the concept of design effects to quantify the effect of the sample design on prevalence estimates. For each estimate, design effects were used to measure the impact of stratification, clustering, unequal inclusion probabilities and other features of the sampling used. The design effect (deff) is the ratio of the sampling variance obtained using a complex survey design relative to the variance that would have been obtained from a simple random sample without replacement (SRSWOR) with the same expected sample size(
Reference Kish
8
). The deff for a parameter {θ } is calculated using the relationship  is the design-based estimate of the variance for the parameter estimate
  from a complex survey of size n, and
  is the variance estimate of the parameter
  estimated from a similar hypothetical survey using SRSWOR and a sample size of n.
A design effect greater than one increases the width of confidence intervals, reduces the amount of disaggregation that is possible and reduces the power of analyses that are properly carried out. This limits the strength and value of the results. For example, suppose a survey has been designed using standard methods which assume an SRS to give a power of detecting important effects of 80 %. With a deff of 1·5 the power reduces to 65 %; for a deff of 2 it becomes 45 %; and for deff of 4 it is 35 %. Tests of statistical significance are also affected and a deff of 4 increases the conventional 5 % false positive rate used in hypothesis testing to 33 %.
A design effect can also be expressed as the effective sample size,  . For example, a sample of 4000 respondents has an effective sample size of 1000 if the deff is 4. So selecting several respondents within a cluster will be less efficient in terms of variance than using SRS. This has substantial implications for the way in which the survey data may be acceptable to the wider community and used in policy development.
ANCNPAS07 was conducted using a sampling scheme stratified by state/territory and by capital city statistical division/rest of state into thirteen strata. The number of children included from each state was proportional to the population of children in that state or territory. To collect physical activity data, anthropometric measurements and a 24 h diet history, an initial face-to-face interview was used. To facilitate the face-to-face interviewing and to help meet budget and time restrictions, fifty-four regions encompassing 246 postcodes were selected which were effectively primary sampling units (PSU). Initial selection and contact was made using random digit dialling (RDD) for telephone prefixes broadly corresponding to the selected postcodes and data were collected using computer-assisted personal interviewing (CAPI) and subsequent computer-assisted telephone interviewing (CATI).
The use of RDD led to the inclusion of individuals from 481 postcodes, due to both the overlap between telephone number prefixes and postcodes and telephone number portability. A location variable was created after selection so that participants in a close geographic proximity, based on their postcodes, were given the same location. These locations and the fifty-four PSU were both used to calculate design effects to demonstrate the impact of using incorrect sample information. In the sample design one stratum contained only one PSU, so to enable variance calculations the PSU was divided in half, resulting in fifty-five clusters. Similarly, within each stratum, locations with single observations were grouped, reducing the total number of locations from 210 to 194. We found the responding sample to be highly clustered with an average of 88 children per cluster (for the CAPI), varying from 19 to 161 (sd 29). Locations had an average size of 25 responding children, varying from 2 to 177 (sd 29).
In the sample, one child was selected per household leading to 4837 selected children and complete data for 4487 children. Within selected clusters, the probability of selection of a child depended on his/her location (stratum), age, gender and household composition. To account for the non-proportional sampling, weights were created based on age (divided into four groups), gender and stratum. A single weight, called the initial weight and denoted w
1, was produced for each child in the survey on the basis of a sample size of n = 4837. The initial weight for child i, i = 1,…,n, equals  , where nh
is the number of respondents in stratum h and Nh
is the corresponding population. Separate weights were not included for respondents who did not complete all components of the survey, and household size and family structure were not included in the weights. The probability of selection was therefore only partially accounted for by the weights. Furthermore, as there were complete nutrient data from the CAPI for only 4826 of the 4837 participants, the population totals using the weights did not correspond to those for Australia available from the 2006 Census.
, where nh
is the number of respondents in stratum h and Nh
is the corresponding population. Separate weights were not included for respondents who did not complete all components of the survey, and household size and family structure were not included in the weights. The probability of selection was therefore only partially accounted for by the weights. Furthermore, as there were complete nutrient data from the CAPI for only 4826 of the 4837 participants, the population totals using the weights did not correspond to those for Australia available from the 2006 Census.
Due to the limitations in the weighting process, a final weight (w
2) was created by adjusting w
1 to fit population benchmarks and accounting for the probability of selection of each child in a household. Assuming that all children in a household had an equal probability of selection, the probability of selection for each subject was calculated as πi
= 1/(number of children aged 2–16 in household). The total effective sample size in stratum h using the final weight was  and using initial weights was nh
. The final weight for each subject in stratum h was obtained using
and using initial weights was nh
. The final weight for each subject in stratum h was obtained using  .
.
Sample weights are used to produce an estimate which is less biased than its unweighted counterpart. However, the increased accuracy must be balanced against the increased design effect(
Reference Kish
9
). One approach to choosing the most efficient estimator is to examine the mean square error ( ) for each parameter(
Reference Korn and Graubard
10
). For multiple variables, the relative mean square error (RMSE) can be used. Assuming the final weights produced unbiased estimates, the RMSE for the estimate of a mean (
) for each parameter(
Reference Korn and Graubard
10
). For multiple variables, the relative mean square error (RMSE) can be used. Assuming the final weights produced unbiased estimates, the RMSE for the estimate of a mean ( ) is
) is ![--><$> RMS{{E}_{{{w}_2}}}\, = \,{{\left[ {V\left( {{{{\bar{Y}}}_{{{w}_2}}}} \right)} \right]} \mathord{\left/ {\vphantom {{\left[ {V\left( {{{{\bar{Y}}}_{{{w}_2}}}} \right)} \right]} {{{{\bar{Y}}}_{{{w}_2}}}}}} \right. \kern-\nulldelimiterspace} {{{{\bar{Y}}}_{{{w}_2}}}}} <$><!--](https://static.cambridge.org/binary/version/id/urn:cambridge.org:id:binary:20160921033006806-0442:S1368980011003326:S1368980011003326_eqnU12.gif?pub-status=live) , where
, where  is the variance of the estimate, calculated using the final weight w
2. Otherwise,
is the variance of the estimate, calculated using the final weight w
2. Otherwise, ![--><$> RMS{{E}_{{{w}_1}}}\, = \,{{\left[ {{{{\left( {{{{\bar{Y}}}_{{{w}_1}}}\,{\rm{ - }}\,{{{\bar{Y}}}_{{{w}_2}}}} \right)}}^2} \, + \,V\left( {{{{\bar{Y}}}_{{{w}_1}}}} \right)} \right]} \mathord{\left/ {\vphantom {{\left[ {{{{\left( {{{{\bar{Y}}}_{{{w}_1}}}\,{\rm{ - }}\,{{{\bar{Y}}}_{{{w}_2}}}} \right)}}^2} \, + \,V\left( {{{{\bar{Y}}}_{{{w}_1}}}} \right)} \right]} {{{{\bar{Y}}}_{{{w}_1}}}}}} \right. \kern-\nulldelimiterspace} {{{{\bar{Y}}}_{{{w}_1}}}}} <$><!--](https://static.cambridge.org/binary/version/id/urn:cambridge.org:id:binary:20160921033006806-0442:S1368980011003326:S1368980011003326_eqnU14.gif?pub-status=live) . The estimator with the smallest RMSE is preferred.
. The estimator with the smallest RMSE is preferred.
The coefficient of variation of the weights is given by  , where sw
is the standard deviation of the weights and
, where sw
is the standard deviation of the weights and  is the mean. It measures the increased variance of the estimate due to the use of weights. When selection probabilities are not correlated with a variable, the design effect due to weighting is given by(
Reference Kish
8
,
Reference Gabler, Haeder and Lahiri
11
)
is the mean. It measures the increased variance of the estimate due to the use of weights. When selection probabilities are not correlated with a variable, the design effect due to weighting is given by(
Reference Kish
8
,
Reference Gabler, Haeder and Lahiri
11
)
 . When correlation is present, approximations can be made(
Reference Spencer
12
).
. When correlation is present, approximations can be made(
Reference Spencer
12
).
Under some mild assumptions the contribution of sample clustering for the estimation of prevalence of a condition or risk factor is reflected in the relationship  is the average number of respondents per cluster and δ is a measure of the within-cluster homogeneity or intra-class correlation (ICC). Values of δ
around 0·05 are common, which with
is the average number of respondents per cluster and δ is a measure of the within-cluster homogeneity or intra-class correlation (ICC). Values of δ
around 0·05 are common, which with  gives deff = 5 and with
  gives deff = 1·5. Hence the more clustered the design the higher the design effect. If the size of the clusters varies considerably, more complicated formulas apply. For applications where the clustering and weighting effects are multiplicative, the design effect is given by(
Reference Gabler, Haeder and Lahiri
11
)
gives deff = 1·5. Hence the more clustered the design the higher the design effect. If the size of the clusters varies considerably, more complicated formulas apply. For applications where the clustering and weighting effects are multiplicative, the design effect is given by(
Reference Gabler, Haeder and Lahiri
11
)
![--><$> deff\, = \,\left[ {1\, + \,\left( {\bar{n}\,{\rm{ - }}\,1} \right)\delta } \right] \cdot \left( {1\, + \,C_{w}^{2} } \right) <$><!--](https://static.cambridge.org/binary/version/id/urn:cambridge.org:id:binary:20160921033006806-0442:S1368980011003326:S1368980011003326_eqnU22.gif?pub-status=live) .
.
Statistical analysis
Design effects were estimated for the prevalence estimates of food consumption for ANCNPAS07 using the STATA statistical software package release 10 (2007; StataCorp LP, College Station, TX, USA). The variables chosen for analysis were the 120 three-digit sub-major groups used in the food categorization. The parameters chosen for analysis were mean consumption of each sub-major food group in grams and the proportion of the population consuming each food group. The CAPI 24 h recall diet history was used for all analyses.
Estimates and estimates of sampling variances were produced under a number of options for treating the weights and sample design features, including:
-
1. unweighted analysis assuming SRS;
-
2. weighted analysis assuming SRS;
-
3. weighted analysis incorporating stratification (thirteen strata) and clustering using the 194 locations in the data file; and
-
4. weighted analysis incorporating stratification (thirteen strata) and clustering using the fifty-five PSU.
Analysis under option 1 was the naïve analysis. The estimates and estimated variances were compared with analyses under option 4, which properly reflected the weighting and complex design. Option 2 accounts for the weighting but ignores the sample design and option 3 uses incorrect clusters.
Results
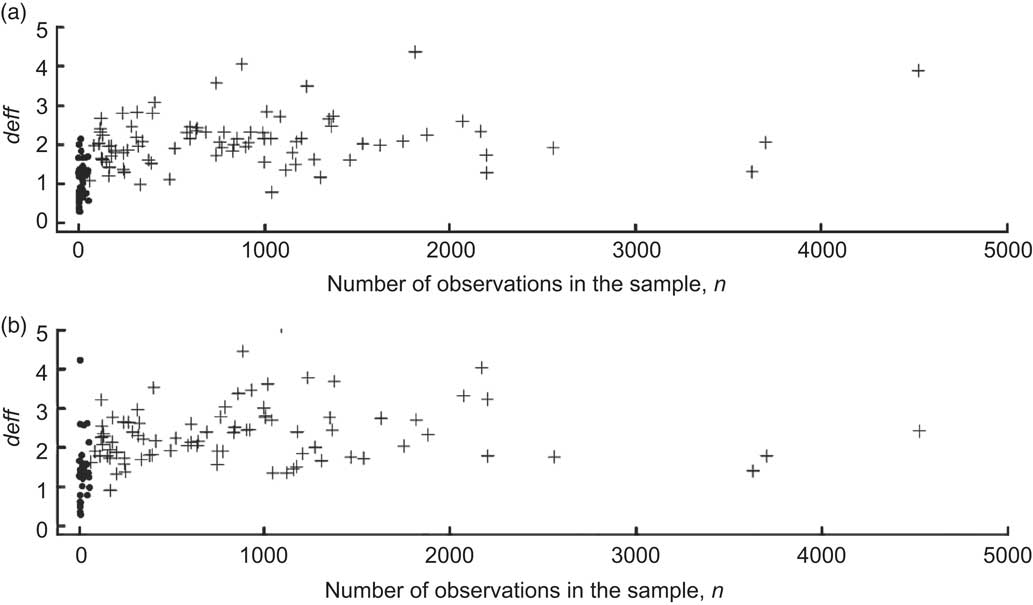
The effect of the survey design was highly variable (Fig. 1), with deff values for different food groups and estimators ranging from 0·3 to 5·1. These results are important for the analysis of nutrition surveys because an increase in the design effect affects the significance of the results. For example, a deff of 2 increases the width of the confidence interval of an estimator by 1·4 and a deff of 4 increases it by 2·0.
Final design effects (deff) for (a) mean consumption of and (b) proportion of the population who consumed the three-digit food groups of ANCNPAS07 by number of observations, calculated using the final weights (w 2), stratification and clustering of the primary sampling units. Food groups with ≤55 observations are marked by ● and those with >55 observations are marked by + (ANCNPAS07, 2007 Australian National Children's Nutrition and Physical Activity Survey)
A common error is to regard the estimate with the lowest estimated standard error as the best. However, the standard error is only correct when all aspects of the weighting and design are accounted for. For the estimate of mean consumption (proportion consuming), forty-five (fifty-seven) groups with deff > 2·0 are listed in Table 1 (Table 2). Most estimates were biased when an SRS was assumed and in all cases the confidence intervals were substantially wider when the correct sample design was used for estimation.
Food groups with deff > 2·0 for mean consumption in grams of each three-digit food group in the ANCNPAS07

ANCNPAS07, 2007 Australian National Children's Nutrition and Physical Activity Survey.
For each group the design effect (deff), the number of observations (N) and, for both a simple random sample (SRS) and the clustered design (Clustered), the estimated mean consumption and the 95 % confidence interval limits are included in the table.
Food groups with deff > 2·0 for proportion of the population who consumed the food group in the ANCNPAS07

ANCNPAS07, 2007 Australian National Children's Nutrition and Physical Activity Survey.
For each group the design effect (deff), the number of observations (N) and, for both a simple random sample (SRS) and the clustered design (Clustered), the estimated proportion of the population who consumed the food group and the 95 % confidence interval limits are included in the table.
In most cases the complex sample design increased the design effect compared with an SRS, but for some food groups design effects less than one were obtained. The low design effects occurred when the number of children consuming foods from a group was less than fifty-five, the number of clusters in the sample design (which occurred in thirty-six food groups), so there was effectively no clustering. For these groups, the observed deff averaged only 1·1 (1·4) for the mean (proportion) estimator compared with 2·1 (2·3) for the other groups (Table 3 and Fig. 1) and 44 % of the groups had a final deff < 1.
Average design effects for the three-digit food groups for mean consumption of (in grams) and proportion of the population who consumed each food group in the ANCNPAS07

ANCNPAS07, 2007 Australian National Children's Nutrition and Physical Activity Survey.
The results are split by the number of non-zero observations.
*Mean( n ≤ 55), mean estimator for groups with ≤55 observations.
†Prop( n ≤ 55), proportion estimator for groups with ≤55 observations.
‡Mean( n > 55), mean estimator for groups with >55 observations.
§Prop( n > 55), proportion estimator for groups with >55 observations.
As components of the design effect arise due to each element of the sample design, the impacts of each design element are considered separately in the following sections. In some sections, the notation (n ≤ 55) and (n > 55) will be used to split the results if required.
Weighting
The initial and final weights (w 1 and w 2) both had a similar right-skewed distribution with the same mean. The final weights had a higher standard deviation and a wider range due to the inclusion of the additional weighting component (Table 4).
Distributional information for the initial weights (w 1) and final weights (w 2) and their correlation (Corr) with the survey variables

Cw , coefficient of variation.
The theoretically expected deff for the initial weights is  = 1·3 and for the final weights is
  = 1·6. These correspond to the average observed design effect due to weighting for groups with n > 55. The 0·3 increase between w
1 and w
2 in both the theoretical and average observed deff for n > 55 occurs because neither set of weights is highly correlated with the response variables (Figs 2(a) and 3(a), Table 3). After weighting, design effects were generally below two and slightly higher for the final weights compared with the initial weights. Only six groups had deff > 2.
= 1·6. These correspond to the average observed design effect due to weighting for groups with n > 55. The 0·3 increase between w
1 and w
2 in both the theoretical and average observed deff for n > 55 occurs because neither set of weights is highly correlated with the response variables (Figs 2(a) and 3(a), Table 3). After weighting, design effects were generally below two and slightly higher for the final weights compared with the initial weights. Only six groups had deff > 2.
Design effects (deff) for mean population consumption (g) of each three-digit sub-major food group from ANCNPAS07. The contribution of each sample design feature to the magnitude of deff is illustrated by the use of estimates obtained using (a) final weights compared with initial weights; (b) stratification; (c) clustering using provided locations (incorrect clusters); and (d) clustering using the original primary sampling units (PSU). w 1 and w 2 refer to the initial and final weights, respectively. Food groups with ≤55 observations are marked by ● and those with >55 observations are marked by + (ANCNPAS07, 2007 Australian National Children's Nutrition and Physical Activity Survey)
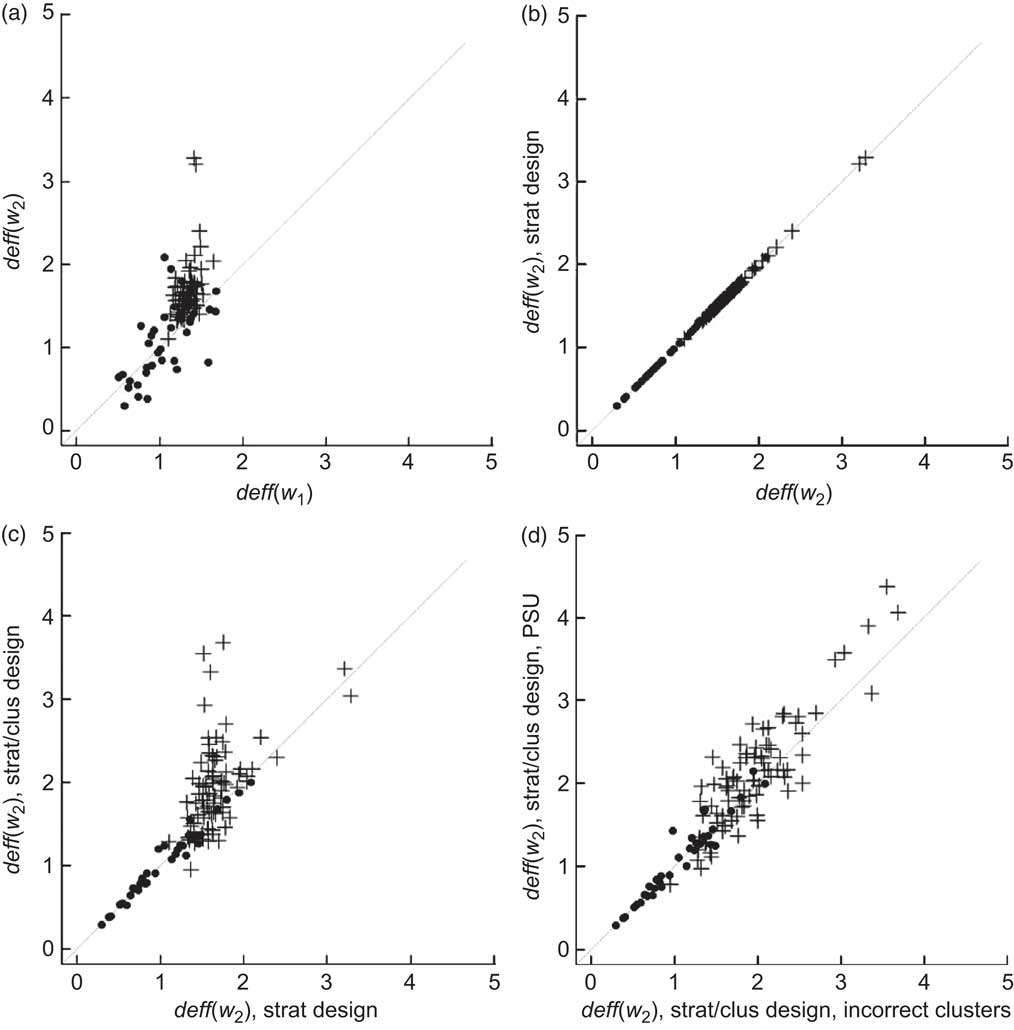
Design effects (deff) for proportion of the population who consumed each three-digit sub-major food group from ANCNPAS07. The contribution of each sample design feature to the magnitude of deff is illustrated by the use of estimates obtained using (a) final weights compared with initial weights; (b) stratification; (c) clustering using provided locations (incorrect clusters); and (d) clustering using the original primary sampling units (PSU). w 1 and w 2 refer to the initial and final weights respectively. Food groups with ≤55 observations are marked by ● and those with >55 observations are marked by + (ANCNPAS07, 2007 Australian National Children's Nutrition and Physical Activity Survey)

Weighted estimation increased the design effect, but it also reduced the bias of estimators in the survey. Assuming the estimate obtained using the final weights was unbiased, when an SRS was incorrectly assumed, the percentage bias for the mean( n > 55) (prop( n > 55)) estimator was between −15 % and 16 % (−10 % and 22 %) for 95 % of groups. Using the initial weights the percentage bias was −9 %, 11 % (−4 %, 9 %; Fig. 4). For mean( n ≤ 55) (prop( n ≤ 55)), the percentage bias had a much wider range for both an SRS, −23 %, 221 % (−43 %, 235 %), and the initial weights, −23 %, 83 % (−39 %, 91 %), and was generally positive.
Density plot of the percentage bias of estimates for (a) mean consumption of and (b) proportion of the population who consumed the three-digit food groups from ANCNPAS07. Solid lines show the simple random sample estimates compared with final weighted estimation (using w 2) and dashed lines show the initial weighted estimation (using w 1) compared with the final weighted estimation (using w 2). w 1 and w 2 refer to the initial and final weights respectively. Biases are separated into two groups representing food groups with >55 observations (shown in black) and those with ≤55 observations (shown in grey). The effect of complex survey design was not included in these calculations (ANCNPAS07, 2007 Australian National Children's Nutrition and Physical Activity Survey)

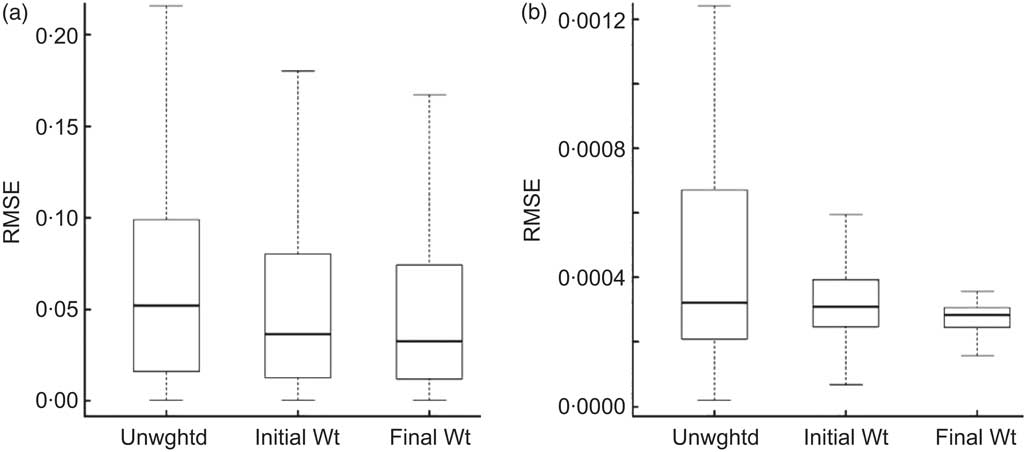
The distribution of RMSE was similar for estimates obtained using no weights, initial weights and final weights (Fig. 5). On average, the final estimates had the lowest average RMSE (0·05), followed by the initial weighted estimates (0·07) and SRS estimates (0·12).
Box-and-whisker plots of relative mean square error (RMSE) for (a) mean consumption of and (b) proportion of the population who consumed each food group from ANCNPAS07. Box-and-whisker plots are included for unweighted estimates (Unwghtd); estimates weighted using the initial weights, w 1 (Initial Wt); and estimates weighted using the final weights, w 2 (Final Wt). RMSE is calculated assuming that the final weights are unbiased (ANCNPAS07, 2007 Australian National Children's Nutrition and Physical Activity Survey)
Stratification
For this survey stratification had very little impact on the design effects. All of the estimates showed no change in deff when stratification was included (Figs 2(b) and 3(b), Table 1).
Clustering
The average increase in deff due to clustering for mean( n > 55) (prop( n > 55)) was 0·4 (0·7; Table 1), although the change in deff was highly variable for different parameters and the different estimators (Figs 2(c) and 2(d), Figs 3(c) and 3(d)). The impact of clustering depended on both the pattern of responses for the variable and the location and size of clusters. When the correct clusters were not used – for example by treating location as the sampling unit – the variance was underestimated, decreasing the average deff for mean( n > 55) (prop( n > 55)) by 0·1 (0·2) since the full cluster effect and the variation of locations within clusters was effectively ignored.
Discussion
The results show that design effects obtained for prevalence estimates of food intakes are highly variable. They depend on many factors including the number of observations, sample weighting and the complex design. The magnitude of design effects can be large, indicating that confidence intervals are significantly wider than may be expected if the complex sample design and/or weighting is ignored.
The results also illustrate that design effects depend on both the chosen parameter and the estimator which is used. The main outputs from a survey frequently consist of prevalence estimates, such a means, proportions and population totals and the design effect for each of these will be different( Reference Gambino 13 , Reference Park and Lee 14 ). Complex sample design also has an impact on the estimates of parameters of statistical analysis, such as regression parameters from a linear or logistic regression and associated odds ratios, but they differ from the design effect on prevalence estimates and are not considered here. Further complexities are introduced when ratios or post-stratification are used, or if the design effect is calculated for both the population and for estimates for subgroups.
Considering the food groups with greater than fifty-five observations per cluster, the effect of weighting is generally similar to that expected by theory. Design effects due to weighting depend on the coefficient of variation of the weights and the correlation between the weights and the survey variables( Reference Kish 9 ). The inclusion of a component of weight due to the number of children per household increased the design effect by a relatively small and consistent amount for most food groups in the survey. Those with larger changes were food groups which have a different consumption pattern for households with small or large numbers of children, for example the groups ‘dishes other than confectionery where sugar is the main ingredient’ and ‘jam and lemon spreads, chocolate spreads, sauces’.
A large proportion of the groups with less than fifty-five observations had a design effect of less than one. For these groups, most of the design effect arises due to weighting, with no appreciable change due to stratification and clustering. This occurs because the average number of non-zero observations per cluster is close to one. There is effectively no clustering, so the design effect is also close to one( Reference Gambino 13 ). At face value, deff < 1 implies that the complex sampling scheme results in a lower variance than SRS. However, the variability around one is most probably due to estimation of the sample variance. As the effective degrees of freedom may be significantly less than the nominal degrees of freedom (= number of sampled PSU – number of strata = 41)( Reference Korn and Graubard 10 ) the stability of the variance estimator may be questionable. Sampling error can then cause the observed design effect to vary randomly above and below one( 15 ). Further investigation of this possibility is beyond the scope of the current paper.
The results also illustrate that choosing the appropriate estimator for a parameter entails a trade-off between bias and design effect. Ignoring sample weights or using the wrong weight can result in a biased estimator. However, the use of weights may increase the design effect which affects the potential significance of the results. The effect of weighting also depends on the coefficient of variation of the weights and the correlation between the weights and the survey variables( Reference Kish 9 ). For the three-digit food groups in ANCNPAS07, if the clustering effect is ignored, the relatively small design effect from weighting means that in some cases an unweighted estimator has lower RMSE and may be preferred. However, it is not always possible to quantify all sources of bias. An alternative to a weighted estimator is to include survey design variables in a model for the variable of interest with unweighted regression estimation( Reference Korn and Graubard 10 ).
Considering the complex sample design, the effect of stratification is generally to decrease the design effect, because stratification removes one component of variance from the estimator. However, unless there is a large difference between strata the impact on the design effect is small, as it is in this case. The effect of clustering is determined by the number of sample units per cluster and the ICC within each cluster. As the ICC varies between 0 and 0·04 for different variables, the design effect due to clustering is highly variable and estimator specific.
In summary, design effects arise due to the interaction of the sample design and the population structure, so they will be low for universal items which do not vary geographically or by cluster such as the groups ‘milk’ or ‘savoury biscuits’. They are higher when consumption varies by, for example, geographic location, age and/or gender. Design effects arise through both unequal selection probabilities and other elements of the sample design such as stratification and clustering. Hence, to obtain accurate standard errors, all of these elements need to be taken into consideration during analysis of complex survey data and stratum and cluster indicator variables must be included with the data.
Developing an appropriate design for a nutrition survey is difficult because there is considerable uncertainty about the values of relevant population characteristics such as the ICC and the likely number of observations. Also these parameters vary between variables and the type of analysis. A high degree of clustering can lead to a large design effect, but reducing the clustering increases costs.
Knowing the approximate magnitude of the design effect for an estimator is useful when designing future surveys. Design effects can be used to estimate the required sample size(s) for future surveys and the use of weighting, the choice of weights and also the degree of clustering and stratification in the survey can be tailored to achieve the desired standard error or power. Design effects are widely applicable and can be calculated for any estimator of a wide range of variables including macro- or micronutrient intakes for the population or for sub-populations. Estimators include means, totals, proportions or more complex estimators such as regression estimators – for which cluster effects are often lower( Reference Gambino 13 ).
In conclusion, ignoring complex survey design can result in underestimating the width of confidence intervals, higher mean square errors and biased estimators. The magnitude of these effects depends on both the parameter under consideration and the chosen estimator. It is important to consider the effects of complex sample design when both designing and analysing surveys.
Acknowledgments
The authors acknowledge the Australian Social Science Data Archive for use of the data. Those who carried out the original analysis and collection of the data bear no responsibility for the further analysis or interpretation of them. This research received no specific grant from any funding agency in the public, commercial or not-for-profit sectors. The authors have no conflicts of interest to declare. S.B. conducted the analyses and was the main author of the paper. Y.P. provided nutritional input and helped interpret the results. D.S. and L.T. conceived the idea for the study. D.S. provided statistical expertise, helped interpret the results, wrote sections of the manuscript and edited the manuscript. L.T. provided nutritional expertise, helped interpret the results and edited the manuscript.



