

Introduction
Determining the extent of suitable habitat to effectively plan species management is a challenge, especially for poorly studied areas. Lack of ecological and biological information for species of conservation concern is often a barrier to constructing reliable habitat selection models and predicting the availability of suitable habitat over wider areas.
Quantitative models are used widely to describe landscape patterns and predict species distribution, providing useful ecological insight, strong predictive capacity and potential for applied conservation (Elith & Leathwick, Reference Elith and Leathwick2009; Pearson, Reference Pearson2010). Models are built on the relationship between species presence records and environmental variables predicting the distribution of selected species (Elith & Leathwick, Reference Elith and Leathwick2009). Accurate distribution models require spatial predictor variables that are ecologically relevant for the modelled species (He et al., Reference He, Bradley, Cord, Rocchini, Tuanmu and Schmidtlein2015). Predicted results can be used to guide field surveys towards regions where threatened species are likely to occur, and to identify sites where conservation and management actions should be prioritized (Pearson, Reference Pearson2010). Researchers often have to rely on species presence data alone, and several studies have used Maxent software (Philips et al., Reference Philips, Anderson and Schapire2006) to produce species distribution maps from presence-only data. However, the effectiveness of Maxent software has been questioned as it produces a number of poorly defined indices. This can cause inferential error or under-estimation of population sizes compared to estimates produced with logistic regression models that facilitate more easily interpretable ecological quantities (Royle et al., Reference Royle, Chandler, Yackulic and Nichols2012).
The green peafowl Pavo muticus would benefit from landscape-scale distribution modelling to aid its conservation. It was recategorized from Vulnerable to Endangered on the IUCN Red List in 2009 because of high hunting pressure and habitat destruction (BirdLife International, 2016). The historic species distribution covered almost the entire dry forest area of South-east Asia, including north-east India, Bangladesh, Yunnan (south-west China), Myanmar, Thailand, Lao, Viet Nam, northern Cambodia, Java (Indonesia) and peninsular Malaysia (McGowan et al., Reference McGowan, Duckworth, Xianji, Van Balen, Xiaojun and Khan1999). However, the populations in Bangladesh and Malaysia are considered extinct (BirdLife International, 2016) and the remaining population in Indochina is at risk from hunting (Brickle et al., Reference Brickle, Duckworth, Tordoff, Pole, Timmins and McGowan2008).
The objectives of this study were (1) to predict the extent of remaining suitable habitat for the green peafowl in mainland South-east Asia that could host viable populations, and to define how much of the species’ range was lost over the past century, (2) to identify key localities with a sufficiently large patch of suitable habitat to contribute to the long-term survival of this species, (3) to prioritize locations where surveys to estimate population densities and monitor the long-term changes should be implemented as part of management plans and (4) to highlight locations outside protected areas where management and outreach programmes are required to maintain the green peafowl population.
Study area
We modelled green peafowl distribution for the remaining parts of the species’ range in mainland South-east Asia (Myanmar, Thailand, Lao, Cambodia and Viet Nam). We excluded eastern India because there are no reliable records from this area. We also excluded China, which has been studied separately (Kong et al., Reference Kong, Wu, Shan, Gao, Yan, Luo and Yang2018 provide evidence for a recent decline in the populations in Yunnan and Tibet), and Java as the geographical separation of the Javanese green peafowl populations led to differences in their ecology and response to human disturbance (Van Balen et al., Reference Van Balen, Prawiradilaga and Indrawan1995; McGowan et al., Reference McGowan, Duckworth, Xianji, Van Balen, Xiaojun and Khan1999).
Methods
Species record locations
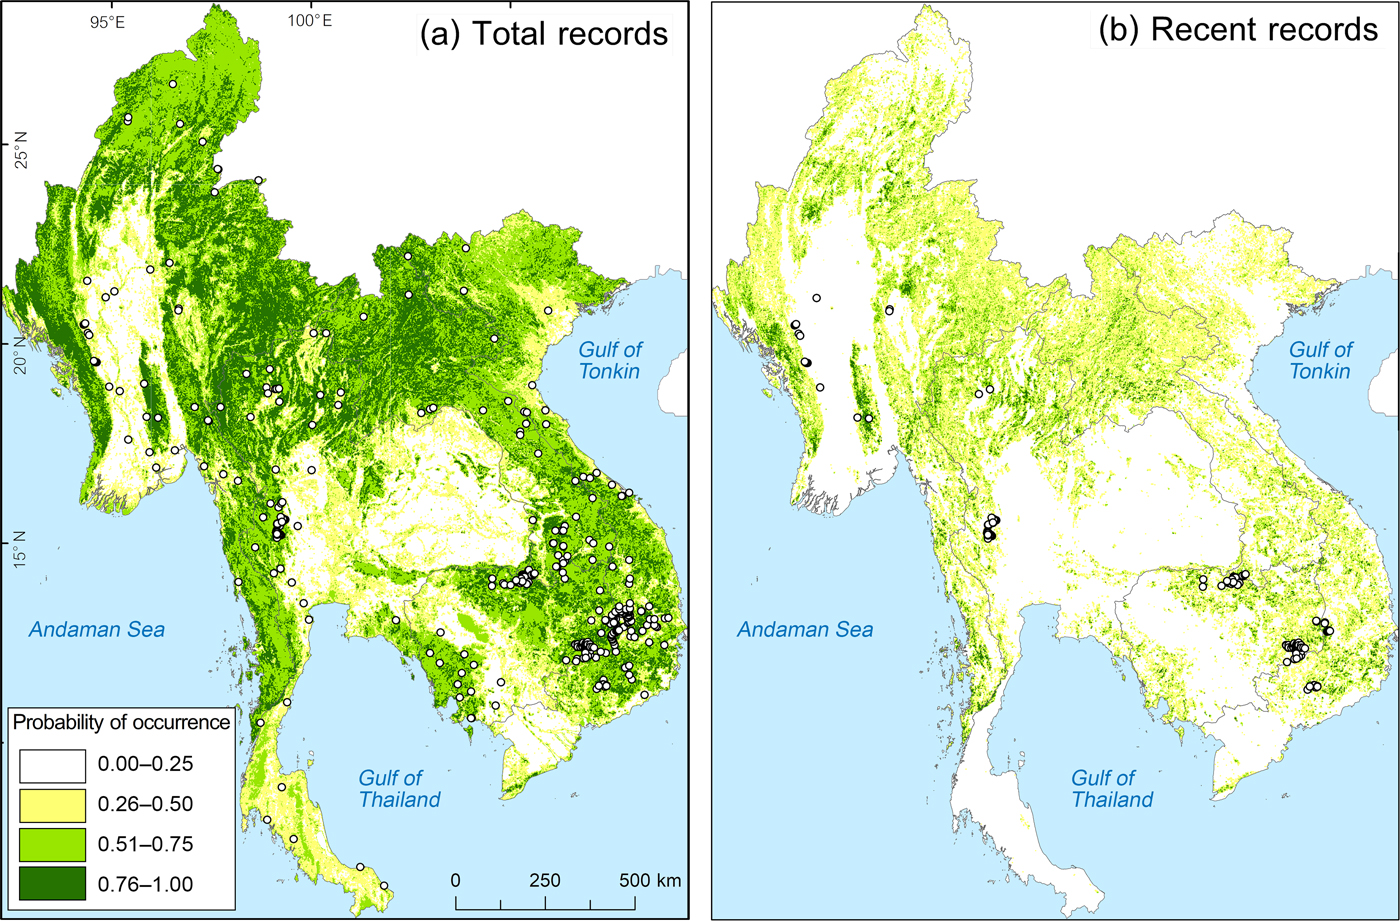
We gathered locations of 901 individual records (visual, calls and camera-trap photos) from Boakes et al. (Reference Boakes, McGowan, Fuller, Chang-qing, Clark, O'Connor and Mace2010) and from the Global Biodiversity Information Facility (GBIF, 2016), which were collected during 1874–2015. We divided record locations into two data sets: total records (1874–2015, 901 records) and recent records (2009–2015, 487 records), which define the confirmed changes from declining to stable remaining populations (Boakes et al., Reference Boakes, McGowan, Fuller, Chang-qing, Clark, O'Connor and Mace2010; GBIF, 2016). Total records were used to model the green peafowl's historical occurrence range. We used land-cover data from 2009 to input habitat variables for modelling the probability of occurrence.
We created a 1-km radius circular plot around each record. When two circular plots overlapped > 5% we selected only the location of the latest record to represent the area. The radius of 1 km was selected based on the farthest detection distance for both auditory and visual detection of the green pea fowl (Indrawan, Reference Indrawan1995; Brickle et al., Reference Brickle, Cu, QuyQuynh, TuCuong and Van San1998; Sukumal et al., Reference Sukumal, McGowan and Savini2015). We derived 337 circular plots from total records and 125 from recent records for habitat assessment to model the historical and recent occurrence range, respectively.
Habitat variables data
We used a total of 14 habitat variables for modelling probability of occurrence. Altitude data were obtained from WorldClim (2005), and land-cover variables were derived from GlobCover LandCover 2009 (Bontemps et al., Reference Bontemps, Defourny, van Bogaert, Ariono, Kalogirou and Perez2011). We recategorized land-cover data to ensure they were compatible with mainland South-east Asian land-cover types. Starting with 22 original land-cover types, we grouped our data into 13 land-cover categories. We compared the resulting categories with geographical information system (GIS) databases from each country to check for accuracy (Supplementary Table 1).
Probability of occurrence modelling
We used the total records to model the historical probability of occurrence and the recent records to model the current probability of occurrence. We constructed probability of occurrence models using an infinite weight logistic model (Hefley & Hooten, Reference Hefley and Hooten2015) to investigate the relationship between given habitat covariates and probability of occurrence from a used vs available habitat selection model. Used locations were based on presence-only data from each dataset. Available locations were generated from systematic random sampling by placing locations at 5-km intervals within the rectangular extent covering used locations. We determined the rectangular extent of used and available locations using clip and sampling tool extensions in ArcGIS 10.3.1 (Esri, Redlands, USA; Supplementary Fig. 1). We created a 1-km circular plot around each available location and determined altitude and land-cover type (based on the 13 land-cover categories) for each plot. We standardized continuous variables to transform the data to the same scale. This was achieved by subtracting the mean from the value and dividing by the standard deviation (Gelman, Reference Gelman2008). We used the Monte Carlo method to determine the adequate number of available locations used in the model based on the stabilized β coefficient of the best-fit model. In total we used 15,965 available locations to compare with recent records and 207,827 to compare with total records. We conducted all statistical analyses in R 3.3.1 (R Development Core Team, 2014).
We selected the best-performing model by the lowest Akaike information criterion (AIC). This model provides the best estimate of coefficient values for each habitat variable. We then created a grid of 3.14 km2-squares (to be standardized with 1-km radius circular plots) covering mainland South-east Asia and generated a map of the predicted probability of occurrence for the green peafowl in each grid cell. To define the probability of occurrence model for the historical range (total records, 337 records), we used the 2009 GIS database for habitat variables, assuming that the original suitable habitat was still present before 2009 and that any local extinction before 2009 was not caused by habitat loss (McGowan et al., Reference McGowan, Duckworth, Xianji, Van Balen, Xiaojun and Khan1999; Madge & McGowan, Reference Madge and McGowan2002; see Fig. 1 for a summary and Supplementary Table 1 for details).
Flow chart depicting the sequence of analytical steps used to define stronghold areas (see Methods for details).

We included a total of 15,965 available random locations to compare with recent record locations, and 207,827 available random locations to compare with total record locations.
Identifying key localities
We identified key localities based on overlap between the high probability of occurrence map (p > 0.5), the open forest map, and recent records. The open forest map combined deciduous, mixed evergreen and deciduous forest, and forest mixed with grassland from the GIS database. We grouped key localities into three categories: (1) high potential and confirmed areas, with overlap between high probability of occurrence areas, open forest, and recent record locations, (2) potential and confirmed areas, with overlap between open forest and recent record locations and (3) high potential but not confirmed areas, with overlap between high probability of occurrence areas, open forest, and historical records (Fig. 3).
To examine the protection level of key locality areas, we overlaid the protected area boundaries over potential areas of occurrence. To investigate habitat outside protected areas, we overlaid forest and agriculture cover over potential areas of occurrence in grid cells outside protected areas. The area with a high probability of occurrence (p > 0.5) based on recent records (Fig. 2b) was overlaid with protected areas (UNEP-WCMC & IUCN, 2014), open forest areas (deciduous forest, mixed evergreen and deciduous forest), and agricultural areas (Ramankutty et al., Reference Ramankutty, Evan, Monfreda and Foley2010) to investigate the situation in each country in more detail.
Predicted green peafowl Pavo muticus distribution from modelling based on (a) total records (1874–2015) and (b) recent records (2009–2015).
Predicting population number and stronghold areas
We used the estimated density of 0.253 calling birds/km2 for the highly disturbed YokDon National Park, Viet Nam, (Sukumal et al., Reference Sukumal, McGowan and Savini2015) as the minimum population density. We multiplied this value by the size of key localities to obtain an estimate of the minimum population size. The maximum estimated density was 11.343 calling birds/km2 in HuaiKhaKhaeng Wildlife Sanctuary, Thailand, an area with very little disturbance (Sukumal et al., Reference Sukumal, Dowell and Savini2017). With this, we calculated the maximum population size estimate for each key locality. We assumed 500 individuals to be the minimum required for long-term survival of a population, based on studies of other Galliformes (Grimm & Storch, Reference Grimm and Storch2000; Zhang & Zheng, Reference Zhang and Zheng2007). We used this value to determine areas holding a viable population (minimum 44 km2 of suitable area based on the maximum density estimation).
Based on this we defined stronghold areas as those with an estimated population > 500 individuals, with high population density and low intensity of disturbance, the latter being defined as overlapping with protected areas.
Results
Probability of occurrence and key localities
The best model (lowest AIC) included altitude and forest mixed with grassland. Using total records, the range model showed the probability of occurrence being significantly negatively influenced by altitude and cropland, but positively influenced by area of forest mixed with grassland (Table 1, Fig. 2a). Using recent records the probability of occurrence was negatively influenced by altitude but positively by forest mixed with grassland (Table 1, Fig. 2b).
Parameters that influence the probability of occurrence model based on recent and total records of the green peafowl Pavo muticus.
*P < 0.05; **P < 0.0001.
In Myanmar the remaining suitable habitat for the green peafowl is predicted to be 88,118 km2 (19% of the historical range), divided into four locations (protected areas in key localities 1 and 2; Table 2, Fig. 3) In Thailand the model predicted remaining suitable habitat to be 33,105 km2 (18.5% of the historical range). The highest population density of 11.343 calling birds/km2 is in the highly protected HuaiKhaKhaeng Wildlife Sanctuary (Table 2, Fig. 3). A second important population was found in neighbouring protected areas at key locality 5 (N. Sukumal, pers. obs.; Table 2, Fig. 3). There is an area of contiguous locations with confirmed recent records in protected areas at key locality 4 (Table 2, Fig. 3).
Predicted number of calling green peafowl males across sites in mainland South-east Asia. The minimum number of calling males is based on a density of 0.253/km2 observed in YokDon National Park, Viet Nam, an area with a high level of anthropogenic disturbance (Sukumal et al., Reference Sukumal, McGowan and Savini2015). The maximum number is based on 11.343/km2, as observed in HuaiKhaKhaeng Wildlife Sanctuary, Thailand, where anthropogenic disturbance is low (Sukumal et al., Reference Sukumal, Dowell and Savini2017).
1 NP, National Park; NR, Nature Reserve; PF, Protected Forest; WS, Wildlife Sanctuary.
2 Blank cells indicate that the key locality was outside a stronghold.
Potential areas classified as (1) high potential and confirmed areas from overlay between contiguous areas of high probability of occurrence (P > 0.5) based on recent record model, open forest (dry dipterocarp forest, mixed deciduous forest, and forest mixed with grassland), and recent record locations; (2) potential and confirmed areas from overlay between open forest and recent record locations; and (3) high potential but unconfirmed areas from overlay between high probability of occurrence (P > 0.5) based on recent record model, open forest, and historical record locations. Hatched polygons are protected areas that overlap with potential areas.

Remaining suitable habitat in Lao is predicted to be 30,439 km2 (14.9% of the historical range). Green peafowl was only reported in 2002 from one site in the south, close to the Cambodian and Thai border, in Dong Khanthung Provincial Protected Area (Vongkhamheng et al., Reference Vongkhamheng, Phiapalath, Vongkhamheng and Ounmany2012; Table 2).
For Cambodia our model predicted remaining suitable habitat to be 14,256 km2 (13.2% of the historical range), mostly in the north and east of the country. Recent records from 2008–2010 are available for key localities 10 and 11. In the eastern dry plains the species was recorded during 2005–2014 in protected areas at key localities 12 and 14 (Table 2). Outside these protected areas our model predicted that a further 550.38 km2 had a high probability of occurrence (Fig. 4a,b).
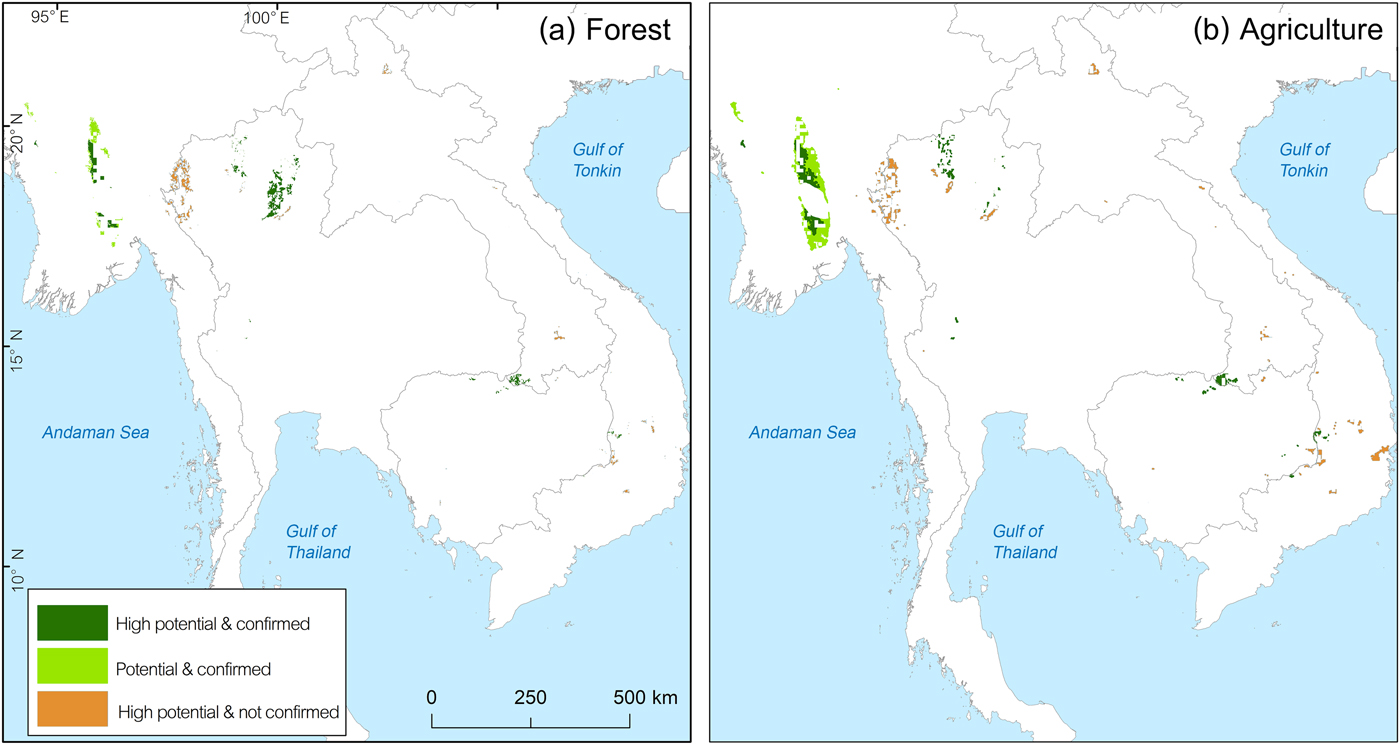
Potential areas outside protected areas which are (a) inside unprotected open forest and (b) overlapping with agricultural areas.
Remaining habitat suitable for green peafowl is predicted to be 19,681 km2 in Viet Nam (9.4% of the historical range). The area with the highest potential is YokDon National Park, connected to five protected areas in the dry eastern plains of Cambodia (Fig. 3). However, this site shows high levels of disturbance (Sukumal et al., Reference Sukumal, McGowan and Savini2015). Another location is CatTien National Park, which contains scattered habitat patches (Table 2, Fig. 3).
Defining stronghold locations
Our model predicted two potential and four confirmed stronghold populations (Fig. 5).
Predicted stronghold areas for green peafowl populations. Solid rectangles are confirmed stronghold areas, defined as having medium to high levels of protection and contiguous areas of protected land. Dashed rectangles are expected stronghold areas, defined by large patches of suitable habitat but requiring confirmation of species records and density estimation. Numbers in circles refer to key localities (Table 2).
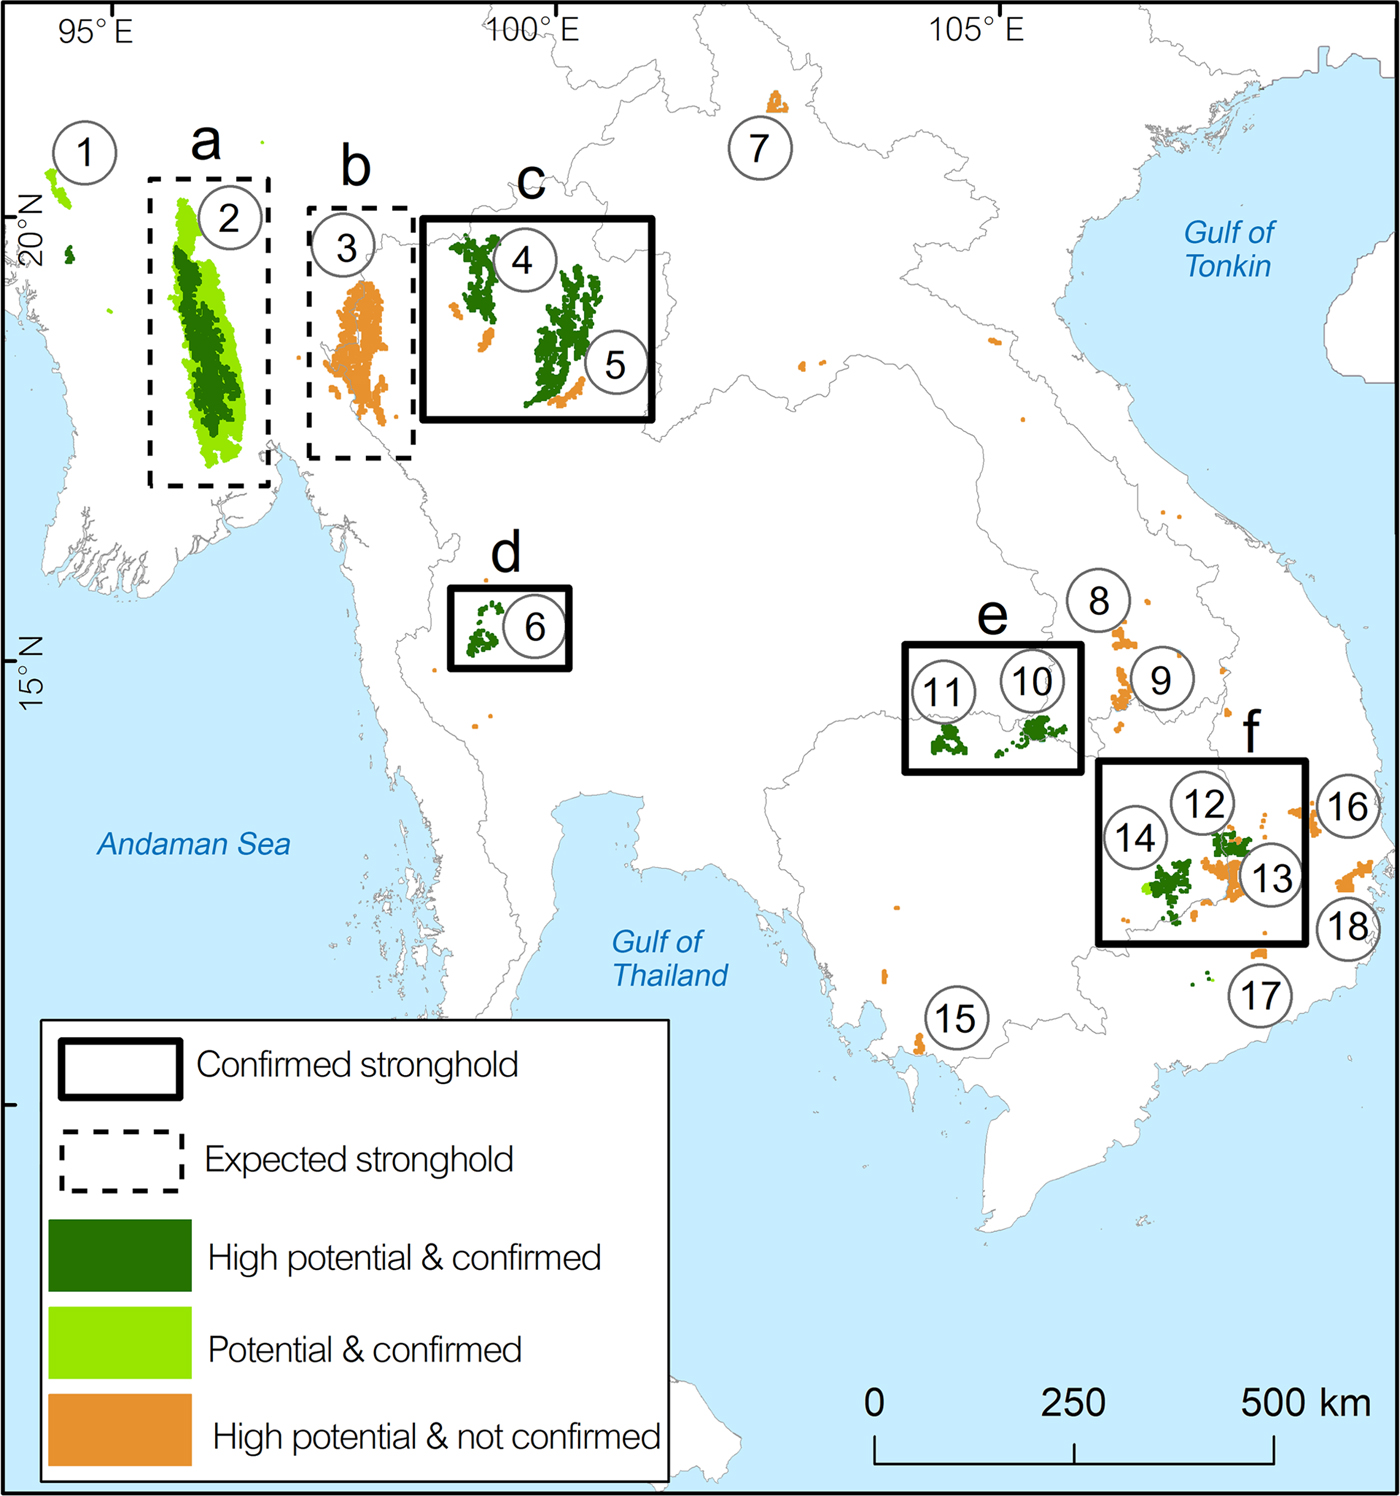
The two potential strongholds were labelled (a) and (b). Stronghold (a) is represented by the complex of three protected areas (key locality 2, Table 2). Stronghold (b) in north-west Thailand and adjacent south-east Myanmar is a large continuous patch of potential habitat covered by six protected areas on the Thai side and unprotected areas in Myanmar (key locality 3, Table 2).
We applied the labels (c), (d), (e) and (f) to the confirmed strongholds. Stronghold (c) in north Thailand comprised nine protected areas with a high protection level in key localities 4 and 5 (Table 2). Stronghold (d) in HuaiKhaKaeng Wildlife Sanctuary is a highly protected area that showed a population increase (key locality 6, Table 2) over the last decade (Sukumal et al., Reference Sukumal, Dowell and Savini2017). Stronghold (e) is located outside protected areas in southern Lao and connected to PreahVihear Protected Forest and Kuloen Promtep Protected Forest in Cambodia. If the different key locations of this stronghold can be connected and protection improved the area is expected to host a viable population (Table 2). Stronghold (f) is a large patch located within four contiguous protected areas in eastern Cambodia and one in Viet Nam (key localities 12 and 14, Table 2).
Discussion
Our model predicted that a total of 185,602 km2 of habitat suitable for the green peafowl remains across its range in mainland South-east Asia. This represents a decrease of 84% compared to the historical distribution. Thus the species occurs in only 16% of its estimated original range covering the recently defined South-east Asia savannah woodland (Ratnam et al., Reference Ratnam, Tomlinson, Rasquinha and Sankaran2016). The key localities with capacity to contribute to the long-term survival of this species are mostly limited to protected areas (28 protected areas in total; Table 2). However, the protection level varies between different areas, with many requiring mitigation of disturbance and hunting. We predict six population strongholds, which are mostly inside protected areas. Only one stronghold in southern Myanmar is outside protected areas and overlaps with agricultural areas.
Population strongholds in protected areas
Most lowland habitat inside protected areas within the green peafowl's range is experiencing high levels of human disturbance, mainly through hunting/poaching and agricultural encroachment (Brickle et al., Reference Brickle, Duckworth, Tordoff, Pole, Timmins and McGowan2008, Kong et al., Reference Kong, Wu, Shan, Gao, Yan, Luo and Yang2018). However, the green peafowl shows tolerance to habitat degradation and can recover following protection, as has been shown in western Thailand (Sukumal et al., Reference Sukumal, Dowell and Savini2017) and south Viet Nam (Sukumal et al., Reference Sukumal, McGowan and Savini2015).
With effective protection and management that lowers poaching pressure inside and outside the protected areas, the large potential stronghold (a) in Myanmar (Fig. 5) could become one of the main areas contributing to the species’ long-term persistence in the western part of its range. To enable conservation management and planning in this area, an extensive population monitoring programme is needed to estimate the species’ distribution, density and threats to its survival.
In Thailand, stronghold (d) in HuaiKhaKhaeng Wildlife Sanctuary is the most important area for the species (Fig. 5). This sanctuary is included in the Western Forest Complex, considered the largest remaining forest tract in mainland South-east Asia (designated UNESCO World Heritage Site; WEFCOM, 2004). This population is highly protected with frequent patrols preventing disturbance (i.e. poaching), a consequence of the large resident tiger population in the area (Duangchantrasiri et al., Reference Duangchantrasiri, Umponjan, Simcharoen, Pattanavibool, Chaiwattana and Maneerat2015), and showed a clear improvement since 1992 (Sukumal et al., Reference Sukumal, Dowell and Savini2017). There is potential for the resident population to expand to adjacent protected areas such as ThungYai Naresuan Wildlife Sanctuary.
Stronghold (c) in northern Thailand is located in contiguous protected areas (Fig. 5). The species’ presence in the area was confirmed, but the threat level is still unclear and a monitoring programme is required to investigate population size and threats. In the north-western part of Thailand the potential stronghold (b), including six small protected areas (Fig. 5), could be an important site for the green peafowl, but surveys are required to confirm the presence of the species before estimating its population density.
In Cambodia and Viet Nam we identified two potential strongholds within protected areas. The largest stronghold (f) in the eastern dry plains of Cambodia is expected to host the main population in the country (Gray et al., Reference Gray, Pollard, Evans, Goes, Grindley and Omaliss2014; key localities 12 and 14 of stronghold (f) in Fig. 5). This area is connected with YokDon National Park in south-central Viet Nam, which used to host one of the main populations in that country (Brickle, Reference Brickle2002), although this has declined sharply in recent years (Sukumal et al., Reference Sukumal, McGowan and Savini2015). This stronghold has been intensively surveyed by the World Wide Fund for Nature and the Wildlife Conservation Society Cambodia (Gray et al., Reference Gray, Pollard, Evans, Goes, Grindley and Omaliss2014), resulting in a green peafowl density higher than that estimated in neighbouring YokDon National Park (Chandara, Reference Chandara2017), where high hunting pressure and habitat disturbance have caused a large decline over the past decade (Sukumal et al., Reference Sukumal, McGowan and Savini2015). The higher recorded density on the Cambodian side of the border could aid recovery of the population on the Vietnamese side if protection could be enhanced and hunting reduced. Overall the entire stronghold requires better protection; decreases in other wildlife populations have been reported as a result of high hunting pressure (Rostro-Garcia et al., Reference Rostro-Garcia, Kamler, Ash, Clements, Gibson and Lynam2016).
The second stronghold in Cambodia is stronghold (e) in the northern part of the country (Fig. 5) where discrete habitat patches are contiguous with unprotected ones in southern Lao. In this stronghold the green peafowl was reported to be widespread but at low density (Goes, Reference Goes2009). A systematic survey is required to confirm distribution and density, and to investigate the variables that may affect the population. It is also necessary to manage patch connectivity between these two protected areas.
Population stronghold outside protected areas
In Myanmar a large potential stronghold outside protected areas is stronghold (a) in the central part of the country (Fig. 5), mostly overlapping with agricultural areas (63.15% overlap). The species’ presence was confirmed by a research project conducted during April–May 2013 in part of North Zamayi Reserve Forest (Fig. 3). In addition, our investigations during January 2018 found a footprint and feather of this species and captive birds trapped by villagers at six sites in this area.
So far this potential stronghold has not received much conservation attention, and a high poaching rate was recently reported despite conservation actions carried out to support resident Asian elephant Elephas maximus populations (Sampson et al., Reference Sampson, McEvoy, Min Oo, Myo Chit, Nyein Chan and Tonkyn2018). The development of an education outreach programme aimed at increasing the local community's awareness of wildlife protection would benefit the green peafowl. Local conservation groups could be set up to address and mitigate disturbance and poaching, with the aim to secure the long-term survival of this and other wildlife species. This has proved a successful strategy in a different area in Shan state, Myanmar, where a local community environmental protection group has taken steps to protect a small peafowl population (Mu Aung et al., Reference Mu Aung, Win New and Naing Oo2018).
In Thailand the potential stronghold (b), not yet included in the protected area system, is in the north-western part of the country close to the Myanmar border (Fig. 5). The habitat in this stronghold is scattered between small protected areas and unprotected forest. A survey is required to confirm the presence of a green peafowl population and its status. Stronghold (c) is a second stronghold with scattered habitat patches connecting protected areas (Fig. 5). These areas require management with a particular focus on patch connectivity between protected areas. A conservation outreach programme may also be required to mitigate hunting pressure. Conservation actions in this area are currently focused on adapting specific agricultural patches, primarily at the edge of protected areas, to provide open lekking areas during the breeding season. Such activities, including leaving parts of fields unplanted and cutting shrubs, were recently carried out by villagers living adjacent to protected areas (N. Sukumal, pers. obs.).
In southern Lao the DongKhanthung Provincial Protected Area, included in the potential key locality 10 (Fig. 5), was reported to have a viable green peafowl population but is facing high hunting pressure and habitat degradation (Vongkhamheng et al., Reference Vongkhamheng, Phiapalath, Vongkhamheng and Ounmany2012). Establishment of an education outreach programme and the setting up of a local conservation group in this area may help reduce habitat disturbance and hunting pressure.
In eastern Cambodia several patches scattered between protected areas (key locality 13, Fig. 5) could create connections between the four major protected areas in Cambodia and two in Viet Nam. Achieving patch connectivity and decreasing hunting pressure are priorities. An education outreach programme may be required around these protected areas to increase awareness amongst the local community.
Other potential areas
Small patches of potentially suitable habitat are scattered across the species’ range, with confirmed species records from western Myanmar (key locality 1, Fig. 5). These areas are located both inside and outside protected areas adjacent to large patches of suitable unprotected forest (Fig. 2b). A systematic survey to estimate population density is needed. We also recommend the establishment of a protected area to connect with Shwesettaw Wildlife Sanctuary. Our model identified other small key localities across mainland South-east Asia but the species’ presence is not confirmed. We therefore suggest detailed surveys in these areas (key localities 5, 7, 8, 9, 15, 16, 17 and 18; Fig. 5), which are located inside and outside protected areas (Table 2).
Conservation implications
The most suitable habitat for the green peafowl is concentrated in lowland open dry forest (Fig. 2b, Table 1). This habitat is now decreasing and becoming fragmented as a result of agriculture and construction encroachment. Because of the economic importance of these localities, most protected areas have been designated at higher altitudes (Round, Reference Round2014). Programmes aimed at improving local community awareness and exploring alternative livelihoods are necessary to mitigate the anthropogenic threats to the remaining lowland habitats and ensure the long-term conservation of the green peafowl and other lowland forest species.
The recent range and distribution of the green peafowl have rapidly contracted compared to the assumed historical distribution. Most of the remaining populations are now restricted to protected areas of varying protection levels, with some areas showing advanced deterioration of the population (Harrison et al., Reference Harrison, Sreekar, Brodie, Brook, Luskin and O'Kelly2016).
Only one area, HuaiKhaKhaeng Wildlife Sanctuary in Thailand, was confirmed to have a well-protected, viable population at a healthy population density (Sukumal et al., Reference Sukumal, Dowell and Savini2017). Other strongholds with large patches of suitable habitat (Fig. 5) still require density estimates and research on the variables affecting long-term survival of the green peafowl. Increasing protection activities (i.e. patrolling) improved both green peafowl and other wildlife populations inside protected areas (Duangchantrasiri et al., Reference Duangchantrasiri, Umponjan, Simcharoen, Pattanavibool, Chaiwattana and Maneerat2015; Sukumal et al., Reference Sukumal, Dowell and Savini2017), but increased awareness amongst local communities around these areas is also necessary to support long-term conservation. In addition, increasing green peafowl populations could help support the recovery of large predators that prey on them (Sukumal et al., Reference Sukumal, Dowell and Savini2017). This could affect, for example, the rapidly declining South-east Asian leopard Panthera pardus delacouri, which only remains in a few areas that largely overlap with green peafowl habitat in key localities 2, 3, 6, 12, 13 and 14 (Fig. 5; Rostro-Garcia et al., Reference Rostro-Garcia, Kamler, Ash, Clements, Gibson and Lynam2016). Other associated species with overlapping distribution include the tiger Panthera tigris and banteng Bos javanicus. We recommend further investigation of the range overlap of these species and their co-dependencies.
Acknowledgements
This research was supported by King Mongkut's University of Technology Thonburi, Thailand (grant numbers KM-Wor1 56_peafowl and 3-TMB-peafowl-KM55) and the Rufford Small Grant Foundation (grant number 17837-2). NS was supported by the Royal Golden Jubilee Ph.D. Program, Thailand (grant number PHD/0105/2553) and the Newton Fund. We thank M. Grainger, J.C. Dunn, T.N.E. Gray, M. Nuttall, and A. Mould for supplying data on green peafowl record locations; N. Tantipisanuh and D. Ngoprasert for help with data analysis; Khin Maung Oo, N.M. Shwe, WWF Cambodia for assistance with fieldwork; P.D. Round, S.J. Brown and G.A. Gale for their critiques.
Author contributions
Project design: NS, SDD, TS; data analysis and writing: all authors.
Conflicts of interest
None.
Ethical standards
This research abided by the Oryx guidelines on ethical standards and did not involve human subjects, experimentation with animals or collection of specimens.


